Note
Access to this page requires authorization. You can try signing in or changing directories.
Access to this page requires authorization. You can try changing directories.
Applies to: ✅ SQL analytics endpoint and Warehouse in Microsoft Fabric
The article explains compute usage reporting of the Fabric Data Warehouse, which includes read and write activity against the Warehouse, and read activity on the SQL analytics endpoint of the Lakehouse.
When you use a Fabric capacity, your usage charges appear in the Azure portal under your subscription in Microsoft Cost Management. To understand your Fabric billing, visit Understand your Azure bill on a Fabric capacity.
For more information about monitoring current and historical query activity, see Monitor in Fabric Data warehouse overview.
Capacity
In Fabric, based on the Capacity SKU purchased, you're entitled to a set of Capacity Units (CUs) that are shared across all Fabric workloads. For more information on licenses supported, see Microsoft Fabric concepts and licenses.
Capacity is a dedicated set of resources that is available at a given time to be used. Capacity defines the ability of a resource to perform an activity or to produce output. Different resources consume CUs at different times.
Capacity in Fabric Data Warehouse
In the capacity-based SaaS model, Fabric Data Warehouse aims to make the most of the purchased capacity and provide visibility into usage.
CUs consumed by Fabric Data Warehouse include read and write activity against the Warehouse, and read activity on the SQL analytics endpoint of the Lakehouse.
In simple terms, 1 Fabric capacity unit = 0.5 Warehouse vCores. For example, a Fabric capacity SKU F64 has 64 capacity units, which is equivalent to 32 Warehouse vCores.
Compute usage reporting
The Microsoft Fabric Capacity Metrics app provides visibility into capacity usage for all Fabric workloads in one place. Administrators can use the app to monitor capacity, the performance of workloads, and their usage compared to purchased capacity.
Initially, you must be a capacity admin to install the Microsoft Fabric Capacity Metrics app. Once installed, anyone in the organization can have permissions granted or shared to view the app. For more information, see Install the Microsoft Fabric Capacity Metrics app.
Once you have installed the app, select the Warehouse from the Select item kind: dropdown list. The Multi metric ribbon chart chart and the Items (14 days) data table now show only Warehouse activity.

Warehouse operation categories
You can analyze universal compute capacity usage by workload category, across the tenant. Usage is tracked by total Capacity Unit Seconds (CUs). The table displayed shows aggregated usage across the last 14 days.
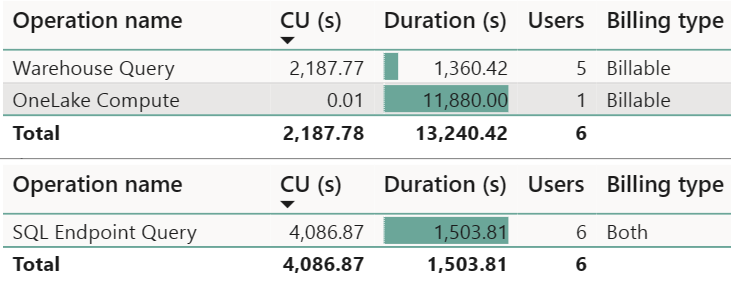
Both the Warehouse and SQL analytics endpoint rollup under Warehouse in the Metrics app, as they both use SQL compute. The operation categories seen in this view are:
- Warehouse Query: Compute charge for all user-generated and system-generated T-SQL statements within a Warehouse.
- SQL analytics endpoint Query: Compute charge for all user generated and system generated T-SQL statements within a SQL analytics endpoint.
- OneLake Compute: Compute charge for all reads and writes for data stored in OneLake.
For example:
Timepoint explore graph
This graph in the Microsoft Fabric Capacity Metrics app shows utilization of resources compared to capacity purchased. 100% of utilization represents the full throughput of a capacity SKU and is shared by all Fabric workloads. This is represented by the yellow dotted line. Selecting a specific timepoint in the graph enables the Explore button, which opens a detailed drill through page.

In general, similar to Power BI, operations are classified either as interactive or background, and denoted by color. Most operations in Warehouse category are reported as background to take advantage of 24-hour smoothing of activity to allow for the most flexible usage patterns. Classifying data warehousing as background reduces the frequency of peaks of CU utilization from triggering throttling.
Timepoint drill through graph

This table in the Microsoft Fabric Capacity Metrics app provides a detailed view of utilization at specific timepoints. The amount of capacity provided by the given SKU per 30-second period is shown along with the breakdown of interactive and background operations. The interactive operations table represents the list of operations that were executed at that timepoint.
The Background operations table might appear to display operations that were executed much before the selected timepoint. This is due to background operations undergoing 24-hour smoothing. For example, the table displays all operations that were executed and still being smoothed at a selected timepoint.
Top use cases for this view include:
Identification of a user who scheduled or ran an operation: values can be either "User@domain.com", "System", or "Power BI Service".
- Examples of user generated statements include running T-SQL queries or activity in the Fabric portal, such as the SQL Query editor or Visual Query editor.
- Examples of "System" generated statements include metadata synchronous activities and other system background tasks that are run to enable faster query execution.
Identification of an operation status: values can be either "Success", "InProgress", "Cancelled", "Failure", "Invalid", or "Rejected".
- The "Cancelled" status are queries cancelled before completing.
- The "Rejected" status can occur because of resource limitations.
Identification of an operation that consumed many resources: sort the table by Total CU(s) descending to find the most expensive queries, then use Operation Id to uniquely identify an operation. This is the distributed statement ID, which can be used in other monitoring tools like dynamic management views (DMVs) and Query Insights for end-to-end traceability, such as in
dist_statement_idin sys.dm_exec_requests, anddistributed_statement_idin query insights.exec_requests_history. Examples:The following sample T-SQL query uses an Operation Id inside a query on the
sys.dm_exec_requestsdynamic management view.SELECT * FROM sys.dm_exec_requests WHERE dist_statement_id = '00AA00AA-BB11-CC22-DD33-44EE44EE44EE';The following T-SQL query uses an Operation Id in a query on the
queryinsights.exec_requests_historyview.SELECT * FROM queryinsights.exec_requests_history WHERE distributed_statement_id = '00AA00AA-BB11-CC22-DD33-44EE44EE44EE`;
Billing example
Consider the following query:
SELECT * FROM Nyctaxi;
For demonstration purposes, assume the billing metric accumulates 100 CU seconds.
The cost of this query is CU seconds times the price per CU. Assume in this example that the price per CU is $0.18/hour. There are 3600 seconds in an hour. So, the cost of this query would be (100 x 0.18)/3600 = $0.005.
The numbers used in this example are for demonstration purposes only and not actual billing metrics.
Considerations
Consider the following usage reporting nuances:
- Cross database reporting: When a T-SQL query joins across multiple warehouses (or across a Warehouse and a SQL analytics endpoint), usage is reported against the originating resource.
- Queries on system catalog views and dynamic management views are billable queries.
- Duration(s) field reported in Fabric Capacity Metrics App is for informational purposes only. It reflects the statement execution duration. Duration might not include the complete end-to-end duration for rendering results back to the web application like the SQL Query Editor or client applications like SQL Server Management Studio and the MSSQL extension for Visual Studio Code.
Next step
Related content
- Monitor connections, sessions, and requests using DMVs
- Workload management
- Fabric Data Warehouse performance guidelines
- What is the Microsoft Fabric Capacity Metrics app?
- Smoothing and throttling in Fabric Data Warehousing
- Understand your Azure bill on a Fabric capacity
- Understand the metrics app compute page
- Pause and resume in Fabric data warehousing
- Monitor Fabric Data warehouse