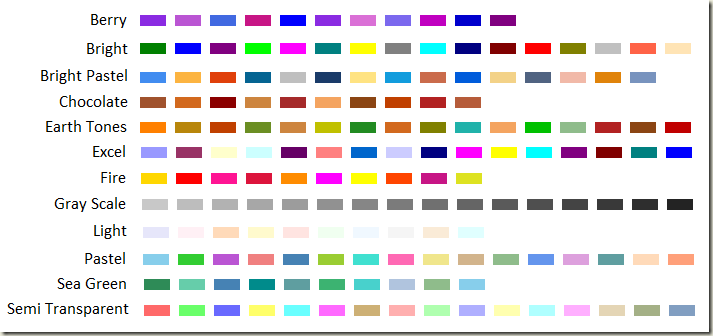
Setting Microsoft Chart Series Colors
Microsoft Chart control provides different ways to set color of the series and data points:
Palettes
Selecting one of the predefined palettes is the easiest way to change chart series colors. There are 12 built-in palettes with about 10 unique colors each.
Chart types like column and line, will assign a unique color from the palette to each of the series. If chart runs out of the palette colors then it will start reusing them again.
 // Set chart series palette
Chart.Palette = ChartColorPalette.Pastel;
Chart type like Pie, assigns unique colors to each individual data point. You can still use Chart.Palette property or you can define different palettes for different series using Series.Palette property. Note that setting Series.Palette property will force all chart types including Column to use unique colors for each data point.
Important! To determine the color assigned to the series or data point from the palette you can call chart1.ApplyPaletteColors() method and then check Series or DataPoint.Color property.
Custom Palettes
If none of the predefined palettes fits your needs, you can always create custom palette with as many colors as you need:
 // Set chart custom palette
Chart.Palette = ChartColorPalette.None;
Chart.PaletteCustomColors = new Color[] { Color.Red, Color.Blue, Color.Yellow};
Empty points
Not all series data points are equal… When you data bind your chart to the DBNull values the data points will be automatically marked as ‘empty’. You can also mark data points as empty by setting DataPoint.IsEmpty property. Each empty data point uses the visual attributes defined in Series.EmptyPointStyle property.
 // Hide all series empty data point by making them transparent
Chart.Series[0].EmptyPointStyle.Color = Color.Transparent;
Color Property
If all of the above methods does not work for you, then you can always set Color property for the series or individual data point.
 // Set color for the whole series
Chart.Series[0].Color = Color.Green;

// Set color of a single data point
Chart.Series[0].Points[5].Color = Color.Red;
You can always switch back to using the palette colors by setting both Series and DataPoint Color properties to Color.Empty.
Alex.
Comments
- Anonymous
November 13, 2009
Hi Alex,Is there any way to set the corner radius of the chart border? The BorderSkinStyle.Emboss radius is far too rounded to fit the style of our site and we would like to set it to 7px or something less than what is defaulted. Ideally, we would be able to have a 7px corner radius without any embossing. Here is an example of what we are looking for:The following chart was done with the Telerik chart. We would like to replace it with the MS chart, but need to replicate its corner style:http://www.buybusiness.com/Businesses/10001This question was also posted here:http://social.msdn.microsoft.com/Forums/en-US/MSWinWebChart/thread/24a4488b-1ccf-4346-9d59-16ccf5c371b0/Thank you. - Anonymous
July 08, 2010
The comment has been removed - Anonymous
August 23, 2010
Hi,how can i desible all elements of the chart control and set the Series transparentcan you please help on this? - Anonymous
August 30, 2010
The comment has been removed - Anonymous
June 28, 2011
The BorderSkinStyle.Emboss radius is far too rounded to fit the style of our site and we would like to set it to 7px or something less than what is defaulted.mamata<a href=“www.yahoo.com” rel=“dofollow”>Colors</a> - Anonymous
January 30, 2012
The comment has been removed - Anonymous
December 23, 2012
I am adding/removing series from a chart by using checkbox as trigger. But if a series is removed then the color for the existing series changes. Is there any way to fix the colors for a series by using existing palletes. Or is there any way to 'Get' the color that gets assigned to a series by existing pallete?Thanks. - Anonymous
January 07, 2013
Alex, I understand this is a really old post, but perhaps you could provide the answer: Do you have list of color codes (or named colors) for each predefined palette in MS Chart?Thanks! - Anonymous
February 28, 2013
thanks so much for the info. Searched for a while before I found .ApplyPaleteColors - Anonymous
May 20, 2014
Hello. Are there a way to get the default color when a pie chart is create? I only give the points value, and the pie chart came with default colors. But i can't get those color from the chart! See the example in the link: gyazo.com/3142acd51db4ed8860ff3386fdf6a42c
