How WebHCat Works and How to Debug (Part 2)
2. How to debug WebHCat
2.1. BadGateway (HTTP status code 502)
This is a very generic message from Gateway nodes. We will cover some common cases and possible mitigations. This is the most common Templeton problems customer are seeing right now.
2.1.1. WebHcat service down
This happens in-case WebHCat server on the active headnode is not available which can be quickly verified by below CURL command which returns 502.
$ curl -u admin:{HTTP PASSWD} https://{CLUSTER DNS NAME}.azurehdinsight.net/templeton/v1/status?user.name=admin
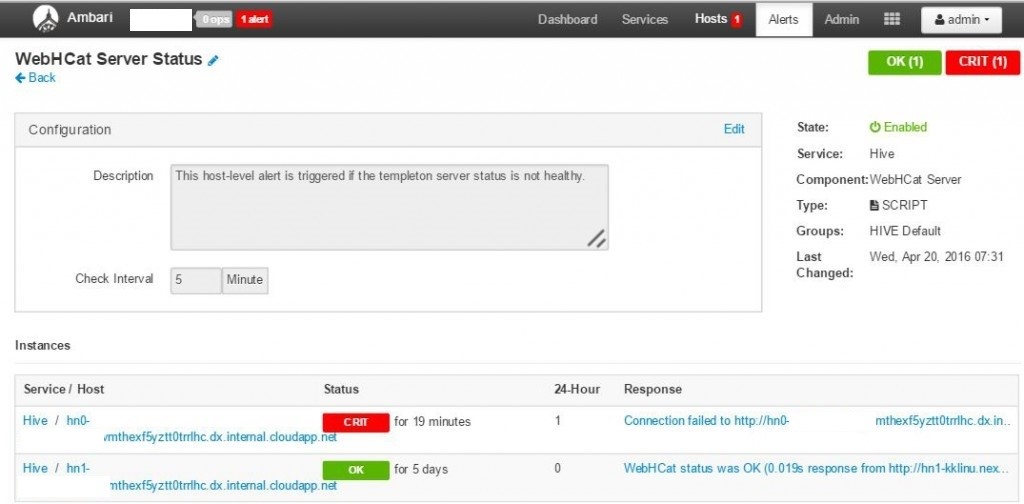
For service down scenarios Ambari shows an alert at the top and clicking will show the hosts on which the WebHCat is not available.
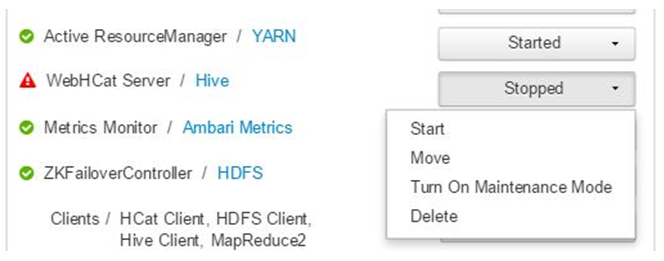
WebHCat down can be mitigated by restarting the service on host for which the alert was raised as shown in below screen shot
If WebHCat server is not coming up, then clicking through operations will show the failures (In this specific case server started successfully hence none shown). For more detailed information, refer to the stderr and stdout files referenced on the node.
2.1.2. WebHCat times out
HDInsight Gateway times out responses which take longer than 2Minutes resulting in “502 BadGateway”. WebHCat queries YARN services for job status and if they take longer than the request might timeout.
When this happens collect the following logs for further investigation:
/var/log/webchat. Typical contents of directory will be like
- webhcat.log is the log4j log to which server writes logs
- webhcat-console.log is stdout of server is started.
- webhcat-console-error.log is stderr of server process
NOTE: webhcat.log will roll-over daily hence files like webhcat.log.YYYY-MM-DD will also present. For logs to a specific time range make sure that appropriate file is selected.
Below are known common scenarios where timeout might happen.
2.1.2.1. WebHCat Level Timeout
When WebHCat is under load, meaning there are more than 10 open sockets at any given time, it will take longer time to establish new socket connections, which might result in time out. Quick way to validate is to check the connection status using below command on the current active headnode:
$ netstat | grep 30111
30111 is the port WEbHCat listens and above command lists network connections to and from WebHCat. The above command will show you the current open sockets on port 30111. The number of open sockets should be less than 10.
Sometimes when debugging using the above command, you will get no result. That doesn’t mean that nothing is listening on port 30111. Because above command, i.e. by default, netstat only print out open sockets. No result simply means for that given time, there is no open socket. To check if templeton is up and listening on port 30111, use:
$ netstat -l | grep 30111
2.1.2.2. YARN level timeout
In the end, Templeton is calling YARN to do real job, the communication between Templeton and YARN is another source that can cause timeout.
At YARN level, again there are two types of timeouts.
- Submitting a YARN job might take long enough to cause a timeout.
In following paragraphs, we will be looking at a real life example to explain how to debug this. I will cite logs from webhcat.log.2017-02-28, which a log file we just mentioned.
Inside the log if you search for “queued job” you will find something like following:
2017-02-28 03:31:05,559 DEBUG [qtp1236444285-198671]: templeton.LauncherDelegator (LauncherDelegator.java:enqueueController(88)) - queued job job_1487538382109_9529 in 4729 ms
As you can see, at 03:31:05 it takes 4729 ms for a templeton job to be pushed into joblauncher-queue.
But as we keep submitting jobs and our cluster got loaded up and gradually reached to the full capacity, it takes longer and longer for templeton to submit jobs into joblauncher queue:
2017-02-28 03:49:14,877 DEBUG [qtp1236444285-170128]: templeton.LauncherDelegator (LauncherDelegator.java:enqueueController(88)) - queued job job_1487538382109_9544 in 5910 ms
2017-02-28 03:52:09,585 DEBUG [qtp1236444285-198671]: templeton.LauncherDelegator (LauncherDelegator.java:enqueueController(88)) - queued job job_1487538382109_9546 in 6704 ms
2017-02-28 03:54:32,763 DEBUG [qtp1236444285-198682]: templeton.LauncherDelegator (LauncherDelegator.java:enqueueController(88)) - queued job job_1487538382109_9548 in 7118 ms
2017-02-28 03:58:16,115 DEBUG [qtp1236444285-198682]: templeton.LauncherDelegator (LauncherDelegator.java:enqueueController(88)) - queued job job_1487538382109_9552 in 28865 ms
…
…
…
Here is the reason why time keep increasing. Quick answer is the rate new jobs get submitted is much higher than the rate of old jobs completed. And because of that. once the Yarn Memory is 100% used (which is seen quite often for many customers), there is no way the joblauncher queue can borrow capacity from default queue, no more new jobs can be accepted (meaning get into joblauncher queue). This why the waiting time is getting longer and longer up until a time when the time rocketed up to 817569 ms (173X of 4729 ms):
2017-02-28 12:04:11,583 DEBUG [qtp1236444285-209275]: templeton.LauncherDelegator (LauncherDelegator.java:enqueueController(88)) - queued job job_1487538382109_10005 in 817569 ms
Right after this above message, in our log file, we can find the following time-out error and followed a whole bunch of other errors:
2017-02-28 12:09:55,997 ERROR [qtp1236444285-210125]: curator.ConnectionState (ConnectionState.java:checkTimeouts(201)) - Connection timed out for connection string (zk5-hdinsi.izt3ao5ycihezifl4oaxcv3cne.ax.internal.cloudapp.net:2181,zk2-hdinsi.izt3ao5ycihezifl4oaxcv3cne.ax.internal.cloudapp.net:2181,zk0-hdinsi.izt3ao5ycihezifl4oaxcv3cne.ax.internal.cloudapp.net:2181) and timeout (15000) / elapsed (22580)
org.apache.curator.CuratorConnectionLossException: KeeperErrorCode = ConnectionLoss
at org.apache.curator.ConnectionState.checkTimeouts(ConnectionState.java:198)
at org.apache.curator.ConnectionState.getZooKeeper(ConnectionState.java:88)
at org.apache.curator.CuratorZookeeperClient.getZooKeeper(CuratorZookeeperClient.java:115)
at org.apache.curator.framework.imps.CuratorFrameworkImpl.getZooKeeper(CuratorFrameworkImpl.java:474)
at org.apache.curator.framework.imps.GetDataBuilderImpl$4.call(GetDataBuilderImpl.java:302)
at org.apache.curator.framework.imps.GetDataBuilderImpl$4.call(GetDataBuilderImpl.java:291)
at org.apache.curator.RetryLoop.callWithRetry(RetryLoop.java:107)
at org.apache.curator.framework.imps.GetDataBuilderImpl.pathInForeground(GetDataBuilderImpl.java:287)
at org.apache.curator.framework.imps.GetDataBuilderImpl.forPath(GetDataBuilderImpl.java:279)
at org.apache.curator.framework.imps.GetDataBuilderImpl.forPath(GetDataBuilderImpl.java:41)
at org.apache.hive.hcatalog.templeton.tool.ZooKeeperStorage.getField(ZooKeeperStorage.java:240)
at org.apache.hive.hcatalog.templeton.tool.JobState.getField(JobState.java:307)
at org.apache.hive.hcatalog.templeton.tool.JobState.getCompleteStatus(JobState.java:250)
at org.apache.hive.hcatalog.templeton.CompleteDelegator.run(CompleteDelegator.java:70)
at org.apache.hive.hcatalog.templeton.Server.completeJob(Server.java:1074)
at sun.reflect.GeneratedMethodAccessor85.invoke(Unknown Source)
at sun.reflect.DelegatingMethodAccessorImpl.invoke(DelegatingMethodAccessorImpl.java:43)
at java.lang.reflect.Method.invoke(Method.java:498)
(A very long error stack, trunked here.)
(A whole bunch of other error messages here)
Templeton service crashed, no job submission activity since then until 19:17:09:
2017-02-28 19:17:09,716 INFO [main]: templeton.Main (Main.java:run(121)) - Templeton listening on port 30111
The above log message “Templeton listening on port 30111” means Templeton got freshly started.
And after this again we can see jobs got submitted again with a normal 4000-8000ms waiting time:
2017-02-28 19:18:04,408 DEBUG [qtp1236444285-28]: templeton.LauncherDelegator (LauncherDelegator.java:enqueueController(88)) - queued job job_1487538382109_10017 in 4482 ms
Just to give you one more data point, look at the following screen shot:
The joblauncher queue is 714% over used. This is fine as long as we still have free capacity in our default queue, meaning new jobs can still be injected by borrowing capacity from default queue. But Yarn mem 100% meaning cluster fully used, new jobs have to wait, which eventually caused time out in this case.
Two ways to resolve this issue: one is to reduce the speed of new jobs submitted, the second one is to increase the consumption speed of old jobs in joblauncher queue, which is basically increasing the processing power of your cluster by scaling up.
- YARN processing might take long, which makes another source for timeout.
- List all jobs: This is a very expensive call. This call enumerates the applications from YARN ResourceManager and for-each completed application gets status from JobHistoryServer. In-cases of higher number of jobs this call might timeout resulting in 502.
- List jobs older than 7 days: HDInsight YARN JobHistoryServer is configured (mapreduce.jobhistory.max-age-ms) to retain completed jobs information for 7 days. Trying to enumerating purged jobs results in timeout resulting in 502.
Quick look process will be like
- Figure out the UTC time range to troubleshoot
- Select the webchat.log file based on the time range
- Look for WARN/ERROR messages during that period of time
2.2. Other Failures
- HTTP Status code 500
In most cases where WebHCat returns 500 the error message contains details on the failure. Otherwise looking through the WebHCat log for ERROR/WARN will reveal the issue.
- Job failures
In-cases where interaction with WebHCat are successful but the jobs are failing.
Templeton collect the job console output as stderr in ‘statusdir’ which will be useful lots of times for troubleshooting. Stderr contains YARN application id of the actual query which can be used for troubleshooting.
NOTE: For HIVE workload using statement ‘set hive.root.logger=DEBUG,console’ at the start collect more verbose logs into stderr
Comments
- Anonymous
March 08, 2017
Hey great post. I hope it's alright that I shared it on my Facebook, if not, no worries just let me know and I'll delete it.Regardless keep up the good work.- Anonymous
March 20, 2017
You are more than welcome to share this post as long as you make sure you mention the source. Thanks!
- Anonymous


