Saving Spark Resilient Distributed Dataset (RDD) To PowerBI
- The sample Jupyter Scala notebook described in this blog can be downloaded from https://github.com/hdinsight/spark-jupyter-notebooks/blob/master/Scala/SparkRDDToPowerBI.ipynb.
- Spark PowerBI connector source code is available at https://github.com/hdinsight/spark-powerbi-connector.
This blog is a follow-up of our previous blog published at https://blogs.msdn.microsoft.com/azuredatalake/2016/03/09/saving-spark-dataframe-to-powerbi/ to show how to save Spark DataFrame to PorwerBI using the Spark PowerBI connector. In this blog we describe another way of using the connector for pushing Spark RDD to PowerBI as part of a Spark interactive or batch job through an example Jupyter notebook in Scala which can be run on an HDInsight cluster. The usage of the Spark PowerBI connector with Spark RDD is exactly similar to that with Spark DataFrame, however, the difference is in the actual implementation of the method that aligns the RDD with the PowerBI table schema. Though this example shows pushing an entire RDD directly to PowerBI, it is expected that users should use discretion on the amount of data being pushed through the RDD. Be aware of the limitations of PowerBI REST APIs as detailed in https://msdn.microsoft.com/en-us/library/dn950053.aspx. An ideal use case will be displaying some metrics or aggregates of a job at certain intervals or stages as PowerBI Dashboard.
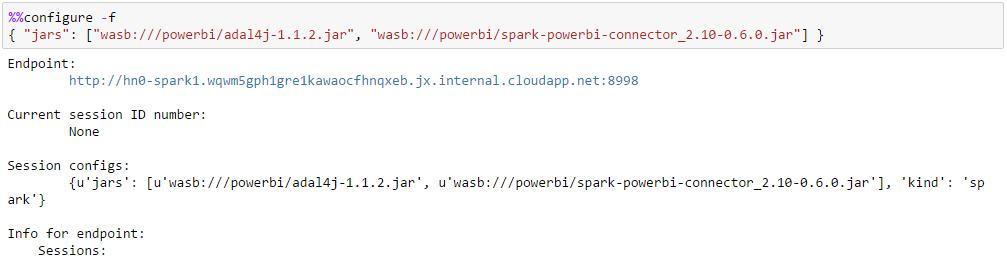
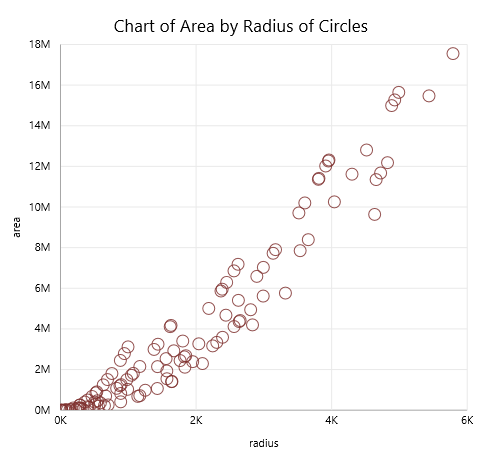
In this example we will visualize an RDD on PowerBI that displays the relation between the radii and areas of circles. To start with this example we need to configure Jupyter to use two additional JARs and place them in a known folder in the default container of the default storage account of the HDInsight cluster:
- adal4j.jar available at https://mvnrepository.com/artifact/com.microsoft.azure/adal4j
- spark- powerbi-connector_2.10-0.6.0.jar (compiled with Spark 1.6.1) available at https://github.com/hdinsight/spark-powerbi-connector. Follow the README for Maven and SBT co-ordinates.
If required, source codes from Github repositories can be cloned, built and packaged into appropriate JAR artifacts through IntelliJ. Refer to the appropriate section of the Azure article at https://azure.microsoft.com/en-us/documentation/articles/hdinsight-apache-spark-eventhub-streaming/ for detailed instructions.
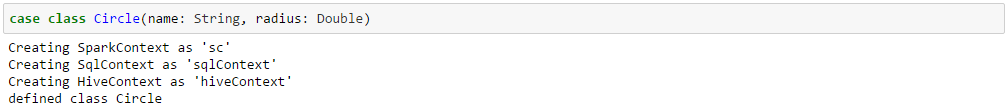
Define a case class Circle that will hold the data which will be used to create the RDD for this example. In practice the RDD data source can be anything that is supported by Spark.
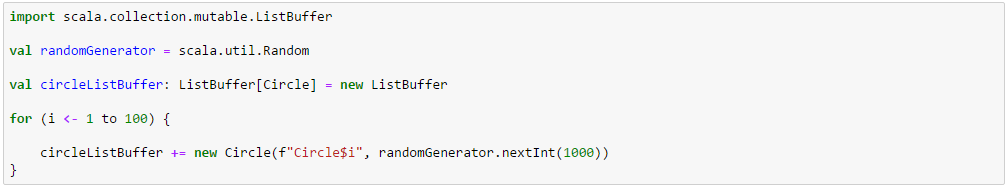
Generate a list of Circle objects and create an RDD, circleRDD, out of it.

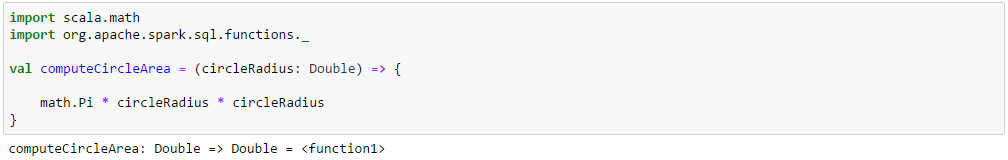
Define a method with radius as the input parameter to compute the area of a circle.
Define a case class CircleAreaByRadius to hold the radii and areas of circles.

Create a new RDD, circleAreaByRadiusRDD, by mapping the circleRDD with the CircleAreaByRadius method. This is the RDD which we want to show on the PowerBI dashboard.

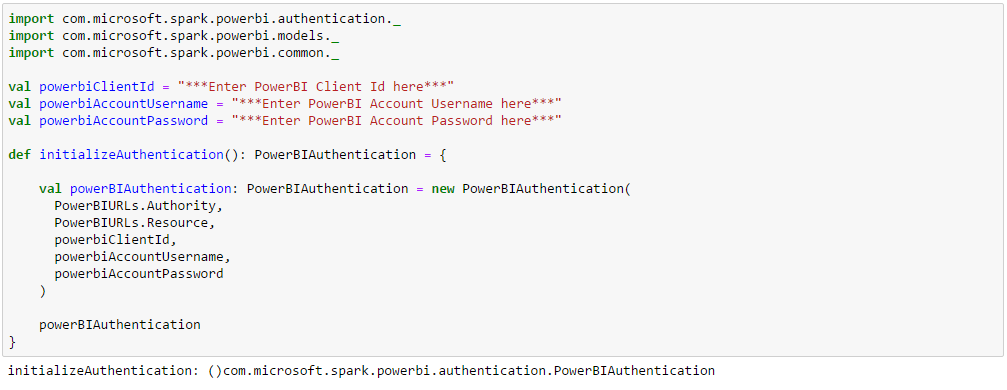
Enter the PowerBI Client ID, PowerBI Account Username and PowerBI Account Password and declare the PowerBIAuthentication object. PowerBIAuthentication class is defined in the spark-powerbi-connector.jar under com.microsoft.spark.powerbi.authetication.
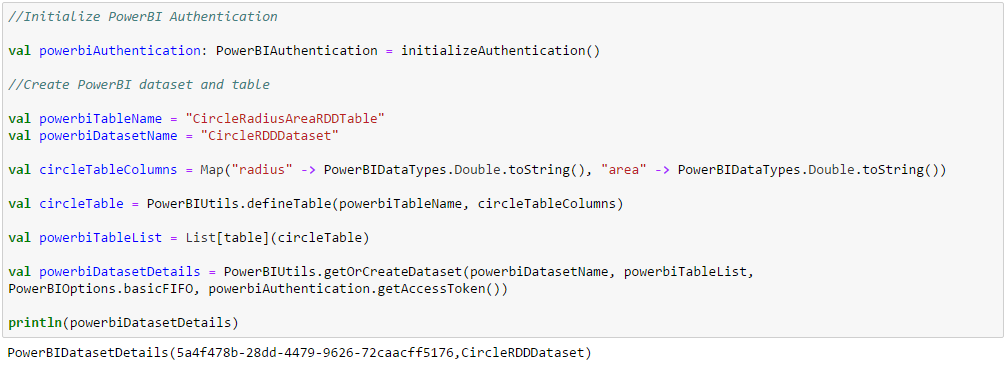
Initialize the PowerBIAuthentication object, declare PowerBI table with column names and datatypes and create (or get) the PowerBI dataset containing the table. This step runs in the driver and actually goes to PowerBI and creates (or gets) the dataset and the underlying table(s). PowerBI table column names should match field names of the case class underlying the RDD which it is storing.
Simply call the toPowerBI method on the RDD with PowerBI dataset details received when creating (or getting) the dataset in the previous step, the PowerBI table name and the PowerBI authentication object.

Verify that the data is actually saved and can be displayed on the PowerBI dashboard.
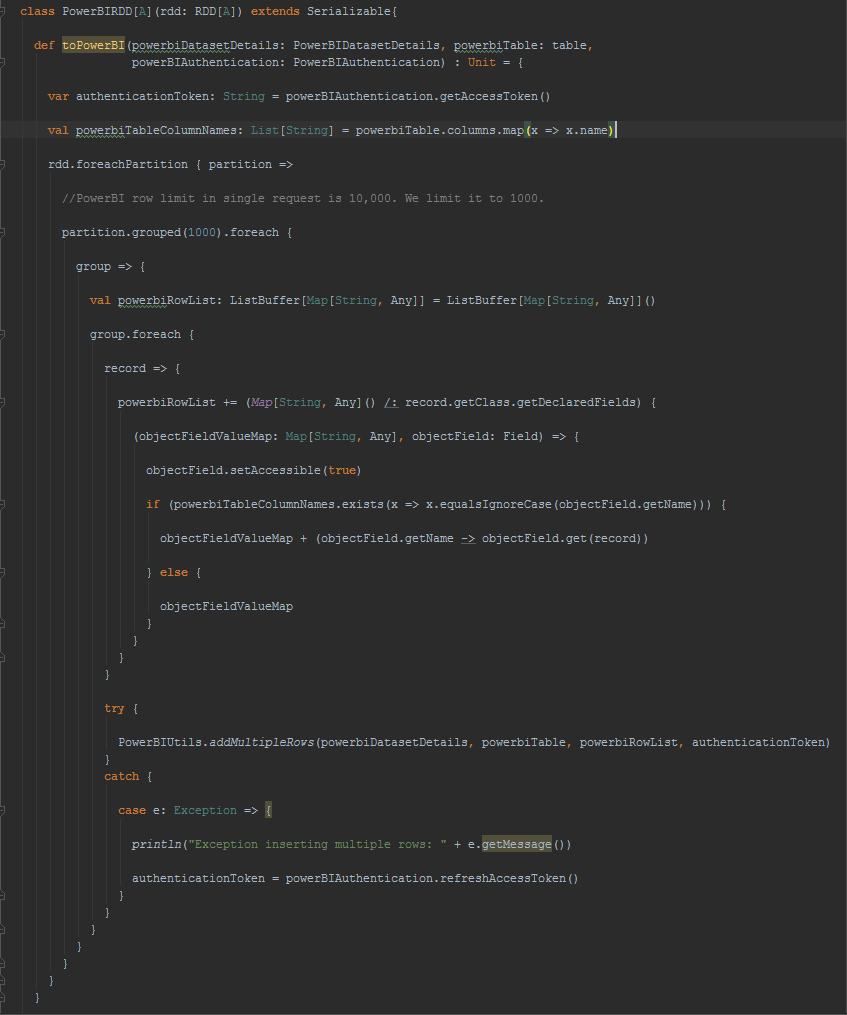
For further reading into how RDD has been extended to support saving it to PowerBI, following is the code behind. Each partition of the RDD is grouped into 1000 records and serialized into multiple rows POST request to PowerBI table in JSON format. The field names are extracted from the RDD records and PowerBI table rows are populated with the columns whose names match the field names.
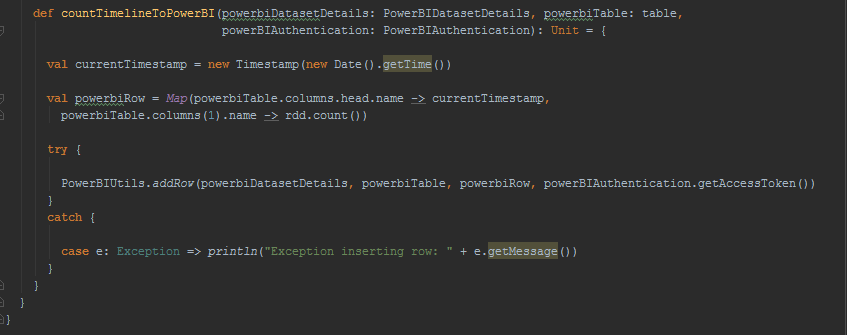
The other method available to the RDD extension is for displaying the timeline of the count of records in the RDD which comes useful for showing metrics for long running Spark jobs like Spark Streaming.
[Contributed by Arijit Tarafdar]