Distributed Tracing in Service Fabric using Application Insights
Logs are critical to any system for monitoring and diagnostics. In the world of microservices, the challenge is not only to collect logs from all the distributed services but also to enable tracing of a request and all its internal dependencies to troubleshoot which service dependency flow had the issue.
Service Fabric uses Event Tracing for Windows (ETW) to emit events on what's happening with the system. This enables microservices to not worry about routing or storing the logs, they just emit the events and whoever is listening needs to manage them. This also enables decoupling of the logging system and aligns well with 12factor.net/logs. Here is a great article on how you can listen to these events and send Service Fabric traces to ElasticSearch.
In this article I will show how we can send these traces to Application Insights and also enable tracing of every single request with all its dependencies using a unique CorrelationId. (Note: You can download the sample code for this article from here)
Here is what the solution structure looks like at a high level:
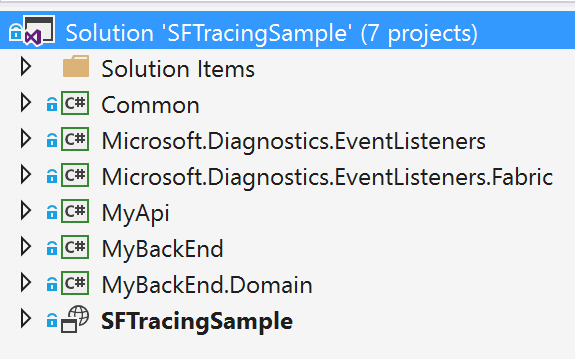
Now lets understand how everything came together.
Create Application Insights Listener
For this we can reuse the "Microsoft.Diagnostics.EventListeners" and "Microsoft.Diagnostics.EventListeners.Fabric" projects from this repo which already has a bunch of listeners built-in, including one for Application Insights. In future, this may be available as nuget packages for easy integration.
Integrate the Application Insights Listener with Service Fabric Services
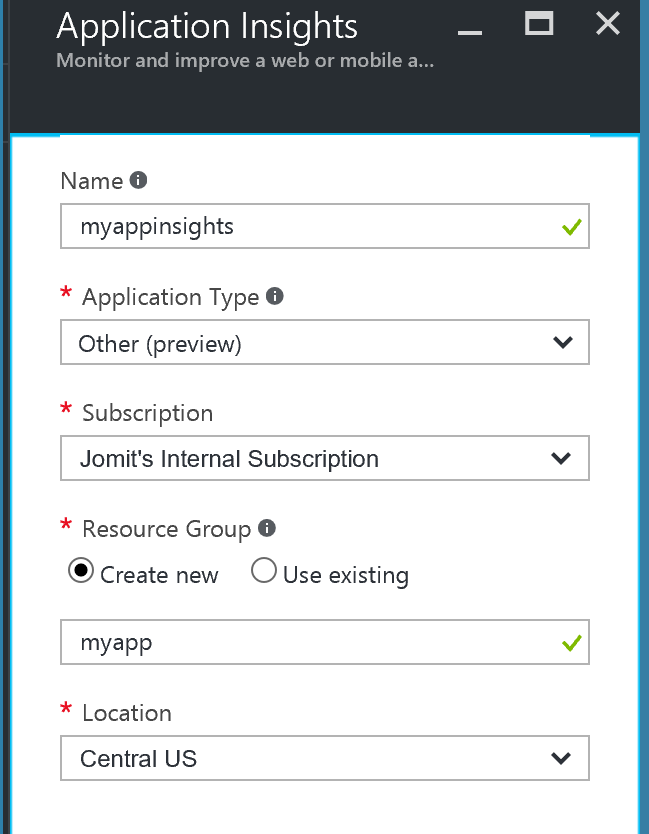
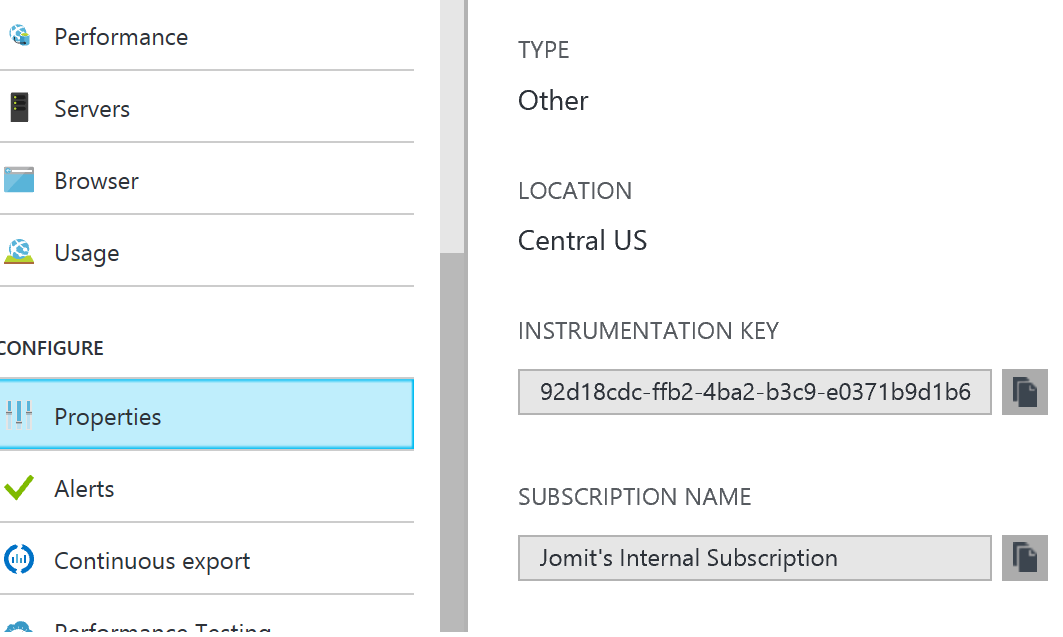
The first step of integration is to create Application Insights in Azure and get the InstrumentationKey.
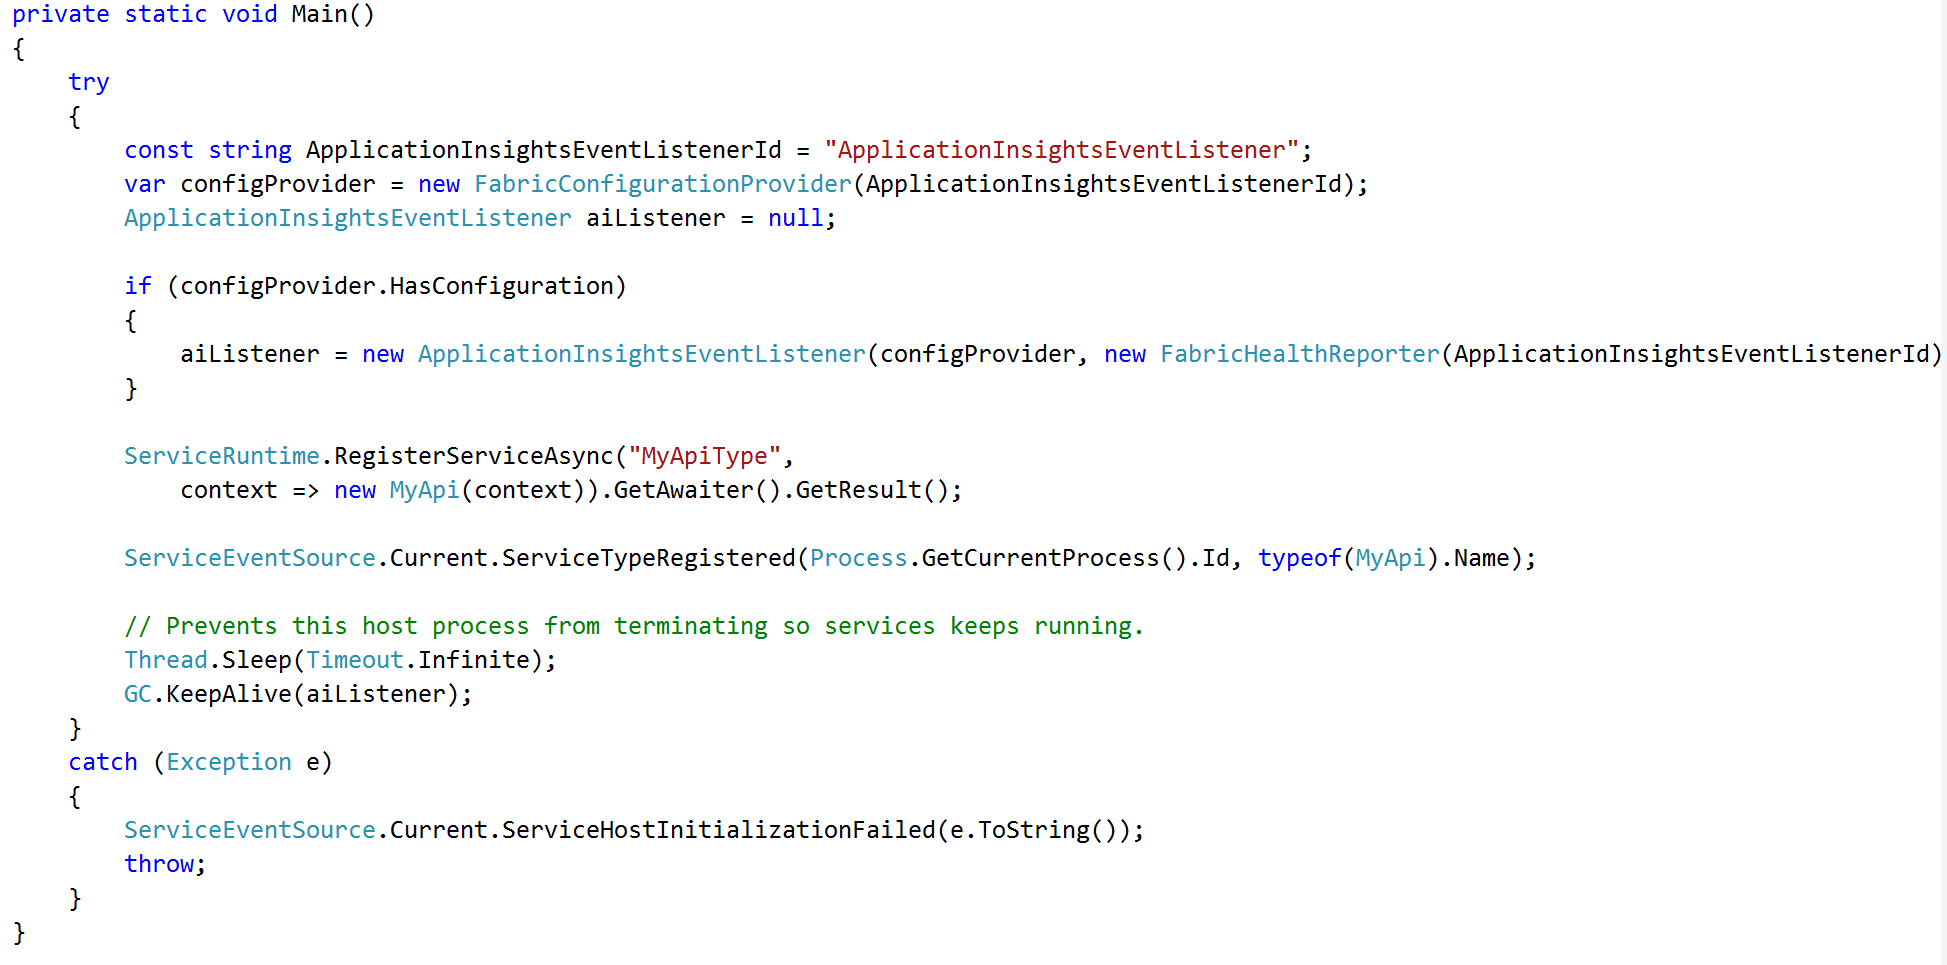
Next, integrate the listener into each of our services
Add the configuration section to provide the InstrumentationKey to the listener.
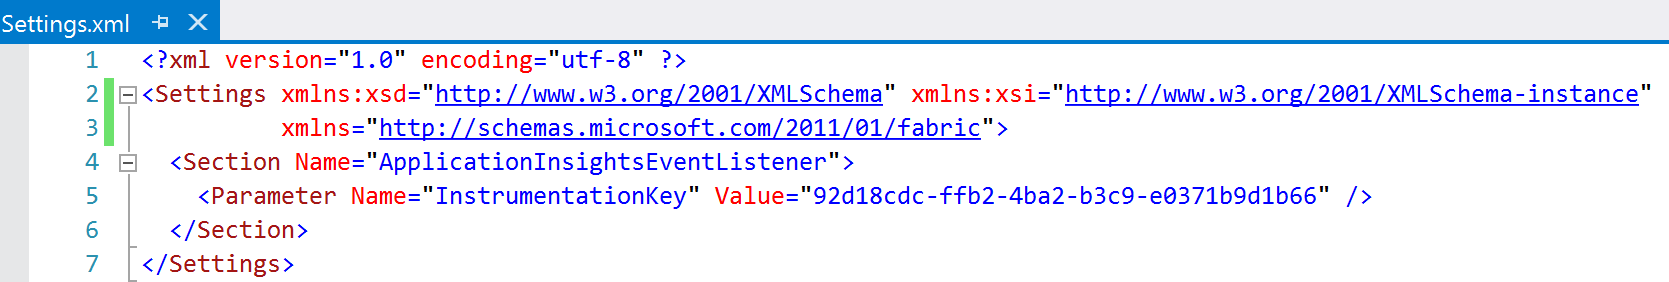
Add this for both MyApi and MyBackend Services and make sure to follow the steps shown here to add the "Microsoft.Diagnostics.Tracing" nuget package and update the using reference in the "ServiceEventSource" class for each service.
Generate and Track CorrelationId across multiple service calls
To generate a unique Id for every request create an OWIN Middleware
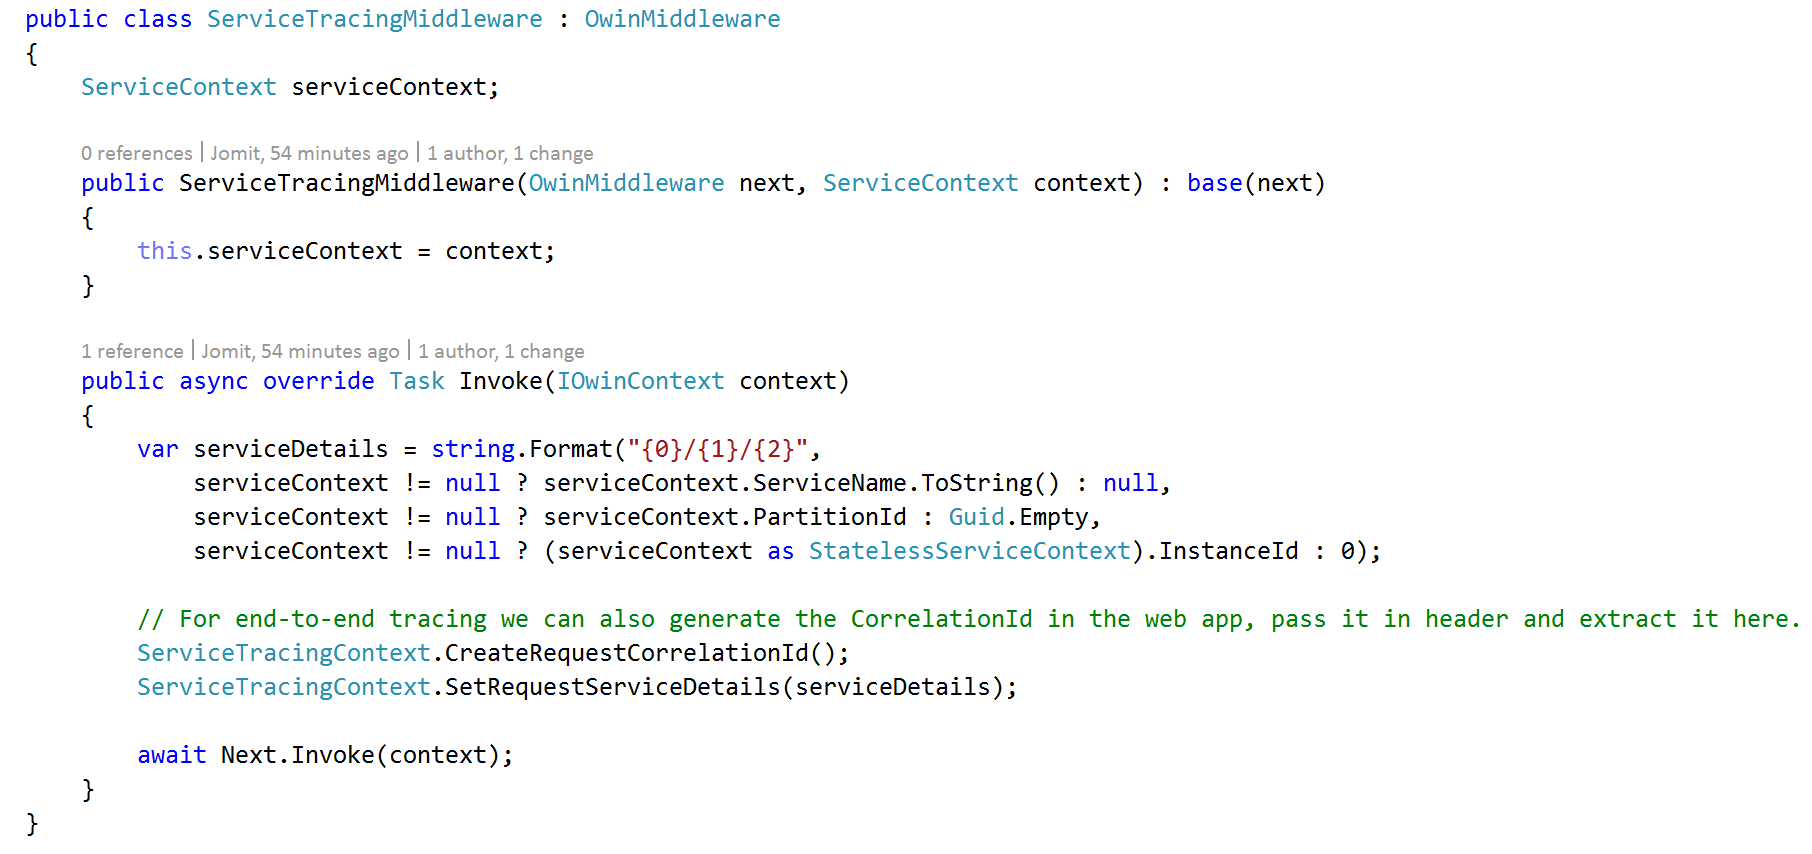
and to track the start and stop of each api call, update the code in the "ServiceRequestActionFilter" to log the extra parameters.
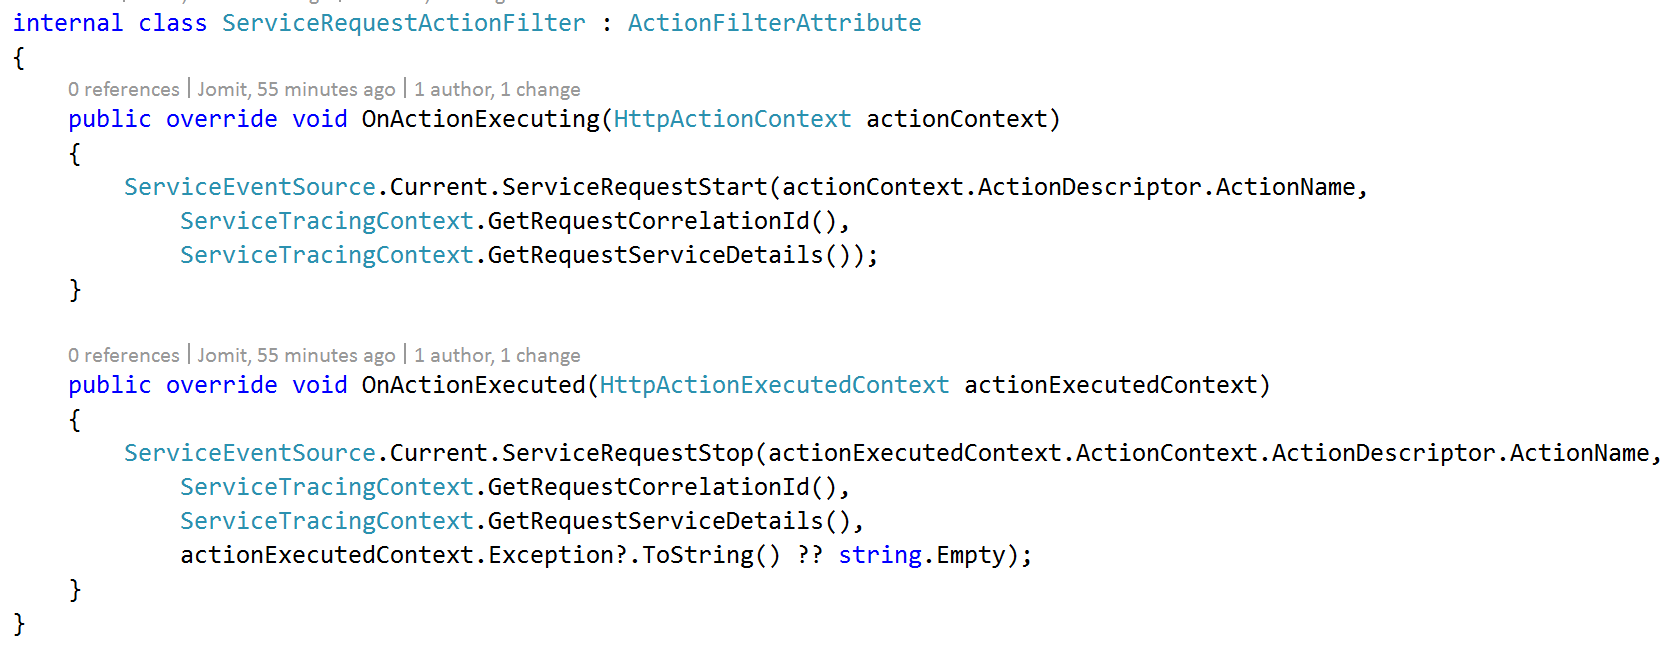
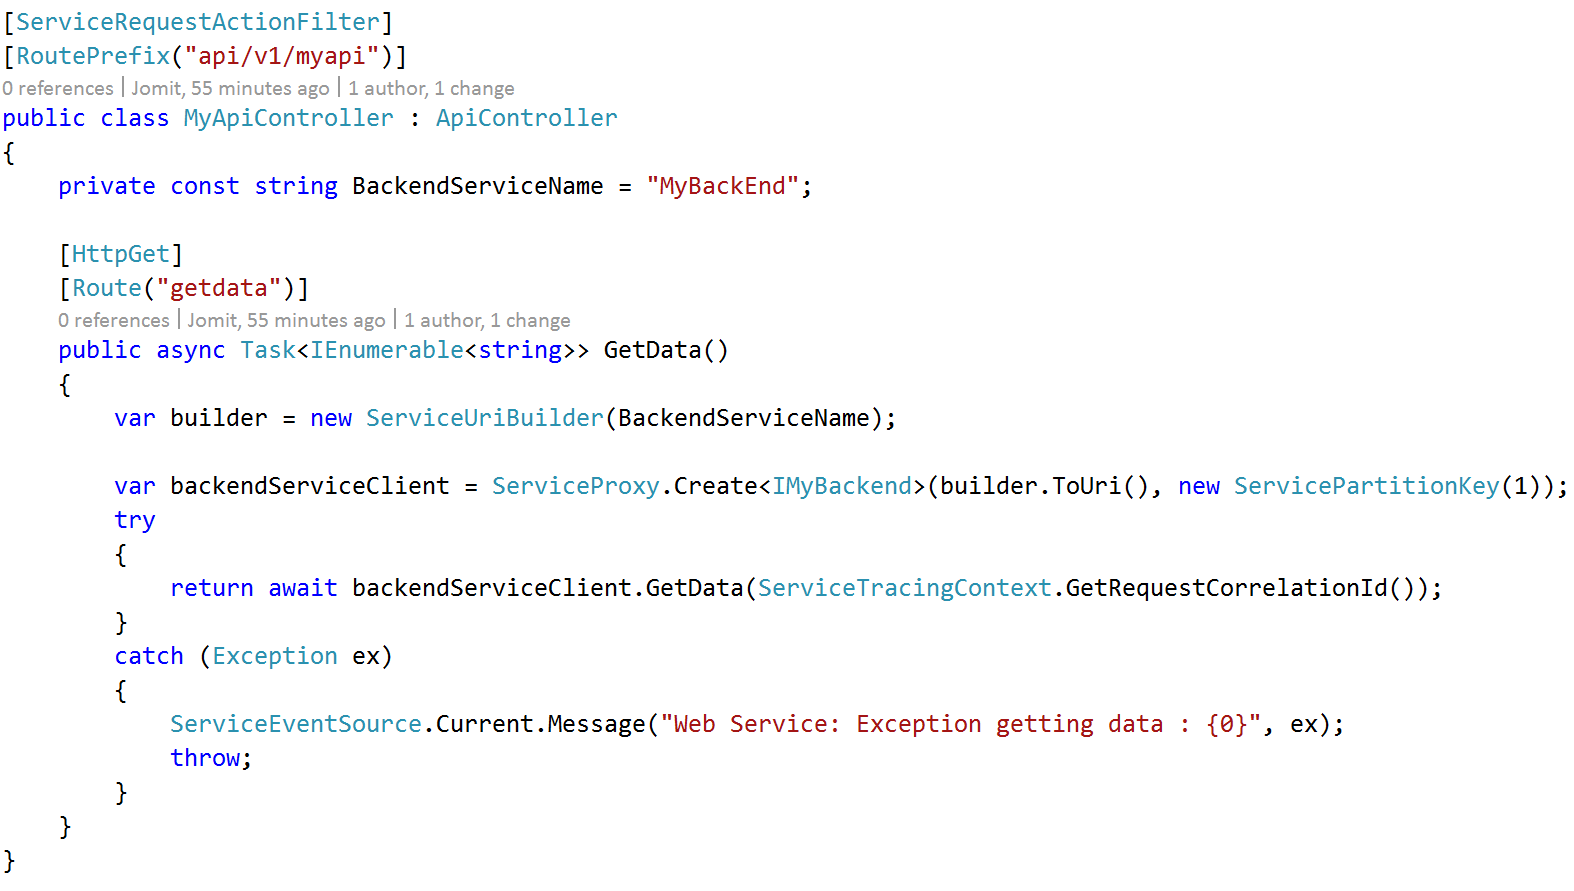
Once we integrate this, we should get the CorrelationId from the CallContext and pass it long to dependent services
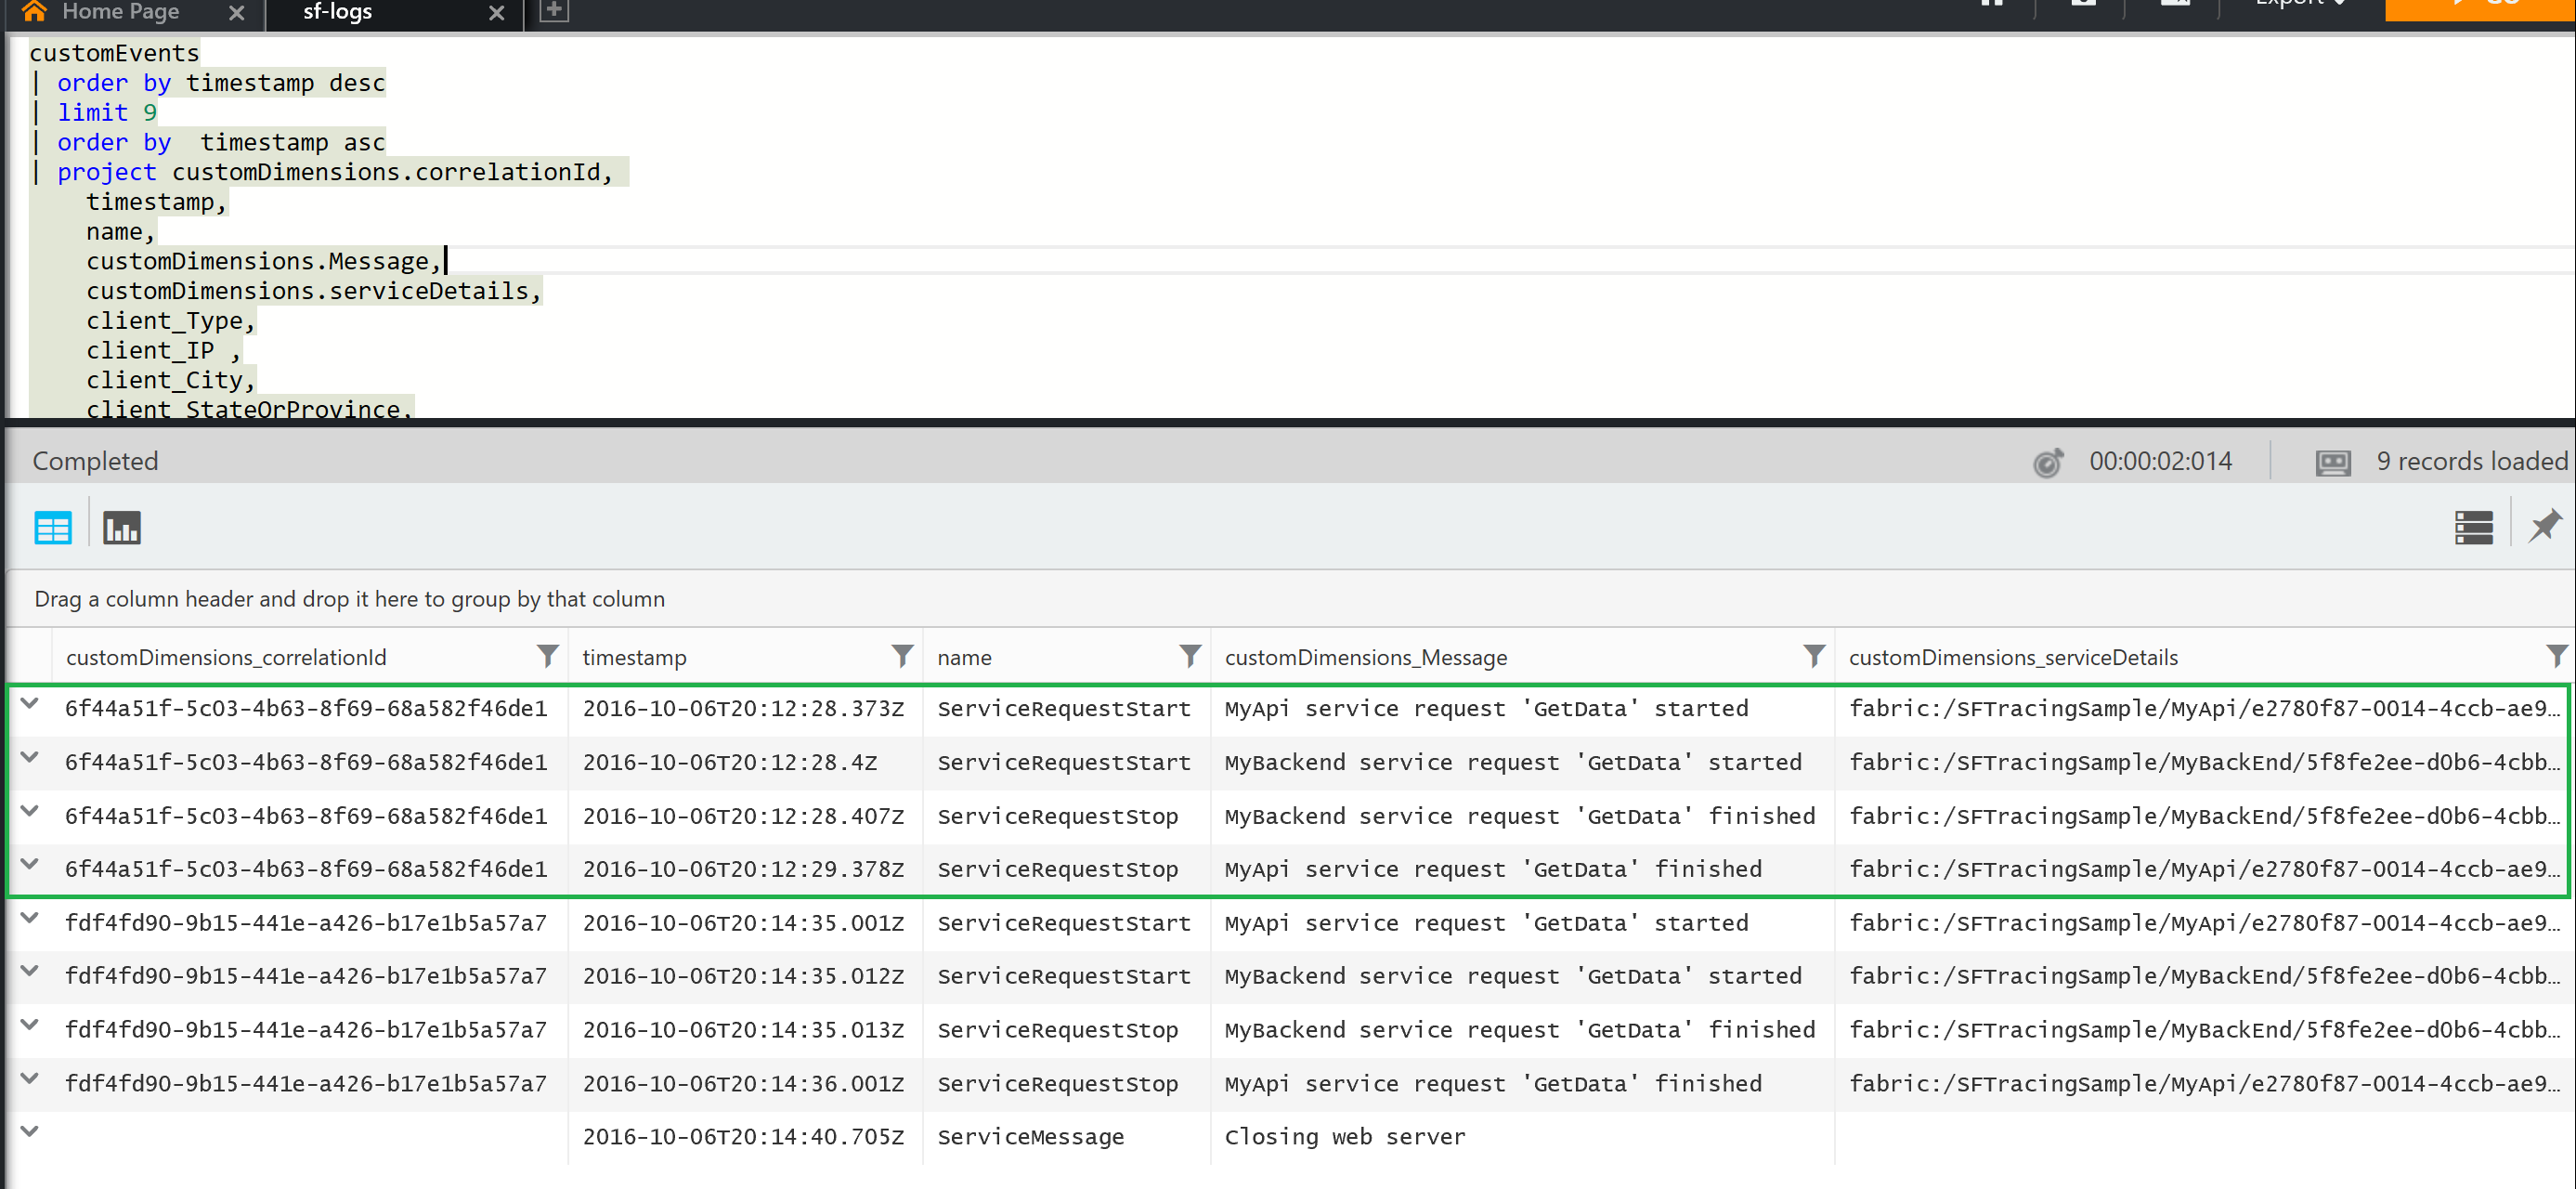
View Trace logs
Finally, we can view our logs using the Analytics query.
Comments
- Anonymous
December 03, 2016
What project do I put the MyApiController in?- Anonymous
December 19, 2016
In the Stateless Web API Service. You can see the complete source code for this on GitHub here.
- Anonymous
- Anonymous
December 12, 2016
Providing using statements would be helpful and not capturing code as an image, but instead as text, would be helpful to those of us that would like to more quickly copy your wonderful example with less effort :-D- Anonymous
December 19, 2016
The source code of this article is on GitHub here. I did mentioned that in the beginning but may be I need to make it more obvious next time:). Thanks for pointing out.
- Anonymous
- Anonymous
March 07, 2017
Will everything go as application insight trace or we can log as AI errors as well?