"Cartographic Adjustment" of Spatial Data for SQL Server Reporting Services, Part 5
The Report Builder, a component of Reporting Services, described in this post will be available as a separate download when the upcoming CTP2 release of SQL Server 2008 Release 2 (R2) is made available to the public, currently scheduled for August 2009.
This was to be the last post in this series but it's too interesting to stop here. As of this writing, I'm planning one additional post in this series which will expand on the new mapping capabilities of SQL Server Reporting Services. Please note that these new capabilities will be introduced in CTP2 of the upcoming SQL Server 2008, R2 release. Today's post will introduce the new SQL Server Report Builder and its new mapping capabilities. Here is the workflow presented so far:
- Locate data source and download (Part 1)
- Load the data into SQL Server (Part 1)
- Remove unwanted features, simplify Alaska and Hawaii spatial features (Part 2)
- "Reposition" Alaska and Hawaii cartographically (Part 3)
- Locate and load State-based population data (Part 4)
- Use the data in the new SQL Server Report Builder
- More SQL Server Report Builder
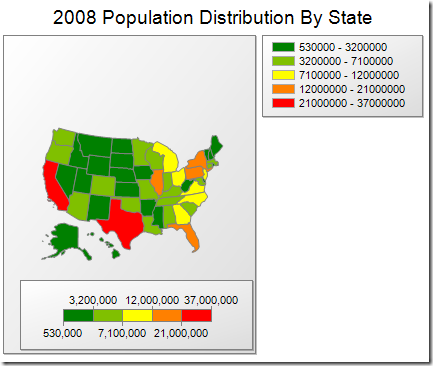
So that you don't have to immediately scroll to the end of this post to see the final result, here is a reduced scale version of the final map report, noting, of course, the repositioned Alaska and Hawaii features ;-):
For those of you interested in the Report Builder workflow to create this map, please keep reading.
When the new Report Builder is first opened, a design canvas is presented, allowing you to select on of three report wizards: Table, Chart or Map. Since we have just finished adjusting a set of spatial data, the Map wizard looks like the ticket:

When Map is selected, you will be presented with a wizard which will take your through the creation of your first map report.
The first wizard menu presents you with a selection of spatial data sources. For this post we are going to use SQL Server spatial data:
The next step is to create a new data source connection:
Selecting "New..." brings up the next screen:
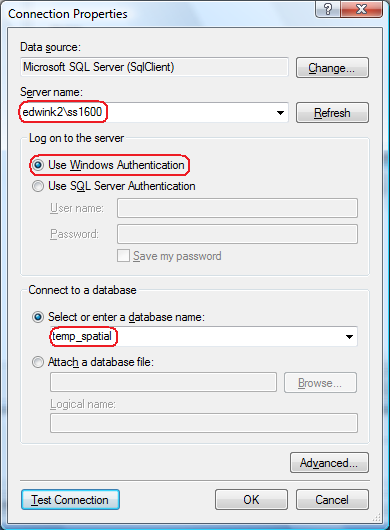
We have the option to create a new data source name but for this exercise, we won't change the default name. Selecting the "Build..." button displays the Connection Properties menu:
Here we will define our database server instance, authenticate the connection and connect to a database:
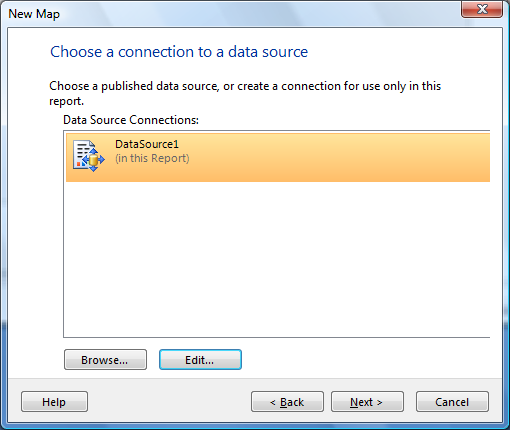
Hitting "OK" brings up the next panel. Since this looks good, we'll hit "OK":
This looks good, so we'll hit "Next >":
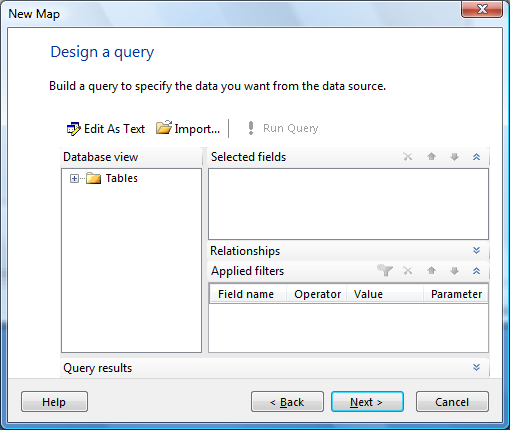
The query designer is now presented. We'll select "Edit As Text":
Here is the basic query we intend to use:
SELECT STATEFP, GEOM FROM US_STATES_INSET
This initial query selected columns STATEFP and GEOM with the goal of using the State FIPS Codes in the STATEFP column as the join column with the US_STATES_POPULATION table. The join column in the US_STATES_POPULATION table is the STATES column, also containing FIPS Codes for the States. A quick review of the two join columns revealed a basic incompatibility despite the fact that they were both defined as character columns:
| STATEFP | STATES | NAME |
| 01 | 1 | Alabama |
| 02 | 2 | Alaska |
| 04 | 4 | Arizona |
| 05 | 5 | Arkansas |
| 06 | 6 | California |
| 08 | 8 | Colorado |
| 09 | 9 | Connecticut |
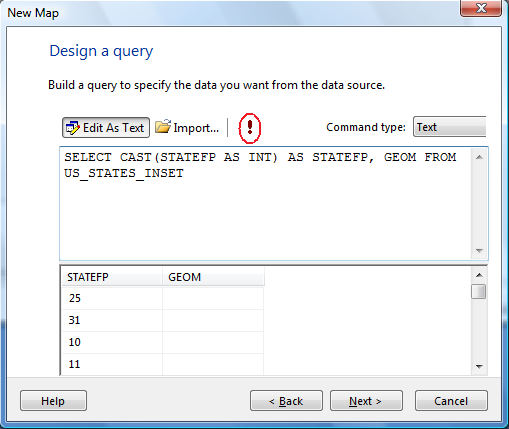
to make the two join columns compatible, we can cast the character columns to integer. Here is the rewrite for the current query:
SELECT CAST(STATEFP AS INT) AS STATEFP, GEOM FROM US_STATES_INSET
We will use this query in the query designer. Hitting "!" button will execute this query, with the results displayed in the bottom window, below:
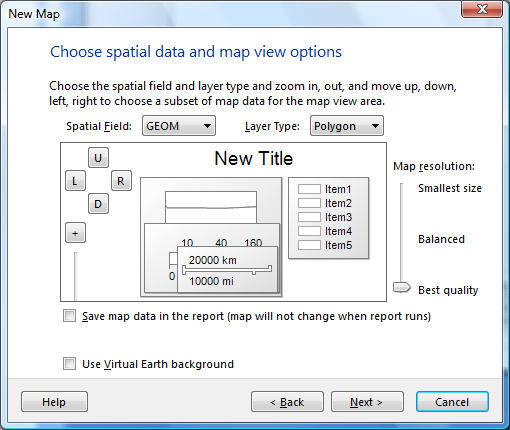
Selecting the "Next >" button brings up the following menu:
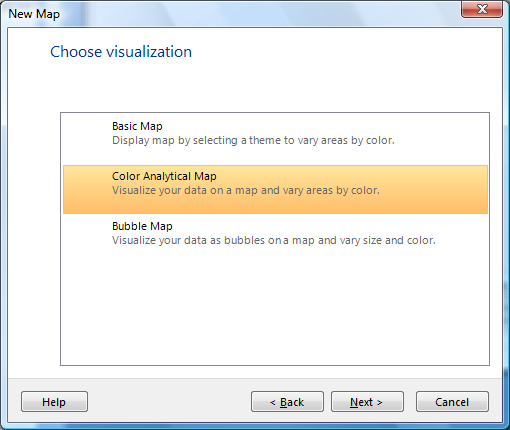
This all looks good, so we will select "Next >" here also and bring up the visualization menu, where we will choose "Color Analytical Map":
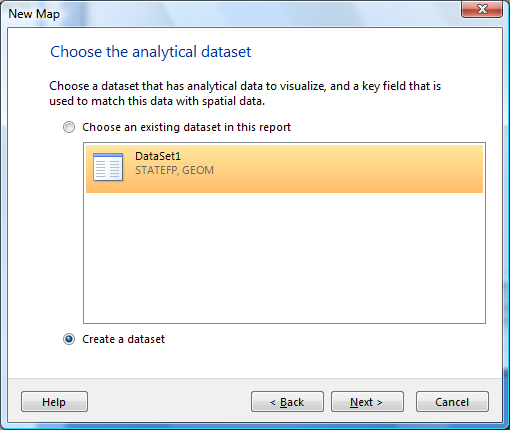
Choosing "Next >" brings up the "Choose the analytical dataset" menu. Our analytical data will come from the US_STATES_POPULATION table, se we nee to select the "Create a dataset" radio button:
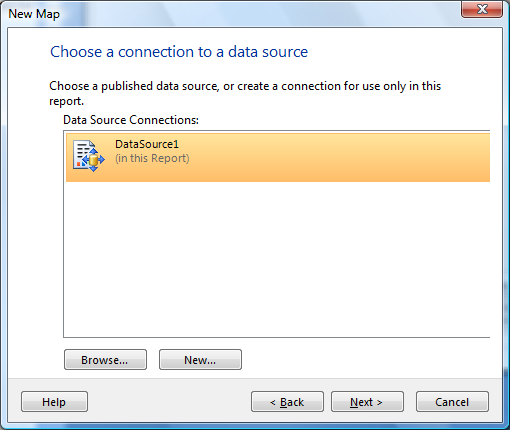
Choosing "Next >" brings up the menu panel which allows us to choose a connection to the new dataset. Since the US_STATES_POPULATION table is in the same database as the spatial table (US_STATES_INSET), we can use the existing connection, DataSource1:
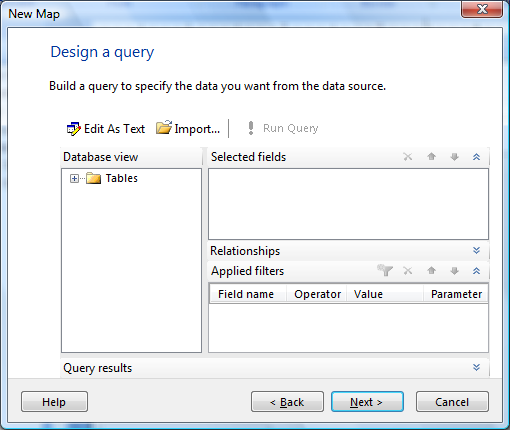
Choosing "Next >" bring us to the query designer screen for the analytical data:
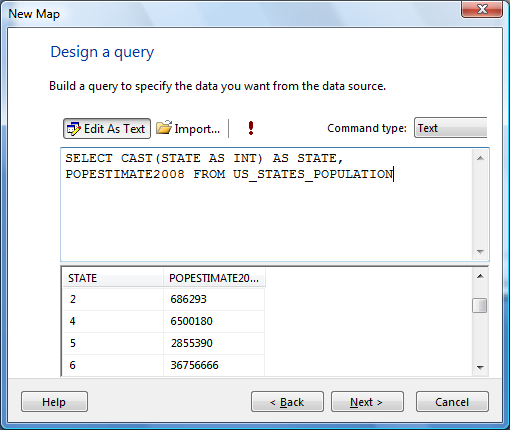
As with the query designer for the spatial data, we well choose "Edit As Text" and use the following query:
SELECT CAST(STATE AS INT) AS STATE, POPESTIMATE2008 FROM US_STATES_POPULATION
Our intent is to join the two tables and display the 2008 population estimates (POPESTIMATE2008 column) for each state on the resulting map. As will recall, we are casting the State FIPS Code to integer to guarantee join compatibility on the join columns.
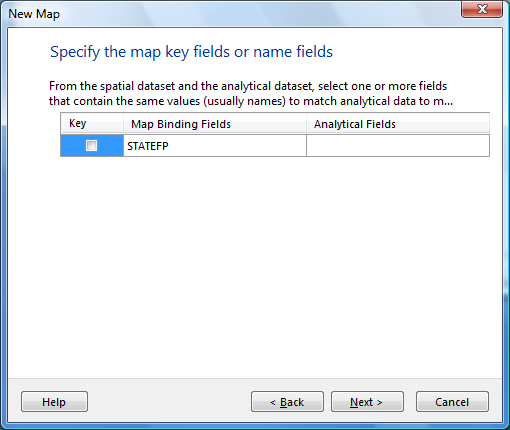
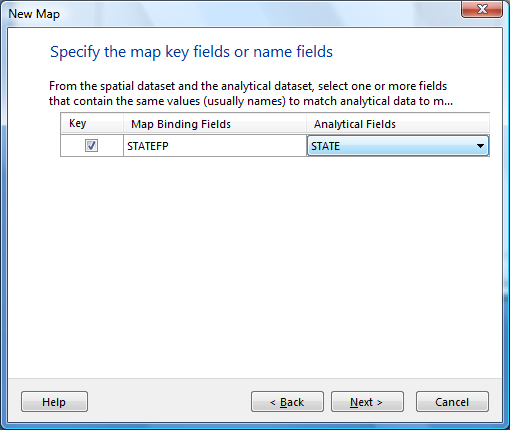
After selecting "Next >", we are offered the opportunity to specify the join columns:
Checking the "Key" box allows us to specify the analytical fields in the US_STATES_POPULATION table query we just specified - in this case Map Binding Field: STATEFP, Analytical Field: STATE:
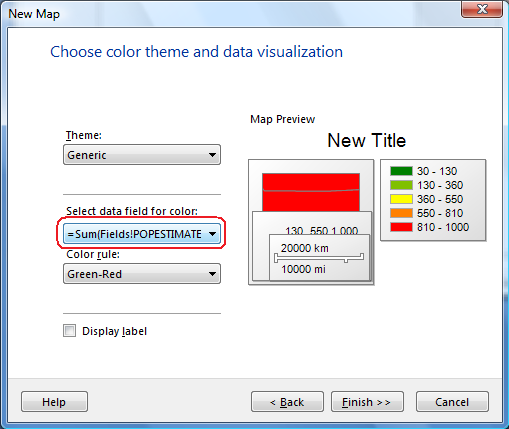
Select "Next >" to bring up the color theme and data visualization menu. Here we select the data field (analytical field) which will be symbolized by different polygon fill colors based on, in this case, population:
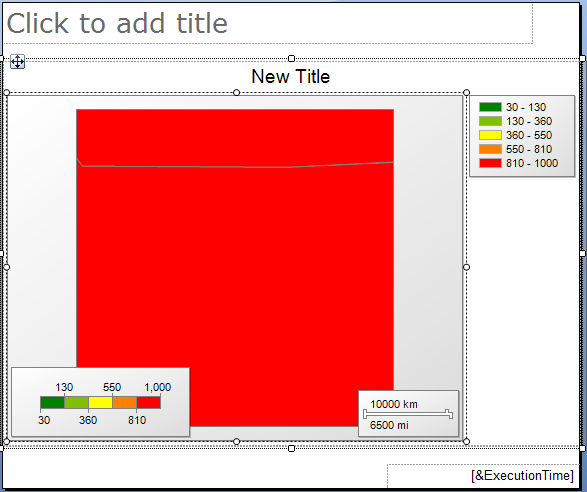
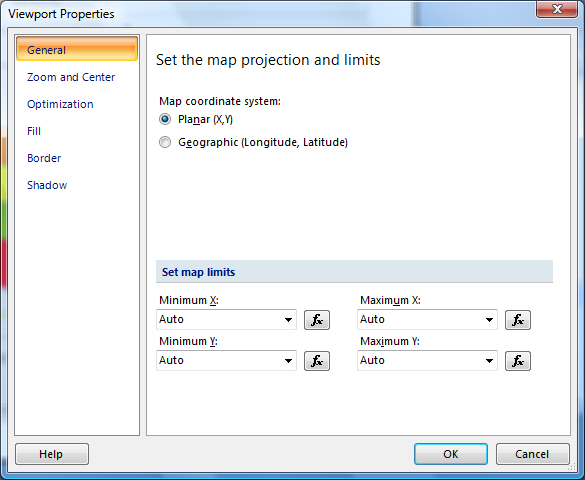
Selecting "Finish >>" brings up the design canvas. In the version of the Report Builder that is being used for this post, there is a bug which prevents the map display from rendering the underlying spatial data correctly. In order to remedy this, we need to set the coordinate system for the map display (It currently defaults to the geography data type. Since the GEOM column in the US_STATES_INSET table is of type geometry, the design-time display is not correct):
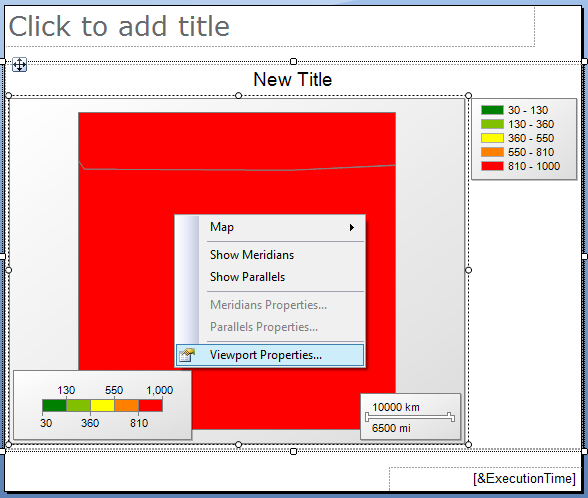
To set the correct coordinate system, left-mouse-click on the design canvas to select and then right-click with the mouse to bring up the contextual menu. What we are looking for are the "Viewport Properties..."
Select the "Viewport Properties..." allows us to set the Map coordinate system to Planar (X,Y). In future versions of the Report Builder, the coordinate system will be automatically detected.
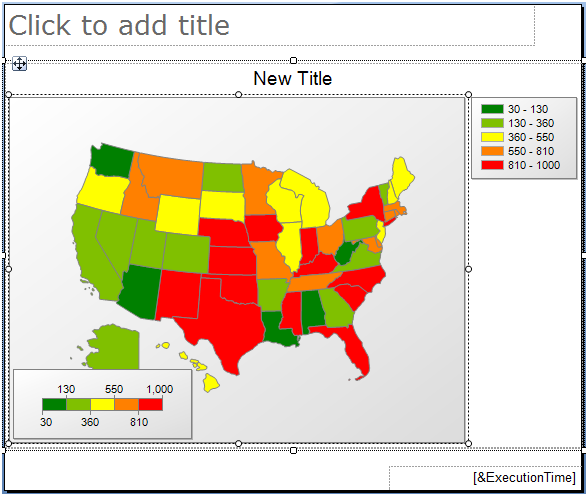
Selecting "OK" completes the task and the design canvas correctly illustrates the United States inset map. Note that the map is not yet rendered and the design canvas map display is simply a placeholder.
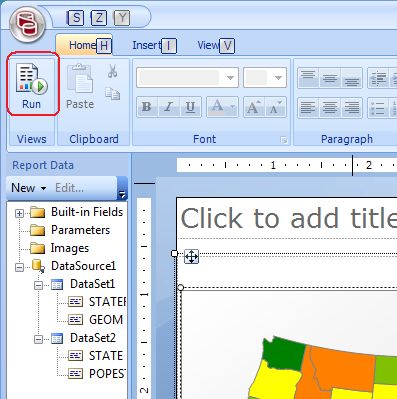
In the design canvas, we can adjust the map a bit, moving the color scale bar to the right and adding a title. When done, we can render the final map by choosing "Run" from the main menu ribbon of the Report Builder:
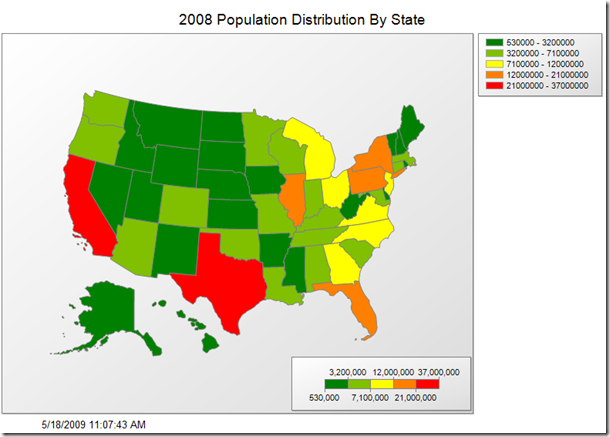
When rendering is completed, the following report is produced:
In the next post, Part 6, we will explore some additional capabilities of the Report Builder to finish off the series.
Technorati Tags: SQL Server 2008,SQL Server 2008 R2,CTP-2,CTP2,Reporting Services,Report Builder,SSRS,Map,Spatial,SQL Server Reporting Services
Comments
Anonymous
May 18, 2009
PingBack from http://microsoft-sharepoint.simplynetdev.com/cartographic-adjustment-of-spatial-data-for-sql-server-reporting-services-part-5/Anonymous
May 19, 2009
Looks exciting.... roll on August!Anonymous
May 26, 2009
Will it be possible to integrate Web Services such as VirtualEarth or WMS Map Services into the report as a back drop? BTW: Nice Work!!Anonymous
May 27, 2009
Yes, we are currently planning on incorporating Virtual Earth as a report back drop. Take a careful look at the "Choose spatial data and map view options" menu panel in the Part 5 post ;-)Anonymous
June 04, 2009
I have been playing around with Dundas Maps for SSRS 2008 in anticipation of SQL Server 2008 R2. There are two things that I wanted to do that do not seem possible, according to what I have been able to find.
- I wanted to add a tooltip for the various shapes. a. I loaded a shape file and everything looks great, except I wanted to show additional data when the user floats over the specific area.
- Drilldown, a. I wanted to allow the user to select a specific shape, and then provide additional functionality, such as adding an Action that grabs a report with the parameters of the specific shape. What I found is that the tooltip control is for the entire map, not the shapes within the map; and the drilldown is possible with the ASP.NET version of the tool but not the SSRS 2008 Version. Will either of these functionalities be available in R2?
Anonymous
June 07, 2009
Both the tooltip and drilldown functionality you describe will be supported in the upcoming Reporting Services Map.Anonymous
June 18, 2009
When the R2 version of the Report Builder is released, can you do everything you've shown here against a SQL Server 2008 R1 database? Or do you need a SQL Server 2008 R2 database as well?Anonymous
June 18, 2009
Yes, you can do everything I've shown against a SQL Server 2008 R1 database. In fact, that is how all of this post's examples were generated.Anonymous
November 12, 2009
thanks, Ed, great series, looks good, i´m looking forward this R2. In the meanwhile, would you suggest any .NET control o similar to create reports, or forms, that integrate thematic maps? Thanks again,
