Visual Studio 2012 and WinDbg Integration
Microsoft has always provided two primary debugging experience: Visual Studio and Debugging Tools for Windows (a.k.a WinDbg). Each debugger provided a very different debugging experience (both from a capabilities point of view as well as usability). WinDbg was most commonly used when you had the need for low level debugging and was also not very user friendly requiring a steep learning curve. Visual Studio on the other hand was a very user friendly type of debugger but not always suited for low level type of debugging. Fortunately, with the introduction of Visual Studio 2012 (beta) both experiences are now folded into the Visual Studio debugger.
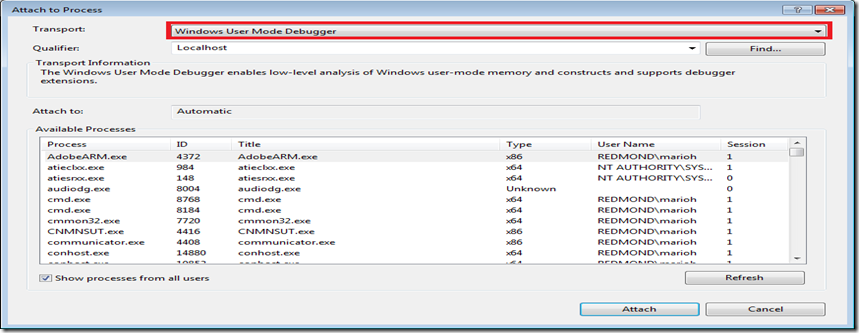
To start using the powerful WinDbg commands and extensions in Visual Studio 2012 it requires that you install the WDK on top of Visual Studio 2012. Once the install is completed you will notice a new transport as shown below:
In the transport dropdown there will be several new choices including Windows User Mode Debugger which is what you want to pick to enable the WinDbg experience. Once you select your process and click attach the debugger immediate window will be displayed and serves essentially the same purpose as the WinDbg command window:
You can now execute all the cool and powerful commands that you would otherwise do in WinDbg directly in the debugger immediate window! This is a great step forward to unifying the debugging experience and avoiding the need to learn two different tools.
Until next time, happy debugging!
UPDATE:
Some users are reporting that the Windows User Mode Debugger is not showing up as a transport option. On Visual Studio 2012 RC it looks like you must also install the Windows SDK for this option to appear.
Comments
Anonymous
June 10, 2012
Is this the only exception to the general rule where thread waiting on a lock remains blocked? Just wanna make sure there are no other surprises :)Anonymous
June 10, 2012
Hi Imak - yes, this is the only surprise behavior that I have come across.Anonymous
June 10, 2012
Thanks Mario. I thought I left my previous comment on post "The Non Blocking Monitor Wait" but I probably left it at wrong place :)Anonymous
June 11, 2012
Mario, do I have to install WDK 8, or 7.1 will work also?Anonymous
June 11, 2012
Hi, I installed WDK 8.Anonymous
June 13, 2012
I'm having issues connecting to localhost with the Windows User Mode Debugger after doing this install. I'm using VS 2012 RC. Any idea what would fix this?Anonymous
June 13, 2012
Hi Joey, Can you outline in some more detail what exactly you are seeing?Anonymous
June 14, 2012
I tried to figure out what the issue was and finally I reinstalled. I had installed both the WDK and the SDK. I rolled back my VM and installed just the WDK and it works now. The error I was receiving was that it could not find the network path for any machine I would specify.Anonymous
June 14, 2012
Perfect. Glad you got it to work.Anonymous
June 18, 2012
Thanks Mario, that's a great feature! Is there any way to make this work with dump files?Anonymous
June 20, 2012
Hi Nico, Yes - absolutely. I just opened a crash dump by - "File->Open->Crash Dump" and the Debugger Immediate Window showed the native debugger integration.Anonymous
July 30, 2013
Hi Mario, Can you provide a detailed procedure of the steps required to setup this environment, is there a particular WDK kit needed? I have all the specified software installed however I don't get the extended debug options.Anonymous
September 24, 2013
How does one debug an IDE application using WinDbg and GFlags to catch memory overruns in VS2012 ? Attaching may be nice but debugging one's own IDE application is good also.Anonymous
November 06, 2013
Hi Mario, Is it possible to debug a user mode process on a remote target machine using this transport instead of just the localhost? If yes, could you please let me know the steps we need to follow in order to achieve that?Anonymous
June 24, 2015
It doesnt work on Visual Studio 2010 (not RC)

