Using MFTrace to Trace Your Own Code
Now that you know how to trace Media Foundation and analyze those traces to figure out what Media Foundation is doing, the next step is to figure out what your own code is doing. That means adding traces for MFTrace to your code.
The simplest way to add traces is to use the OutputDebugString function. OutputDebugString takes a single string as input:
 void WINAPI OutputDebugString(
  __in_opt  LPCTSTR lpOutputString
);
Usually this function sends this string to a debugger. But when MFTrace traces a process, it hooks this function and adds the string to its log.
To make the OutputDebugString look more like printf, we can write a small wrapper which formats strings:
 #include <windows.h>
#include <strsafe.h>

void CDECL Trace(PCSTR pszFormat, ...)
{
    CHAR szTrace[1024];

    va_list args;
    va_start(args, pszFormat);
    (void) StringCchVPrintfA(szTrace, ARRAYSIZE(szTrace), pszFormat, args);
    va_end(args);

    OutputDebugStringA(szTrace);
}

Now we can use this wrapper just like printf:
 INT wmain(INT /*argc*/, PCWSTR /*argv*/[])
{
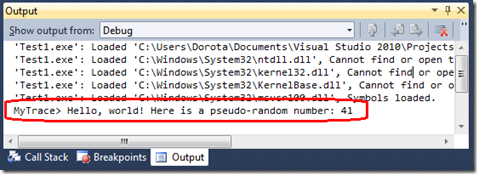
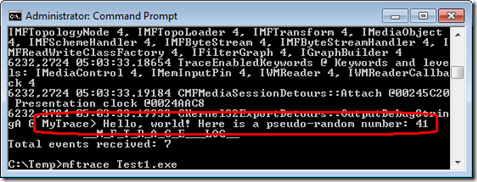
    Trace("MyTrace> Hello, world! Here is a pseudo-random number: %i", rand());
}
The traces are displayed both in the Visual Studio 2010 debugger and in the MFTrace logs.
However, there are two drawbacks to the Trace function shown here:
- String formatting is executed all of the time, regardless of whether the code is being traced. This affects performance.
- The format strings are stored inside the binaries. If you add a lot of traces (which is often needed in asynchronous programming), it fattens the binaries. Therefore, with this kind of tracing code, it is a good idea to use conditional compilation with #ifdef _DEBUG.
The performance issue can be addressed by using EventWriteString instead of OutputDebugString.
Tracing using EventWriteString
The EventWriteString function is similar to OutputDebugString. In addition to the trace string, this function takes a level, a keyword, and a handle:
 ULONG EventWriteString(
  __in  REGHANDLE RegHandle,
  __in  UCHAR Level,
  __in  ULONGLONG Keyword,
  __in  PCWSTR String
);
The handle is initialized by calling EventRegister, and must be freed by calling EventUnregister. This makes EventWriteString slightly more complicated than OutputDebugString, but overall it is still fairly simple to use.
One interesting feature of the EventRegister function is that it takes a callback function of type PENABLECALLBACK. The callback function is called to let your code know whether it is being traced, and at which level and keyword.
Levels and keywords are used to filter out traces at runtime. Levels define the importance of each trace, and keywords define which part of the code each trace belongs to. For the sake of simplicity, we will ignore keywords.
A few standard levels are defined in evntrace.h:
 #define TRACE_LEVEL_CRITICAL    1   // Abnormal exit or termination
#define TRACE_LEVEL_ERROR       2   // Severe errors that need logging
#define TRACE_LEVEL_WARNING     3   // Warnings such as allocation failure
#define TRACE_LEVEL_INFORMATION 4   // Includes non-error cases (e.g., Entry-Exit)
#define TRACE_LEVEL_VERBOSE     5   // Detailed traces from intermediate steps
Using this function, we can implement tracing with very little impact on performance when the code is not being traced.
 #include <windows.h>
#include <wmistr.h>
#include <evntprov.h>
#include <evntrace.h>
#include <strsafe.h>

REGHANDLE g_ETWHandle = NULL;
BOOL g_bEnabled = FALSE;
UCHAR g_nLevel = 0;

void NTAPI EnableCallback(
    LPCGUID /*SourceId*/,
    ULONG IsEnabled,
    UCHAR Level,
    ULONGLONG /*MatchAnyKeyword*/,
    ULONGLONG /*MatchAllKeywords*/,
    PEVENT_FILTER_DESCRIPTOR /*FilterData*/,
    PVOID /*CallbackContext*/
)
{
    switch (IsEnabled)
    {
        case EVENT_CONTROL_CODE_ENABLE_PROVIDER:
            g_bEnabled = TRUE;
            g_nLevel = Level;
            break;

        case EVENT_CONTROL_CODE_DISABLE_PROVIDER:
            g_bEnabled = FALSE;
            g_nLevel = 0;
            break;
    }
}

void TraceInitialize()
{
    // Provider ID: {BAADC0DE-0D5E-42EC-A8EF-56F7DC7F7C82}
    // TODO: Generate a new unique provider ID. Do not reuse this GUID.
    static const GUID guidTrace = {0xbaadc0de, 0xd5e, 0x42ec, {0xa8, 0xef, 0x56, 0xf7, 0xdc, 0x7f, 0x7c, 0x82}};
    (void) EventRegister(&guidTrace, EnableCallback, NULL, &g_ETWHandle);
}

void TraceUninitialize()
{
    if (g_ETWHandle)
    {
        (void) EventUnregister(g_ETWHandle);
        g_ETWHandle = NULL;
        g_bEnabled = FALSE;
     g_nLevel = 0;
    }
}

void CDECL TraceFormat(UCHAR nLevel, PCWSTR pszFormat,  ...)
{
    if ((0 == g_nLevel) || (nLevel <= g_nLevel))
    {
        WCHAR szTrace[1024];

        va_list args;
        va_start(args, pszFormat);
        (void) StringCchVPrintfW(szTrace, ARRAYSIZE(szTrace), pszFormat, args);
        va_end(args);

        (void) EventWriteString(g_ETWHandle, nLevel, 0, szTrace);
    }
}

#define Trace(level, format, ...) if (g_bEnabled) TraceFormat(level, format, __VA_ARGS__);

Adding traces to your code then looks like
INT wmain(INT /*argc*/, PCWSTR /*argv*/[])
{
    TraceInitialize();

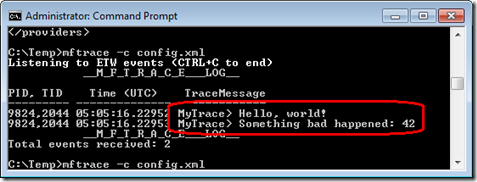
    Trace(TRACE_LEVEL_INFORMATION, L"MyTrace> Hello, world!");
    Trace(TRACE_LEVEL_ERROR, L"MyTrace> Something bad happened: %i", 42);

    TraceUninitialize();

    return 0;
}
This code is minimalist on purpose and could easily be expanded by adding other useful information, such as __FUNCTION__, the ‘this’ pointer, function scope (enter/exit), the returned HRESULT, or a trace header that is better than “MyTrace>” to make it easier to filter the traces.
For MFTrace to log the traces, it needs know which Provider ID (the GUID in TraceInitialize) to trace and which level and keyword to use. This is done by creating a small XML configuration file:
 <?xml version='1.0' encoding='utf-8'?>
<providers>
    <provider level="5" ID="BAADC0DE-0D5E-42EC-A8EF-56F7DC7F7C82" >
        <keyword ID="0xFFFFFFFF"/>
    </provider>
</providers>
Then add ‘-c config.xml’ to the command line of MFTrace (assuming the file is named config.xml).
The configuration file is documented on MSDN.
If you are writing a DLL instead of an EXE, TraceInitialize and TraceUninitialize should be called inside DllMain during DLL_PROCESS_ATTACH and DLL_PROCESS_DETACH respectively. It is usually a bad idea to do anything significant in DllMain, but EventRegister and EventUnregister are designed to be safe to call there.
Although tracing using EventWriteString is more efficient than OutputDebugString, Windows offer even more efficient APIs to do tracing: ETW and WPP. However, they are also more complex to set up.
Tracing using ETW/WPP
ETW and WPP optimize tracing one step further. They reduce the performance impact of tracing when tracing is enabled. Instead of formatting the trace messages inside the process being traced, they format them inside the process listening for traces. This way, tracing does not disturb the traced process as much.
WPP also reduces the size of binaries by storing format strings in PDB/TMF symbol files, rather than inside the binaries themselves. This provides a form of obfuscation, because traces can be logged without symbol files but are very difficult or even impossible to analyze without those symbol files. For that reason among others, WPP is better suited for internal traces which are not meant to be used by customers.
ETW on the other hand is better suited for traces which need to be public. Our first blog post on MF tracing showed how to capture ETW traces using the OS Event Viewer. ETW defines traces using manifests, and supports localization of the format strings.
Covering those two tracing systems would require several more blogs due to their complexity, so for more information please refer to MSDN.
That’s it for this series of blogs on tracing Media Foundation. Do not hesitate to post comments here, or questions on the Media Foundation forum.


