Three ways to debug CLR Stored Procedures
According to the different format of you stored procedures, generally, there are three ways to debug a stored procedure. Here is an example of how to implement that. Before debugging a stored procedure, you need to establish a connection to database in Visual Studio Server Explorer:
- Right click Data Connection and select Add connection.
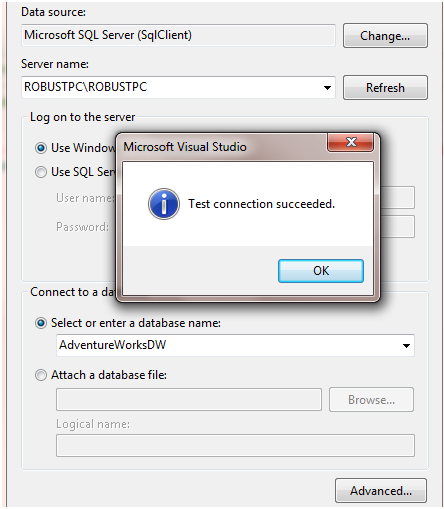
- Input a Server name and select a database (you may need to wait for a few seconds when refreshing)

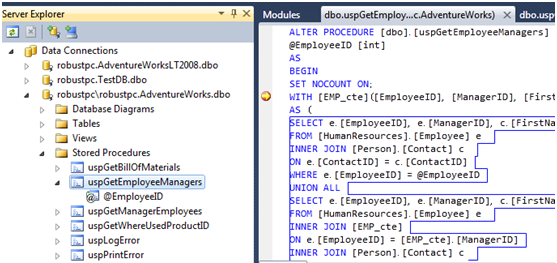
3. Open your Server Explorer, you’ll find you connection to the database.

Method one: Direct Database Debugging
- Navigate to a Stored procedure in Server Explorer
- Right click the stored procedure and select Step into Procedure

Method Two: Debug from SQL Server Project
- Please first open Microsoft SQL Server Management Studio to make your database CLR Enabled. You need Open Database Query editor and execute the following statements:
1: sp_configure 'show advanced options', 1;
2: GO
3: reconfigure;
4: GO
5: sp_configure 'clr enabled', 1;
6: Go
7: reconfigure;
2. Open your stored procedure. There is a Test Scripts folder, you could execute your stored procedure in script file and then right click the script file and select Debug Script. There are two options here: You could set a breakpoint in Script file or in your .CS file. No matter where the breakpoint located, it will get hit.
NOTE: It is not support in VSTS2010 currently. You need to change that target .Net framework in project properties page. Also, you may encounter that deploy failed and require CLR Enable message in Output window, please make sure you run the script code in Step 1.

Method three: Debug by attaching to other processes
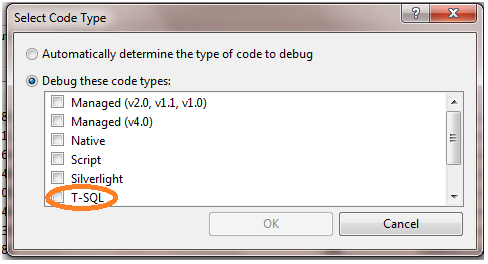
This is not much like attaching to other processes, one thing may be taken into account is to select the T-SQL code type in the Attach to Processes dialog box

The SQL CLR Integration team has an excellent blog introducing these three ways briefly here.