SSAS Data Collection: Collecting Perfmon for SSAS
Applies to Windows7, Windows 2008/R2 and Vista
SQL Server all builds >= SQL 2005
Generally, for troubleshooting SSAS Issues, we recommend to collect below mentioned Perfmon Counters
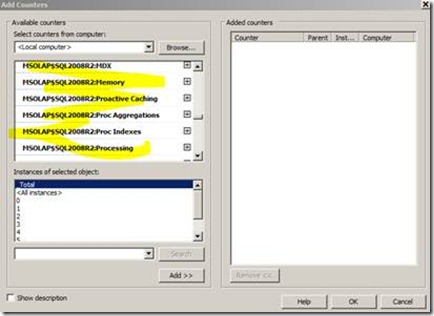
- All Counters Related to SSAS (MSAS_ or MSOLP$)
For default instance SSAS Counter Name suffix with MSAS.n and for named instance it start with MSOLAP$Instance Name
- System, Process, Processor, Physical Disk, Logical Disk, Memory , Page File
· Got to Run & type Perfmon
· Under Data Collector Set, right click on User Defined and Click New Data Collector Set
· Create New Data Collect Set and Give name as MSTrace & Select Create Manually, Click Next
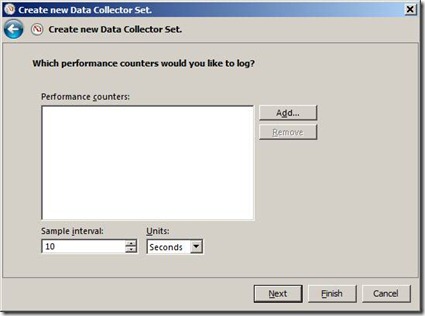
· Click on Add required counters (Sample Interval as 10 Seconds)
· Here you can specify the Run as user which has Admin Access over box (in case you have logged with credential which is non admin)
- By default Location of Trace file is - %systemdrive%\PerfLogs\Admin\ but you can change it.
Right Click on Newly Created Trace – Mstrace and select Properties – In Properties under directory tab you can specify the location also you can schedule as per your requirement.
Once you are done with that click OK and Run trace as shown below
Reproduce the issue and collect traces, once you are done just stop traces and check for traces in location which you had provided in Properties.


