Créer des alertes pour Azure SQL Database et Azure Synapse Analytics à l’aide du Portail Azure
S’applique à : ![]() Azure SQL Database
Azure SQL Database ![]() Azure Synapse Analytics
Azure Synapse Analytics
Cet article explique comment configurer des alertes Azure SQL Database et Azure Synapse Analytics dédiées aux pools SQL à l’aide du portail Azure. Les alertes peuvent vous envoyer un e-mail ou appeler un webhook lorsqu'une métrique (taille de la base de données ou utilisation du processeur, par exemple) atteint le seuil.
Configurer une nouvelle règle d’alerte
Vous pouvez recevoir une alerte en fonction de métriques de surveillance pour vos services Azure ou d'événements sur ces derniers.
- Valeurs de métriques - L’alerte se déclenche quand la valeur d’une métrique spécifiée dépasse le seuil que vous avez défini. Pour plus d’informations, consultez Dimensions de métrique.
- Événements du journal d’activité : une alerte peut se déclencher sur chaque événement ou uniquement lorsqu’un certain nombre d’événements se produisent. Pour plus d’informations, consultez Alertes du journal d'activité.
- Intégrité des ressources : alerte liée aux événements d’état d’intégrité des ressources, notamment si l’événement a été lancé par la plateforme ou l’utilisateur. Pour plus d’informations, consultez alertes de ressource d’intégrité.
Vous pouvez configurer de nombreux types d’actions pour qu’une alerte s’exécute lorsqu’elle se déclenche, notamment :
- Envoyer des notifications par e-mail à l’administrateur de service et aux coadministrateurs
- Envoyez un e-mail à des e-mails supplémentaires que vous spécifiez, notamment pour un rôle Azure Resource Manager.
- Appeler un numéro de téléphone avec l’invite vocale
- Envoyer un SMS à un numéro de téléphone
- Envoyer une notification Azure mobile app
- Démarrer un runbook d’automation
- Appeler une fonction Azure
- Démarrer une action Event Hubs
- Créer un ticket compatible ITSM
- Sélectionner une action d’application logique
- Appeler un webhook ou un webhook sécurisé
Vous pouvez configurer et obtenir des informations sur les règles d’alerte à l’aide des ressources suivantes :
- Portail Azure, comme indiqué dans cet article.
- PowerShell
- Interface de ligne de commande (CLI)
- Modèle ARM
- API REST Azure Monitor
Découvrez comment bien démarrer avec une nouvelle règle d’alerte dans le portail Azure
- Sur le portail Azure, localisez la ressource que vous souhaitez surveiller et sélectionnez-la.
- Dans le menu ressource, sous Surveillance, sélectionnez Alertes. Le texte et l’icône peuvent varier légèrement pour les différentes ressources.
- Sélectionnez le bouton + Créer, puis règle d’alerte.
- Dans la page Créer une règle d’alerte, l’étendue est automatiquement configurée sur la ressource individuelle.
Remarque
Pour éviter l’expansion de nombreuses alertes indépendantes, vous pouvez configurer des alertes pour toutes les ressources d’un type dans un abonnement, un groupe de ressources ou un serveur logique Azure SQL Database. Utilisez l’onglet Étendue pour modifier l’étendue de la nouvelle règle d’alerte.
Capturez les pics d’activité ou le stress soutenu des ressources avec des alertes sur la catégorie de signal Métriques.
Sous l’onglet Condition, sélectionnez Afficher tous les signaux et Sélectionner un signal dans la liste des métriques.
Sélectionnez la métrique souhaitée, par exemple pourcentage processeur. Sélectionnez Appliquer.
Une fois que vous avez sélectionné un signal, les options logiques d’alerte s’affichent. Un aperçu de l’activité récente dans cette ressource pour ce signal s’affiche également.
Configurez un type Seuil pour déterminer quand l’alerte prendra des mesures. Choisissez le type d’agrégation, l’opérateur et la Valeur seuil comme vous le souhaitez. Un seuil typique est : Statique, Maximum, Supérieur à, 80 %.
Champ Description Seuil Spécifiez si le seuil doit être évalué sur la base d’une valeur statique ou d’une valeur dynamique.
Un seuil statique évalue la règle à l’aide de la valeur de seuil que vous configurez.
Les seuils dynamiques utilisent des algorithmes de machine learning pour apprendre en continu les schémas comportementaux des métriques et calculer les seuils appropriés pour les comportements inattendus. Des informations supplémentaires sont disponibles sur l’utilisation de seuils dynamiques pour les alertes de métriques.Opérateur Sélectionnez l’opérateur pour comparer la valeur de métrique au seuil.
Si vous utilisez des seuils dynamiques, les règles d’alerte peuvent utiliser des seuils adaptés au comportement des métriques pour les limites supérieures et inférieures dans la même règle d’alerte. Sélectionnez l’un de ces opérateurs :
- Supérieur au seuil supérieur ou inférieur au seuil inférieur (par défaut)
- Supérieur au seuil supérieur
- Inférieur au seuil inférieurType d’agrégation Sélectionnez la fonction d’agrégation à appliquer sur les points de données : Somme, Nombre, Moyenne, Min ou Max. Valeur du seuil Si vous avez sélectionné un seuil statique, entrez sa valeur pour la logique de condition. Unité Si le signal de métrique sélectionné prend en charge différentes unités (par exemple, octets, Ko, Mo et Go) et si vous avez sélectionné un seuil statique, entrez l’unité pour la logique de condition. Sensibilité du seuil Si vous avez sélectionné un seuil dynamique, entrez le niveau de sensibilité. Le niveau de sensibilité affecte la marge de dérive par rapport au modèle de série métrique nécessaire pour déclencher une alerte.
- Élevé : Les seuils sont stricts et proches du schéma de la série de métriques. Une règle d’alerte est déclenchée dès le plus petit écart, ce qui génère davantage d’alertes.
- Moyen : Les seuils sont moins stricts et plus équilibrés. Il y a moins d’alertes qu’avec une sensibilité élevée (valeur par défaut).
- Faible : Les seuils sont lâches, ce qui permet un écart plus important par rapport au schéma de la série de métriques. Les règles d’alerte sont uniquement déclenchées lors de grands écarts, ce qui génère moins d’alertes.Granularité d’agrégation Sélectionnez l’intervalle utilisé pour regrouper les points de données à l’aide de la fonction de type d’agrégation. Choisissez une granularité d’agrégation (période) supérieure à la fréquence d’évaluation afin de réduire la probabilité de manquer la première période d’évaluation d’une série chronologique ajoutée. Fréquence d’évaluation Sélectionnez la fréquence à laquelle la règle d’alerte doit être exécutée. Sélectionnez une fréquence inférieure à la granularité d’agrégation afin de générer une fenêtre glissante pour l’évaluation. Sous Quand évaluer, déterminez la fréquence souhaitée de l’évaluation. Utilisez les listes déroulantes Vérifier toutes et périodes de recherche.
Si vous le souhaitez, vous pouvez ajouter plusieurs conditions pour cette alerte. Sélectionnez l’alerte Ajouter une condition si vous le souhaitez.
Sélectionnez Suivant : Actions>.
Créer la nouvelle règle d’alerte
- Sélectionnez un Groupe d'actions existant dans le volet Sélectionner des groupes d'actions ou créez un groupe d'actions dans votre abonnement. Un groupe d’actions vous permet de définir l’action à exécuter lorsqu’une condition d’alerte se produit. Cette action définit ce qui se passe au déclenchement d’une alerte (par exemple, l’envoi d’un e-mail).
- Vous pouvez également utiliser la fonctionnalité Utiliser des actions rapides pour créer un groupe d’actions et fournir un e-mail ou une cible de notification Azure mobile app.
- Sélectionnez Suivant : Détails>.
- Par défaut, la gravité d’une règle d’alerte est 3 - Caractère informatif. Vous pouvez ajuster la gravité de la règle d’alerte comme vous le souhaitez.
- Fournissez le nom de règle d'alerte. Il est facultatif, mais recommandé, de fournir une description.
- Sous Options avancées :
- Assurez-vous d’activer à la création pour lancer l’exécution de la règle d’alerte dès que vous avez fini de la créer.
- Les options de résolution automatique des alertes sont activées par défaut. Cela change l’alerte en alerte avec état, ce qui signifie que l’alerte est résolue lorsque la condition n’est plus remplie.
- Sélectionnez Suivant : Balises>.
- Envisagez d'utiliser les balises Azure. Par exemple, la balise « Owner » ou « CreatedBy » pour identifier qui a créé la ressource, et la balise « Environnement » pour identifier si cette ressource est en production, développement, etc. Pour plus d’informations, consultez Développer une stratégie de nommage et de catégorisation des ressources Azure.
- Sélectionnez Revoir + créer.
- Sélectionnez Créer. Bientôt, l’alerte est active.
Gérer les règles d’alerte
Remarque
Pour supprimer les alertes inutiles, consultez Suppression des alertes à l’aide de règles d’action.
Les alertes existantes doivent être gérées à partir du menu Alertes du tableau de bord du portail Azure. Pour afficher, suspendre, activer, modifier et supprimer des alertes existantes :
Dans le volet Alertes de votre Azure SQL Database, sélectionnez Règles d’alerte.
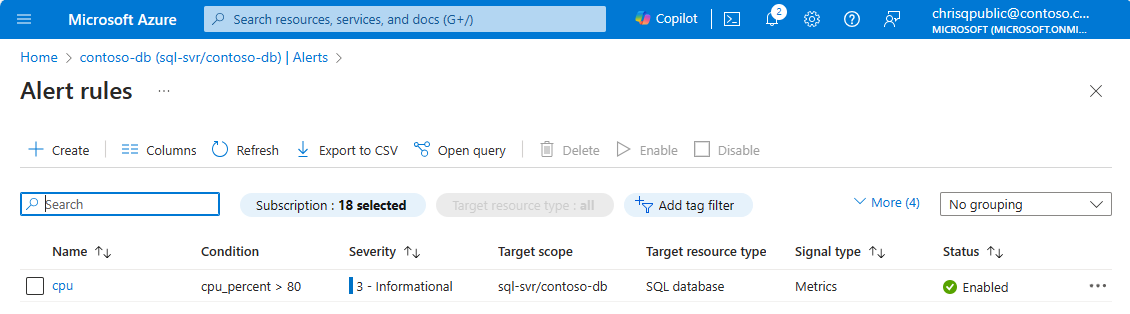
Sélectionnez une règle d’alerte existante pour la gérer. Les règles actives existantes peuvent être modifiées et ajustées à votre convenance. Les règles actives peuvent également être suspendues sans être supprimées.
