Device health, Sensor health & OS report
Applies to:
- Microsoft Defender XDR
- Microsoft Defender for Endpoint
- Microsoft Defender for Endpoint Plan 1
- Microsoft Defender for Endpoint Plan 2
- Microsoft Defender for Business
Want to experience Microsoft Defender for Endpoint? Sign up for a free trial.
The Device Health report provides information about the devices in your organization. The report includes trending information showing the sensor health state, antivirus status, OS platforms, Windows 10 versions, and Microsoft Defender Antivirus update versions.
Important
For Windows Server 2012 R2 and Windows Server 2016 to appear in device health reports, these devices must be onboarded using the modern unified solution package. For more information, see New functionality in the modern unified solution for Windows Server 2012 R2 and 2016.
In the Microsoft 365 Security dashboard navigation panel, select Reports, and then open Device health and compliance.
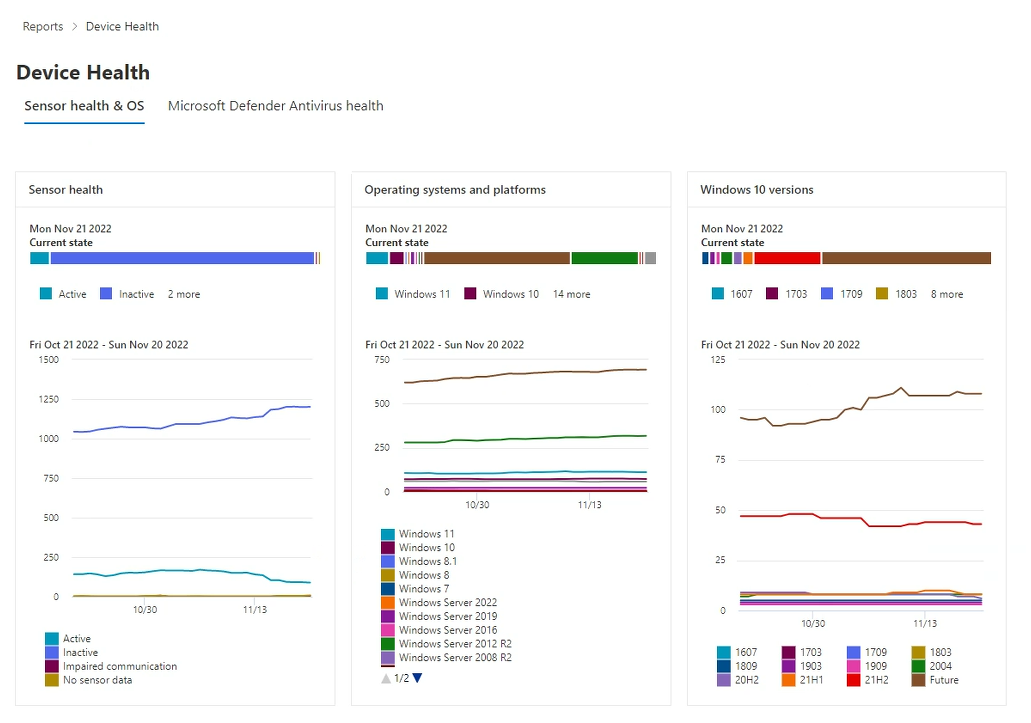
- The Sensor health & OS tab provides general operating system information, divided into three cards that display the following device attributes:
Report access permissions
To access the Device health and antivirus compliance report in the Microsoft 365 Security dashboard, the following permissions are required:
| Permission name | Permission type |
|---|---|
| View Data | Threat and vulnerability management (TVM) |
To Assign these permissions:
- Sign in to Microsoft Defender XDR using account with Security administrator or Global administrator role assigned.
- In the navigation pane, select Settings > Endpoints > Roles (under Permissions).
- Select the role you'd like to edit.
- Select Edit.
- In Edit role, on the General tab, in Role name, type a name for the role.
- In Description type a brief summary of the role.
- In Permissions, select View Data, and under View Data select Threat and vulnerability management (TVM).
For more information about user role management, see Create and manage roles for role-based access control.
Sensor health & OS tab
Sensor health and OS cards report on general operating system health, which includes detection sensor health, up to date versus out-of-date operating systems, and Windows 10 versions.
Each of the three cards on the Sensor health tab has two reporting sections, Current state and device trends, presented as graphs:
Current state graph
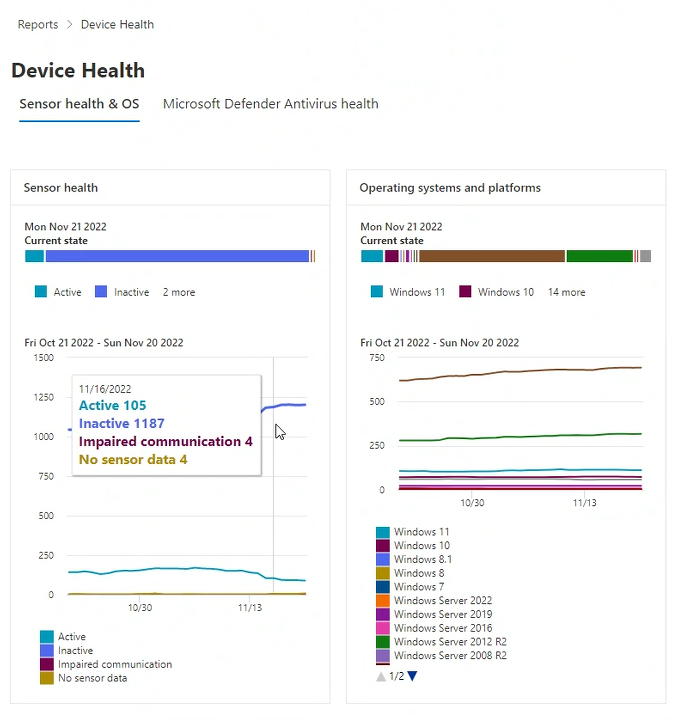
In each card, the Current state (referred to in some documentation as Device summary) is the top, horizontal bar graph. Current state is a snapshot that shows information collected about devices in your organization, scoped to the current day. This graph represents the distribution of devices across your organization that report status or are detected to be in a specific state.
Device trends graph
The lower graph on each of the three cards isn't named, but is commonly known as device trends. The device trends graph depicts the collection of devices across your organization, throughout the time span indicated directly above the graph. By default, the device trends graph displays device information from the 30-day period, ending in the latest full day. To gain a better perspective about trends occurring in your organization, you can fine-tune the reporting period by adjusting the time period shown. To adjust the time period, open the filter and select a start day and end day.
Filtering data
Use the provided filters to include or exclude devices with certain attributes. You can select multiple filters to apply from the device attributes. When applied, filters apply to all three cards in the report.
For example, to show data about Windows 10 devices with Active sensor health state:
- Under Filters > Sensor health state > Active.
- Then select OS platforms > Windows 10.
- Select Apply.
Sensor health card
The Sensor health card displays information about the sensor state on devices. Sensor health provides an aggregate view of devices that are:
- active
- inactive
- experiencing impaired communications
- or where no sensor data is reported
Devices that are either experiencing impaired communications, or devices from which no sensor data is detected could expose your organization to risks, and warrant investigation. Likewise, devices that are inactive for extended periods of time could expose your organization to threats due to out-of-date software. Devices that are inactive for long periods of time also warrant investigation.
Note
In a small percentage of cases, the numbers and distributions reported when clicking on the horizontal Sensor health bar graph will be out of synch with the values shown in the Device inventory page. The disparity in values can occur because the Sensor Health Reports has a different refresh cadence than the Device Inventory page.
Operating systems and platforms card
This card shows the distribution of operating systems and platforms that exist within your organization. OS systems and platforms can give useful insights into whether devices in your organization are running current or outdated operating systems. When new operating systems are introduced, security enhancements are frequently included that improve your organization's posture against security threats.
For example, Secure Boot (introduced in Windows 8) practically eliminated the threat from some of the most harmful types of malware. Improvements in Windows 10 provide PC manufacturers the option to prevent users from disabling Secure Boot. Preventing users from disabling Secure Boot removes almost any chance of malicious rootkits or other low-level malware from infecting the boot process.
Ideally, the "Current state" graph shows that the number of operating systems is weighted in favor of more current OS over older versions. Otherwise, the trends graph indicates that new systems are being adopted and/or older systems are being updated or replaced.
Windows versions card
The Windows 10 versions card shows the distribution of Windows devices and their versions in your organization. In the same way that an upgrade from Windows 8 to Windows 10 improves security in your organization, changing from early releases of Windows to more current versions improves your posture against possible threats.
The Windows version trend graph can help you quickly determine whether your organization is keeping current by updating to the most recent, most secure versions of Windows 10.
See also
Tip
Performance tip Due to a variety of factors (examples listed below) Microsoft Defender Antivirus, like other antivirus software, can cause performance issues on endpoint devices. In some cases, you might need to tune the performance of Microsoft Defender Antivirus to alleviate those performance issues. Microsoft's Performance analyzer is a PowerShell command-line tool that helps determine which files, file paths, processes, and file extensions might be causing performance issues; some examples are:
- Top paths that impact scan time
- Top files that impact scan time
- Top processes that impact scan time
- Top file extensions that impact scan time
- Combinations – for example:
- top files per extension
- top paths per extension
- top processes per path
- top scans per file
- top scans per file per process
You can use the information gathered using Performance analyzer to better assess performance issues and apply remediation actions. See: Performance analyzer for Microsoft Defender Antivirus.
Microsoft Defender Antivirus health
Tip
Do you want to learn more? Engage with the Microsoft Security community in our Tech Community: Microsoft Defender for Endpoint Tech Community.
Commentaires
Bientôt disponible : Tout au long de 2024, nous allons supprimer progressivement GitHub Issues comme mécanisme de commentaires pour le contenu et le remplacer par un nouveau système de commentaires. Pour plus d’informations, consultez https://aka.ms/ContentUserFeedback.
Envoyer et afficher des commentaires pour


