Workbook visualizations
Workbooks provide a rich set of capabilities for visualizing Azure Monitor data. The exact set of capabilities depends on the data sources and result sets, but you can expect them to converge over time. These controls allow you to present your analysis in rich interactive reports.
Workbooks support these kinds of visual components:
- Text parameters
- Using queries:
Note
Each visualization and data source might have its own limits.
Examples
Text parameters
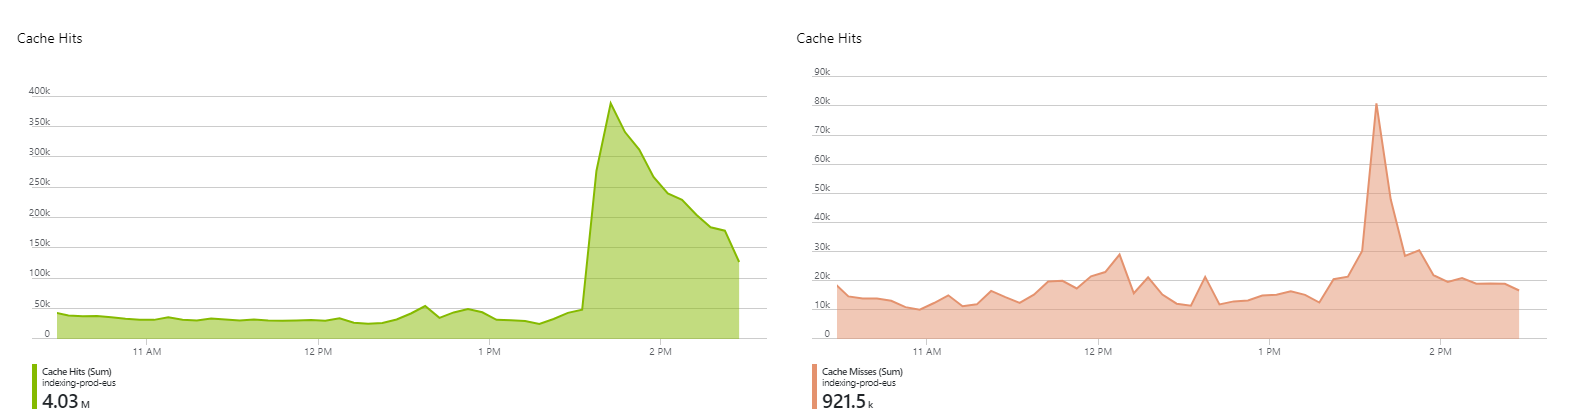
Charts
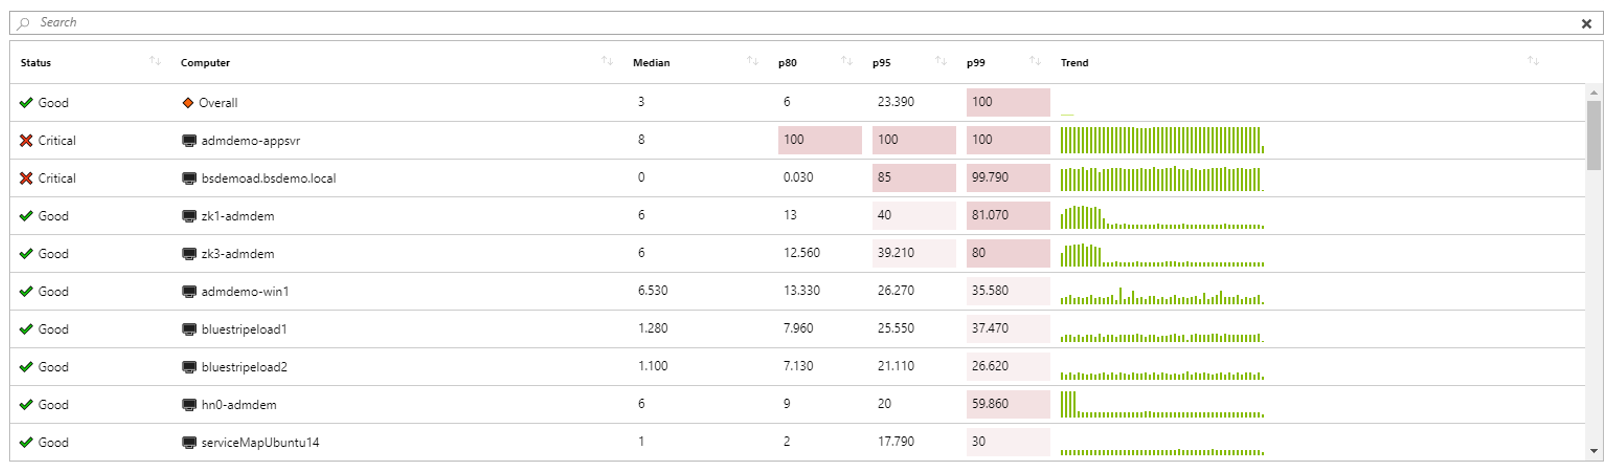
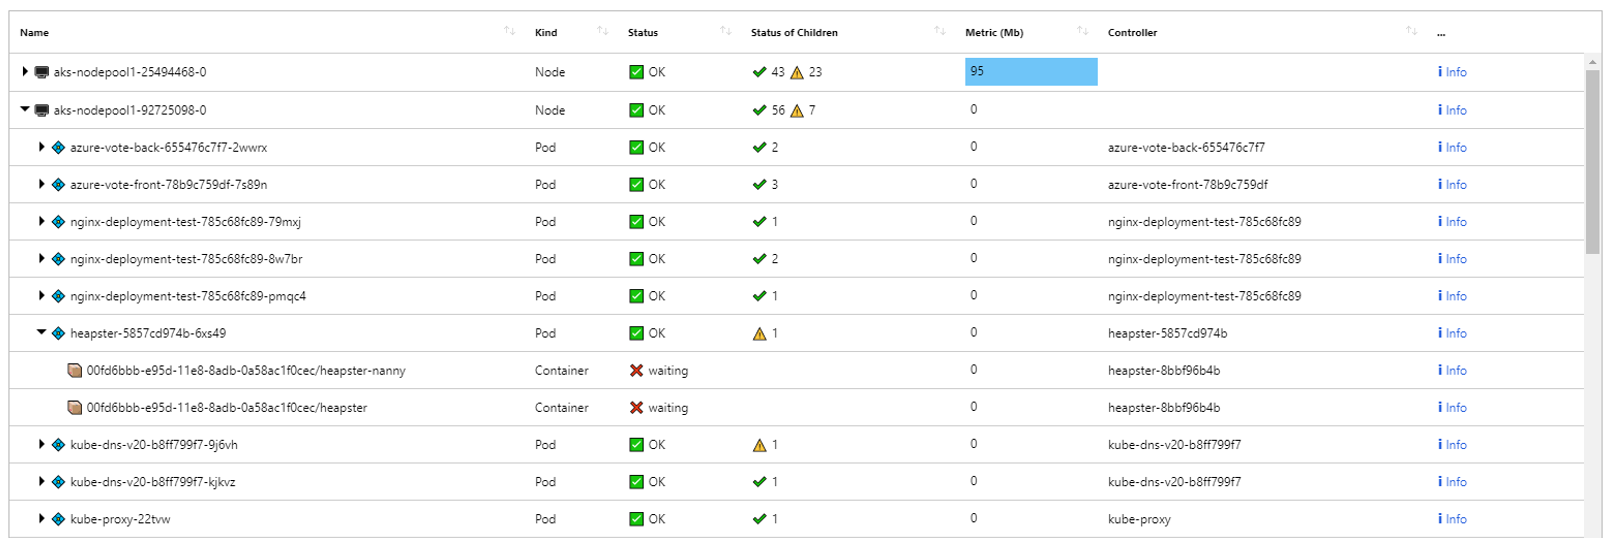
Grids
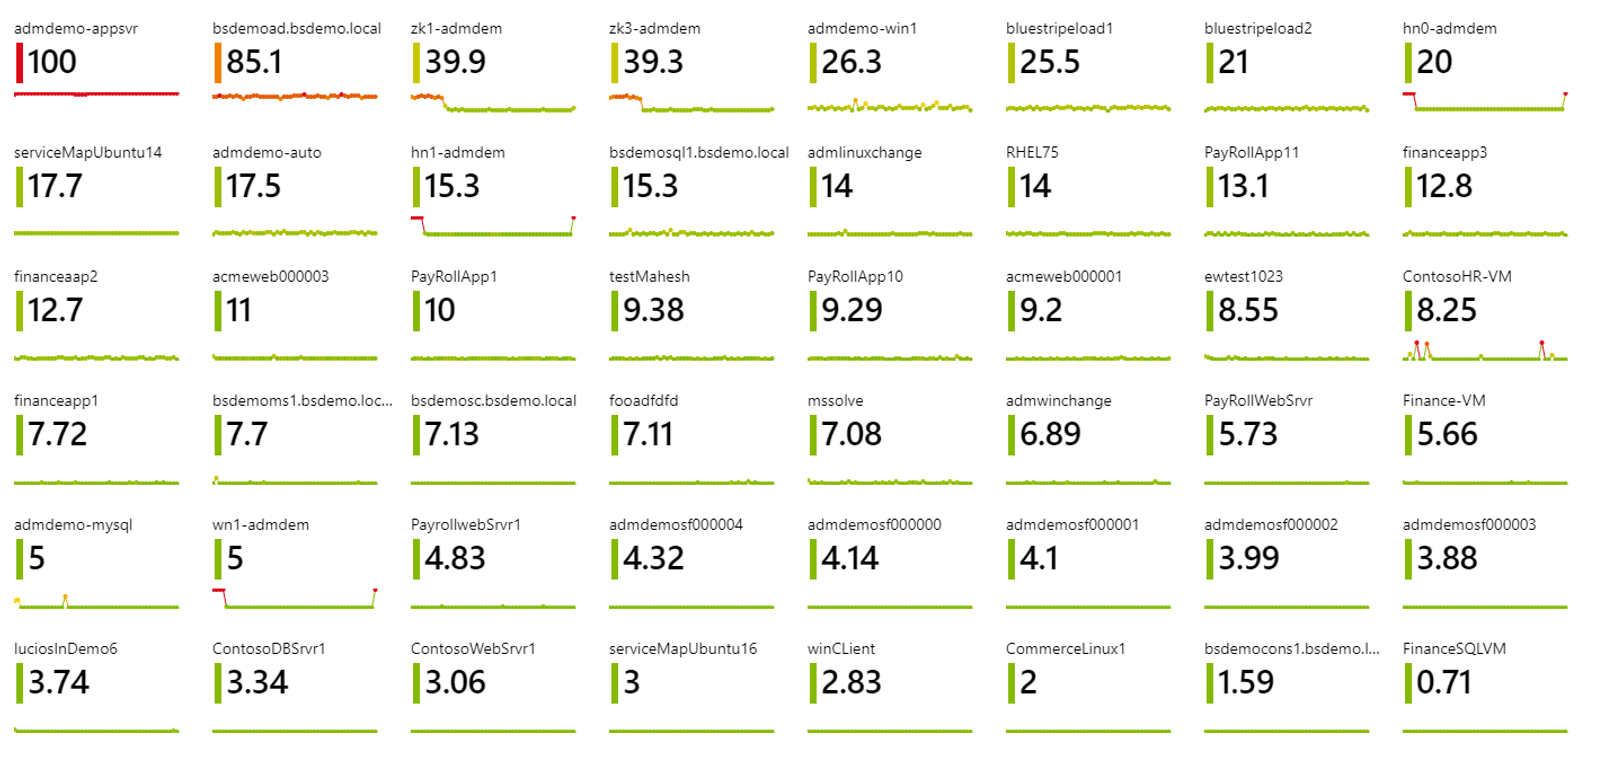
Tiles
Trees
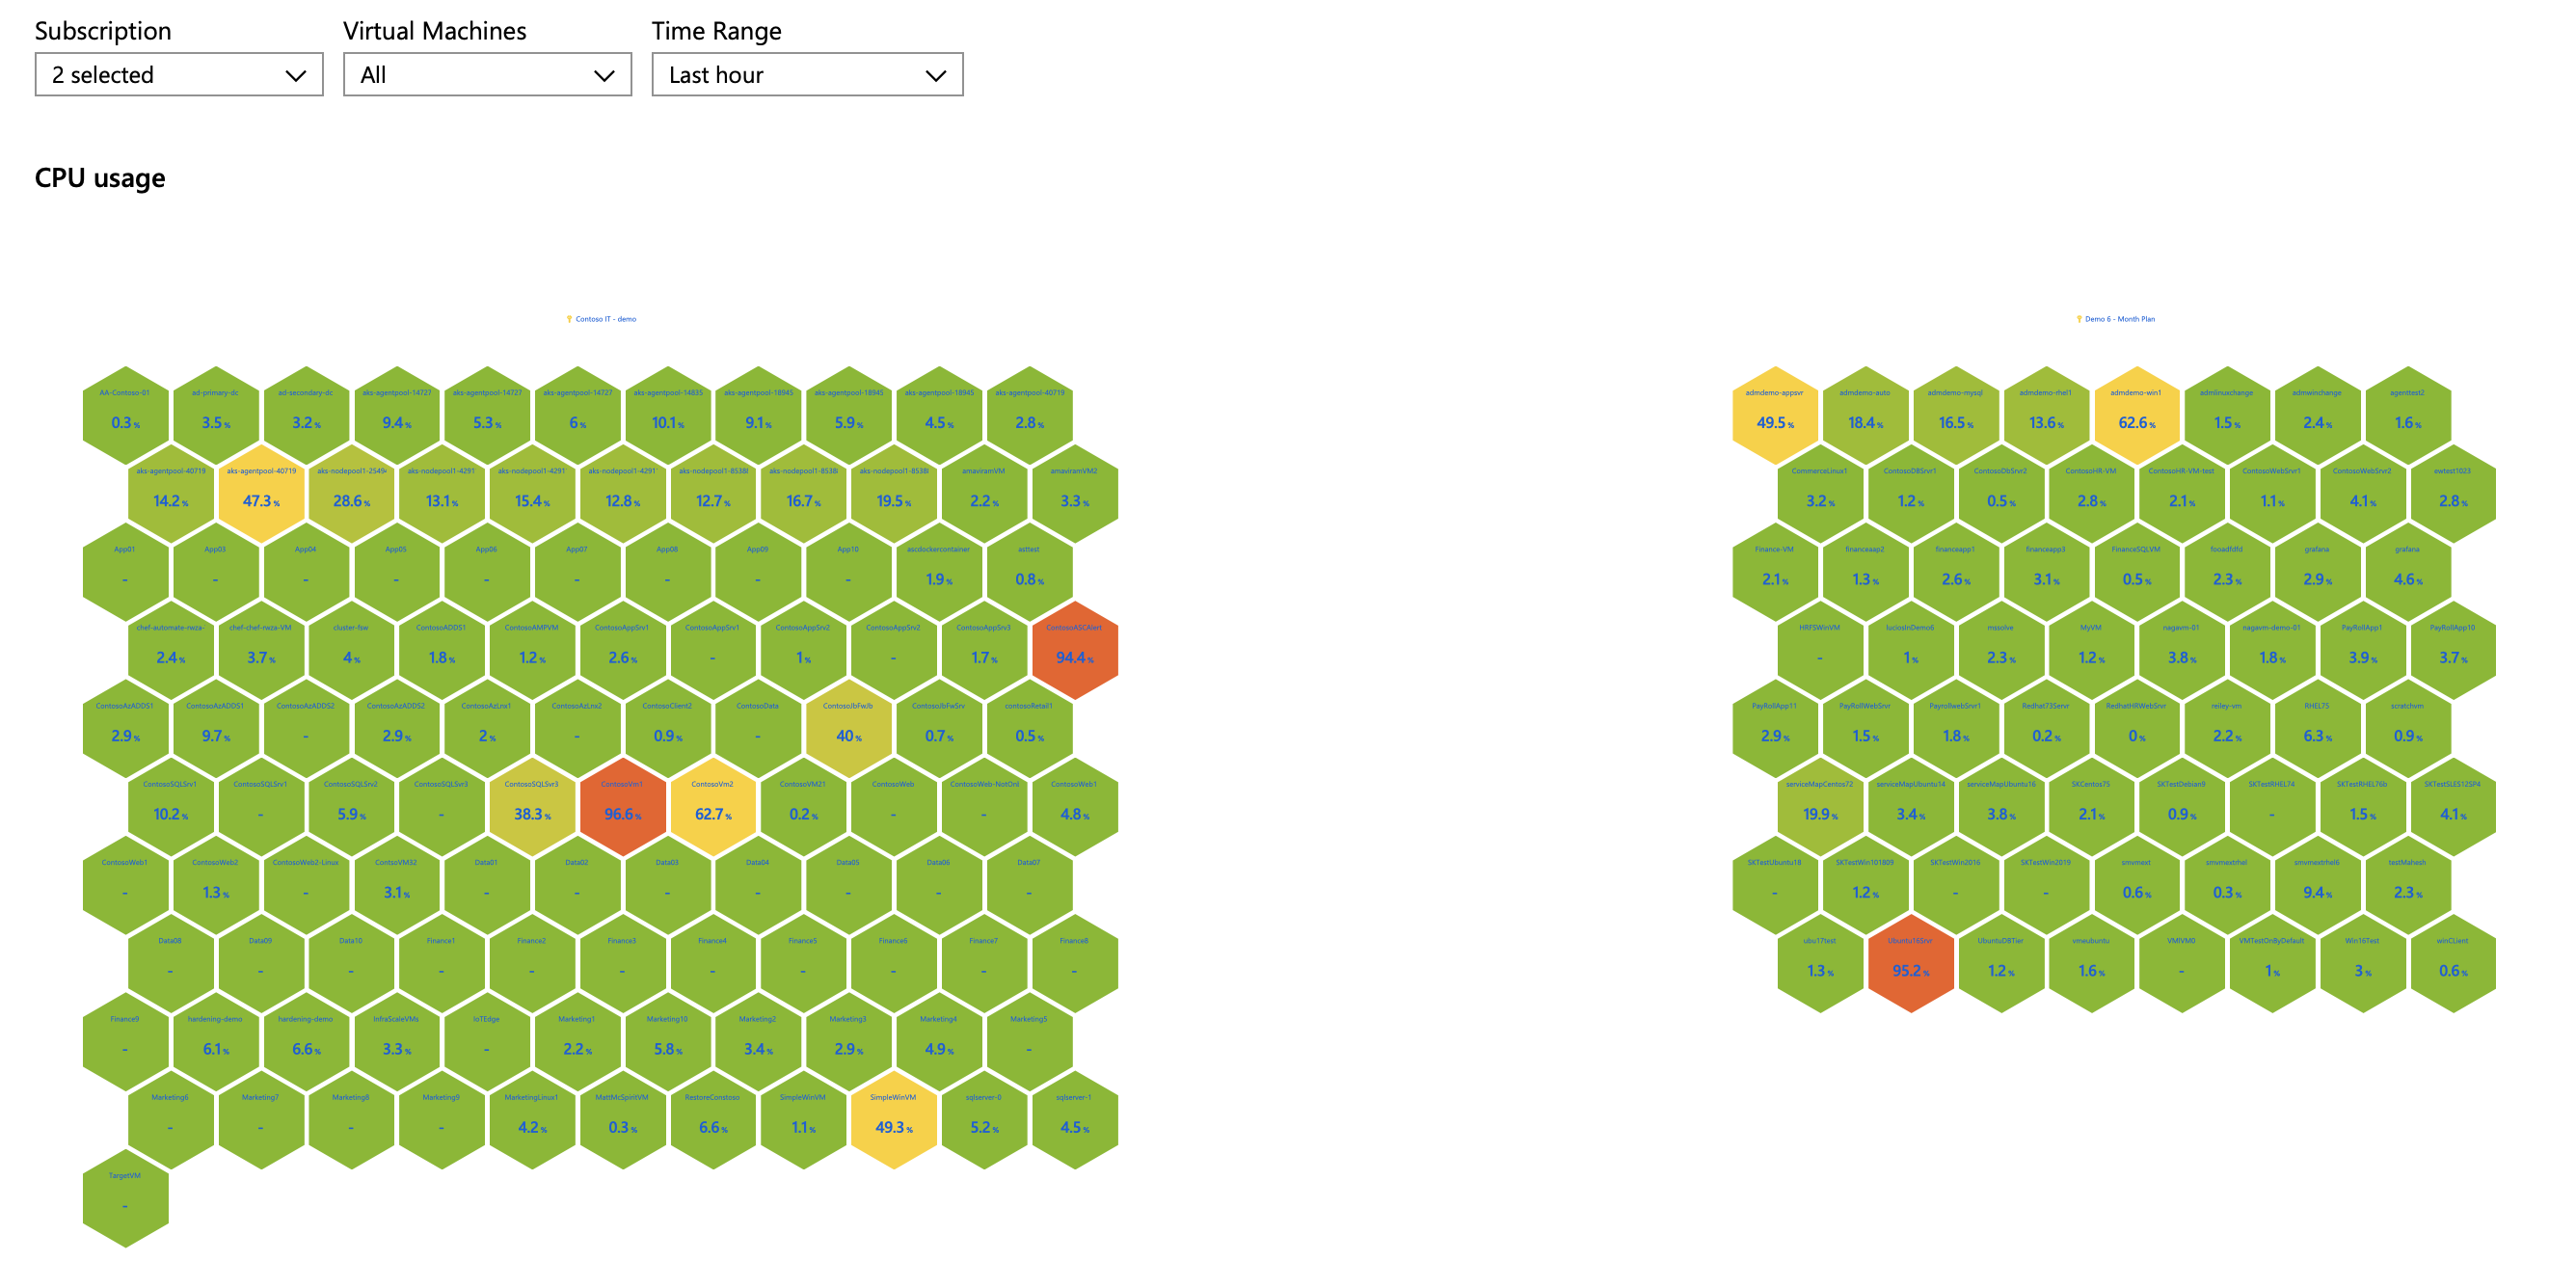
Honeycomb
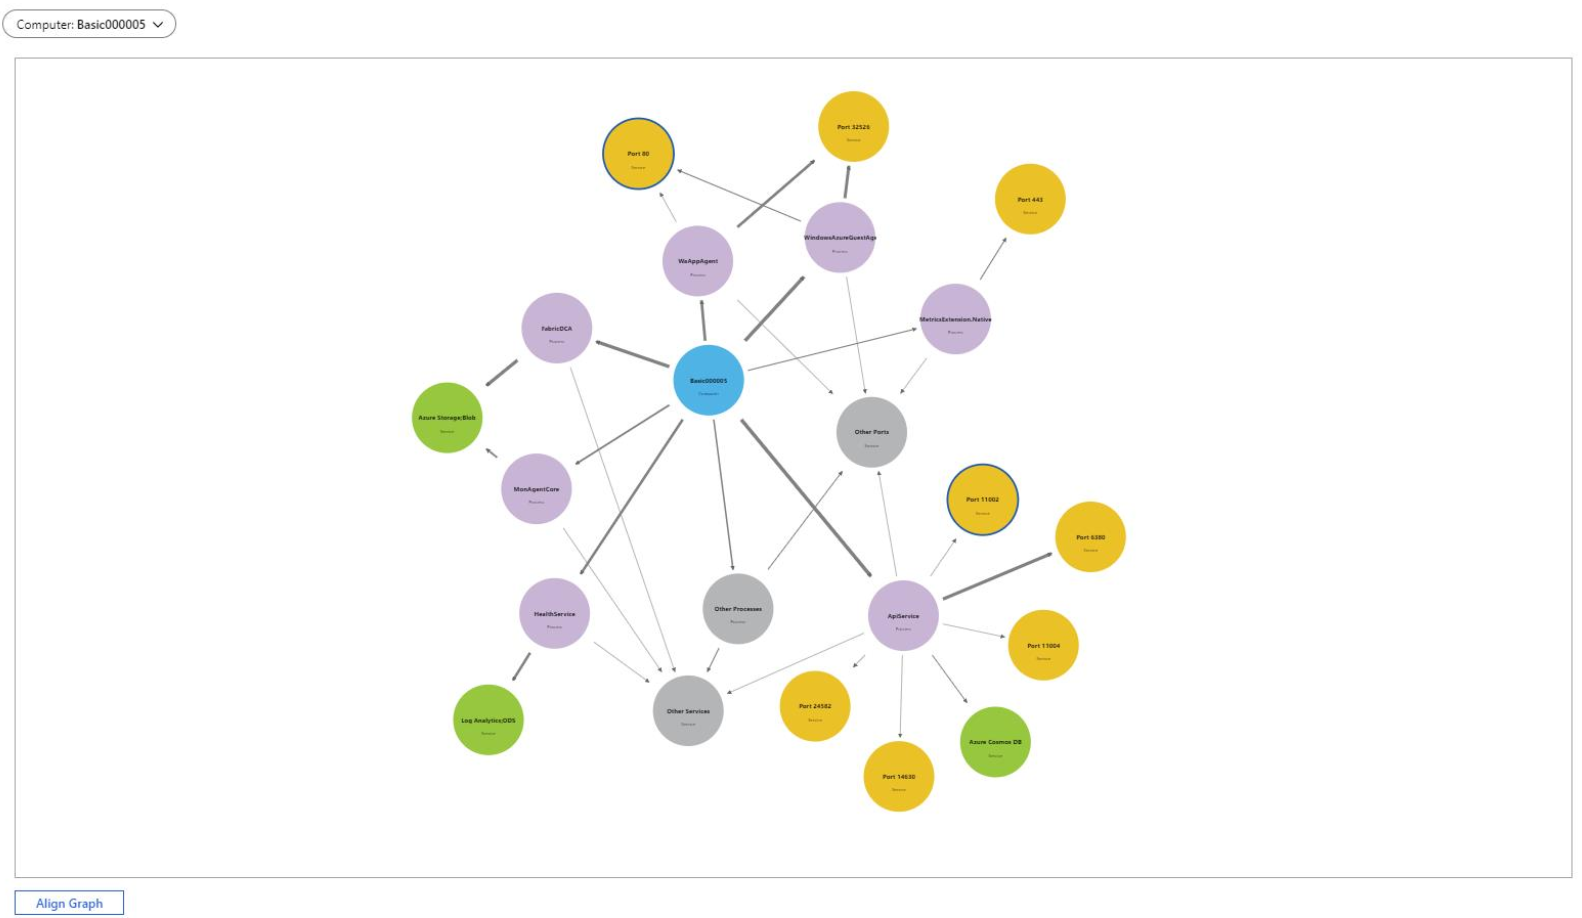
Graphs
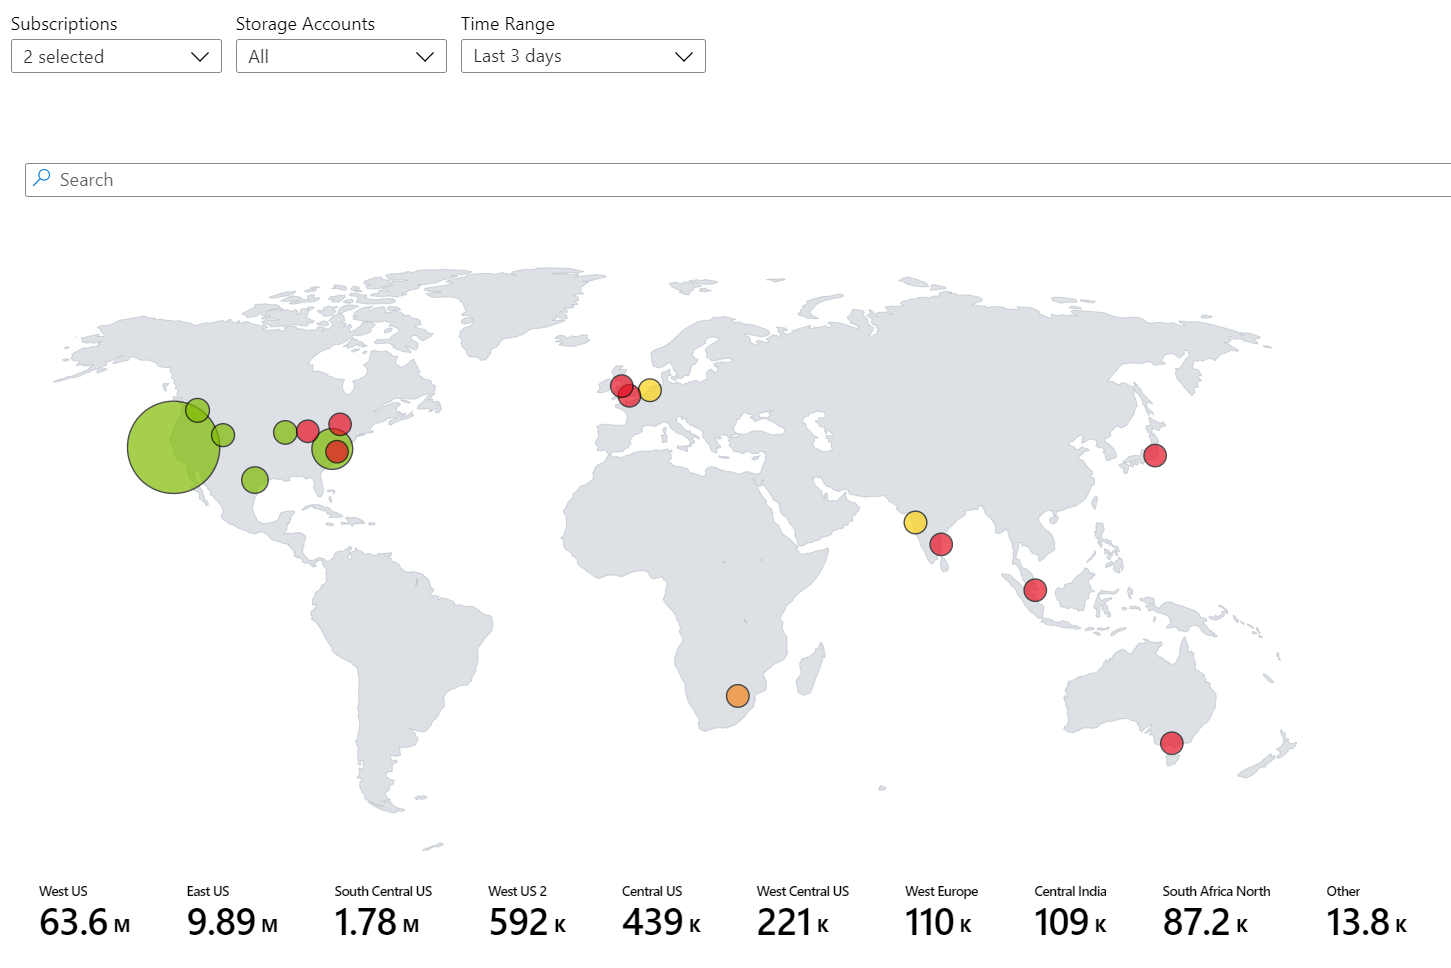
Maps
Text visualizations
Next steps
Aiseolas
Ag teacht go luath: Le linn 2024 beimid ag cur deireadh de réir a chéile le fadhbanna GitHub mar mheicníocht aiseolais d’inneachar agus córas aiseolais nua a chur ina áit. Chun tuilleadh faisnéise a fháil féach ar :https://aka.ms/ContentUserFeedback.
Cuir isteach agus féach ar aiseolas le haghaidh