Configure Azure Load Testing for high-scale load
In this article, you learn how to configure your load test for high-scale with Azure Load Testing. Azure Load Testing abstracts the complexity of provisioning the infrastructure for simulating high-scale traffic. To scale out a load test, you can configure the number of parallel test engine instances. To achieve an optimal load distribution, you can monitor the test instance health metrics in the Azure Load Testing dashboard.
Prerequisites
An Azure account with an active subscription. If you don't have an Azure subscription, create a free account before you begin.
An existing Azure load testing resource. To create an Azure load testing resource, see the quickstart Create and run a load test.
Configure load parameters for a load test
To simulate user traffic for your application, you can configure the load pattern and the number of virtual users you want to simulate load for. By running the load test across many parallel test engine instances, Azure Load Testing can scale out the number of virtual users that simulate traffic to your application. The load pattern determines how the load is distributed over the duration of the load test. Examples of load patterns are linear, stepped, or spike load.
Depending on the type of load test, URL-based or JMeter-based, you have different options to configure the target load and the load pattern. The following table lists the differences between the two test types.
| Test type | Number of virtual users | Load pattern |
|---|---|---|
| URL-based (basic) | Specify the target number of virtual users in the load test configuration. | Linear load pattern, based on the ramp-up time and number of virtual users. |
| URL-based (advanced) | Specify the number of test engines and the number of virtual users per instance in the load test configuration. | Configure the load pattern (linear, step, spike). |
| JMeter-based | Specify the number of test engines in the load test configuration. Specify the number of virtual users in the test script. | Configure the load pattern in the test script. |
Configure load parameters for URL-based tests
To specify the load parameters for a URL-based load test:
In the Azure portal, go to your Azure Load Testing resource.
In the left navigation, select Tests to view all tests.
In the list, select your load test, and then select Edit.
Alternately, you can also edit the test configuration from the test details page. To do so, select Configure, and then select Test.
On the Basics page, make sure to select Enable advanced settings.
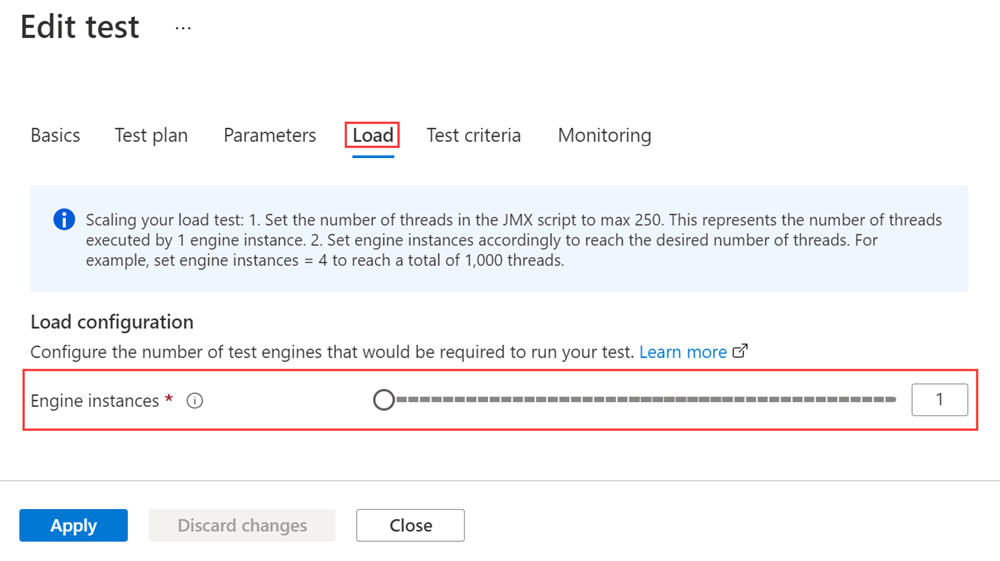
On the Edit test page, select the Load tab.
For URL-based tests, you can configure the number of parallel test engine instances and the load pattern.
Use the Engine instances slider control to update the number of parallel test engine instances. Alternately, enter the target value in the input box.
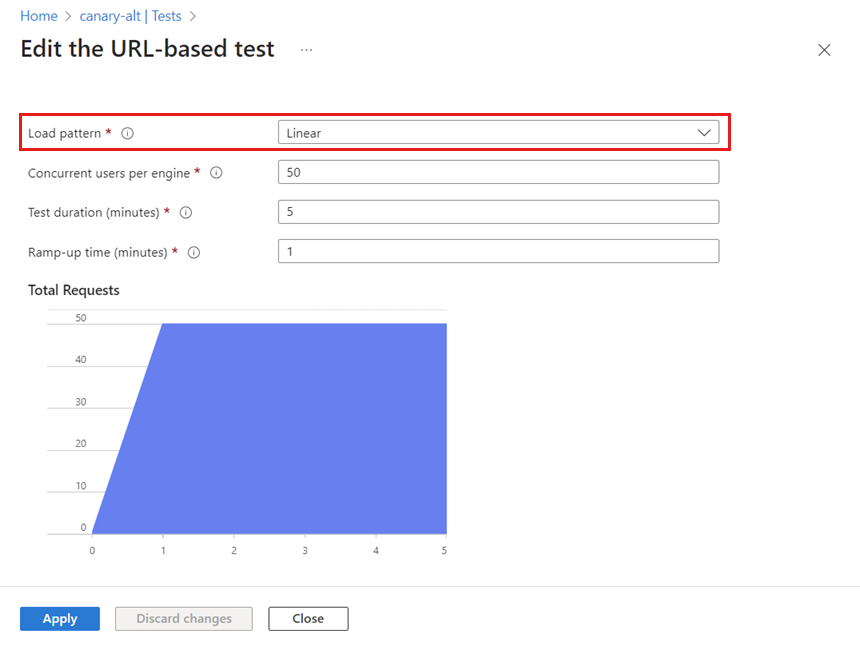
Select the Load pattern value from the list.
For each pattern, fill the corresponding configuration settings. The chart gives a visual representation of the load pattern and its configuration parameters.
Configure load parameters for JMeter-based tests
To specify the load parameters for a JMeter-based load test:
In the Azure portal, go to your Azure Load Testing resource.
In the left navigation, select Tests to view all tests.
In the list, select your load test, and then select Edit.
Alternately, you can also edit the test configuration from the test details page. To do so, select Configure, and then select Test.
On the Edit test page, select the Load tab. Use the Engine instances slider control to update the number of test engine instances, or enter the value directly in the input box.
Select Apply to modify the test and use the new configuration when you rerun it.
Monitor engine instance metrics
To make sure that the test engine instances, themselves aren't a performance bottleneck, you can monitor resource metrics of the test engine instance. A high resource usage for a test instance might negatively influence the results of the load test.
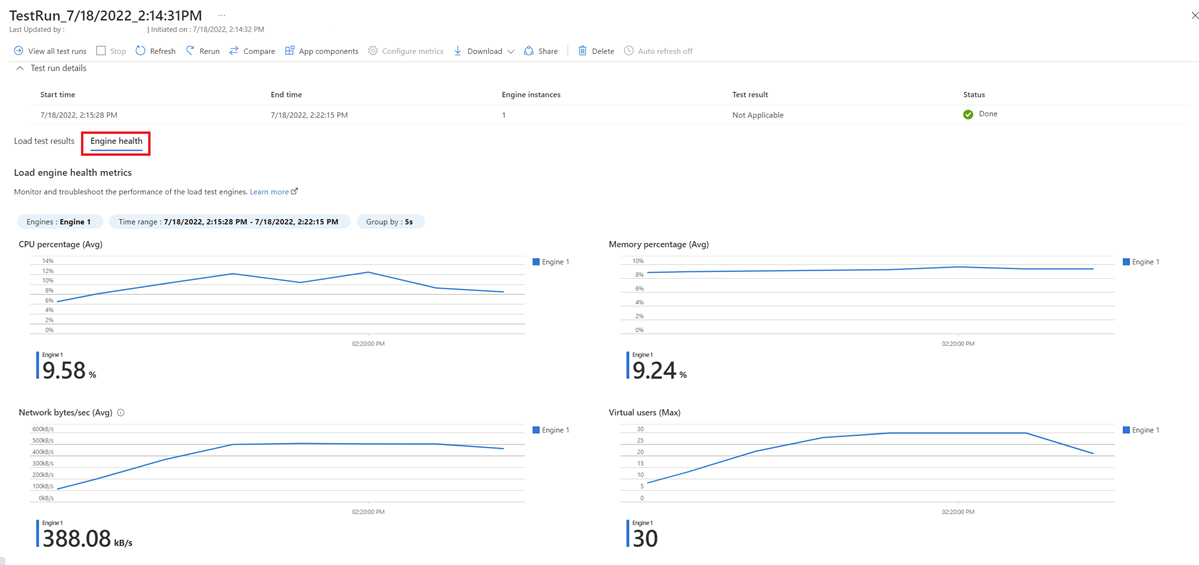
Azure Load Testing reports four resource metrics for each instance:
- CPU percentage.
- Memory percentage.
- Network bytes per second.
- Number of virtual users.
A test engine instance is considered healthy if the average CPU percentage or memory percentage over the duration of the test run remains below 75%.
To view the engine resource metrics:
Go to your Load Testing resource. On the left pane, select Tests to view the list of load tests.
In the list, select your load test to view the list of test runs.
In the test run list, select your test run.
In the test run dashboard, select the Engine health to view the engine resource metrics.
Optionally, select a specific test engine instance by using the filters controls.
Troubleshoot unhealthy engine instances
If one or multiple instances show a high resource usage, it could affect the test results. To resolve the issue, try one or more of the following steps:
Reduce the number of threads (virtual users) per test engine. To achieve a target number of virtual users, you might increase the number of engine instances for the load test.
Ensure that your script is effective, with no redundant code.
If the engine health status is unknown, rerun the test.
Determine requests per second
The maximum number of requests per second (RPS) that Azure Load Testing can generate for your load test depends on the application's latency and the number of virtual users (VUs). Application latency is the total time from sending an application request by the test engine, to receiving the response. The virtual user count is the number of parallel requests that Azure Load Testing performs at a given time.
To calculate the number of requests per second, apply the following formula: RPS = (# of VUs) * (1/latency in seconds).
For example, if application latency is 20 milliseconds (0.02 seconds), and you're generating a load of 2,000 VUs, you can achieve around 100,000 RPS (2000 * 1/0.02s).
To achieve a target number of requests per second, configure the total number of virtual users for your load test.
Note
Apache JMeter only reports requests that made it to the server and back, either successful or not. If Apache JMeter is unable to connect to your application, the actual number of requests per second will be lower than the maximum value. Possible causes might be that the server is too busy to handle the request, or that a TLS/SSL certificate is missing. To diagnose connection problems, you can check the Errors chart in the load testing dashboard and download the load test log files.
Test engine instances and virtual users
In the Apache JMeter script, you can specify the number of parallel threads. Each thread represents a virtual user that accesses the application endpoint. We recommend that you keep the number of threads in a script below a maximum of 250.
In Azure Load Testing, test engine instances are responsible for running the Apache JMeter script. All test engine instances run in parallel. You can configure the number of instances for a load test.
The total number of virtual users for a load test is then: VUs = (# threads) * (# test engine instances).
To simulate a target number of virtual users, you can configure the parallel threads in the JMeter script, and the engine instances for the load test accordingly. Monitor the test engine metrics to optimize the number of instances.
For example, to simulate 1,000 virtual users, set the number of threads in the Apache JMeter script to 250. Then configure the load test with four test engine instances (that is, 4 x 250 threads).
The location of the Azure Load Testing resource determines the location of the test engine instances. All test engine instances within a Load Testing resource are hosted in the same Azure region.
Related content
- More information about service limits and quotas in Azure Load Testing.


