Monitor online endpoints
Azure Machine Learning uses integration with Azure Monitor to track and monitor metrics and logs for online endpoints. You can view metrics in charts, compare between endpoints and deployments, pin to Azure portal dashboards, configure alerts, query from log tables, and push logs to supported targets. You can also use Application Insights to analyze events from user containers.
Metrics: For endpoint-level metrics such as request latency, requests per minute, new connections per second, and network bytes, you can drill down to see details at the deployment level or status level. Deployment-level metrics such as CPU/GPU utilization and memory or disk utilization can also be drilled down to instance level. Azure Monitor allows tracking these metrics in charts and setting up dashboards and alerts for further analysis.
Logs: You can send metrics to the Log Analytics workspace where you can query the logs using Kusto query syntax. You can also send metrics to Azure Storage accounts and/or Event Hubs for further processing. In addition, you can use dedicated log tables for online endpoint related events, traffic, and console (container) logs. Kusto query allows complex analysis and joining of multiple tables.
Application insights: Curated environments include integration with Application Insights, and you can enable or disable this integration when you create an online deployment. Built-in metrics and logs are sent to Application Insights, and you can use the built-in features of Application Insights (such as Live metrics, Transaction search, Failures, and Performance) for further analysis.
In this article you learn how to:
- Choose the right method to view and track metrics and logs
- View metrics for your online endpoint
- Create a dashboard for your metrics
- Create a metric alert
- View logs for your online endpoint
- Use Application Insights to track metrics and logs
Prerequisites
- Deploy an Azure Machine Learning online endpoint.
- You must have at least Reader access on the endpoint.
Metrics
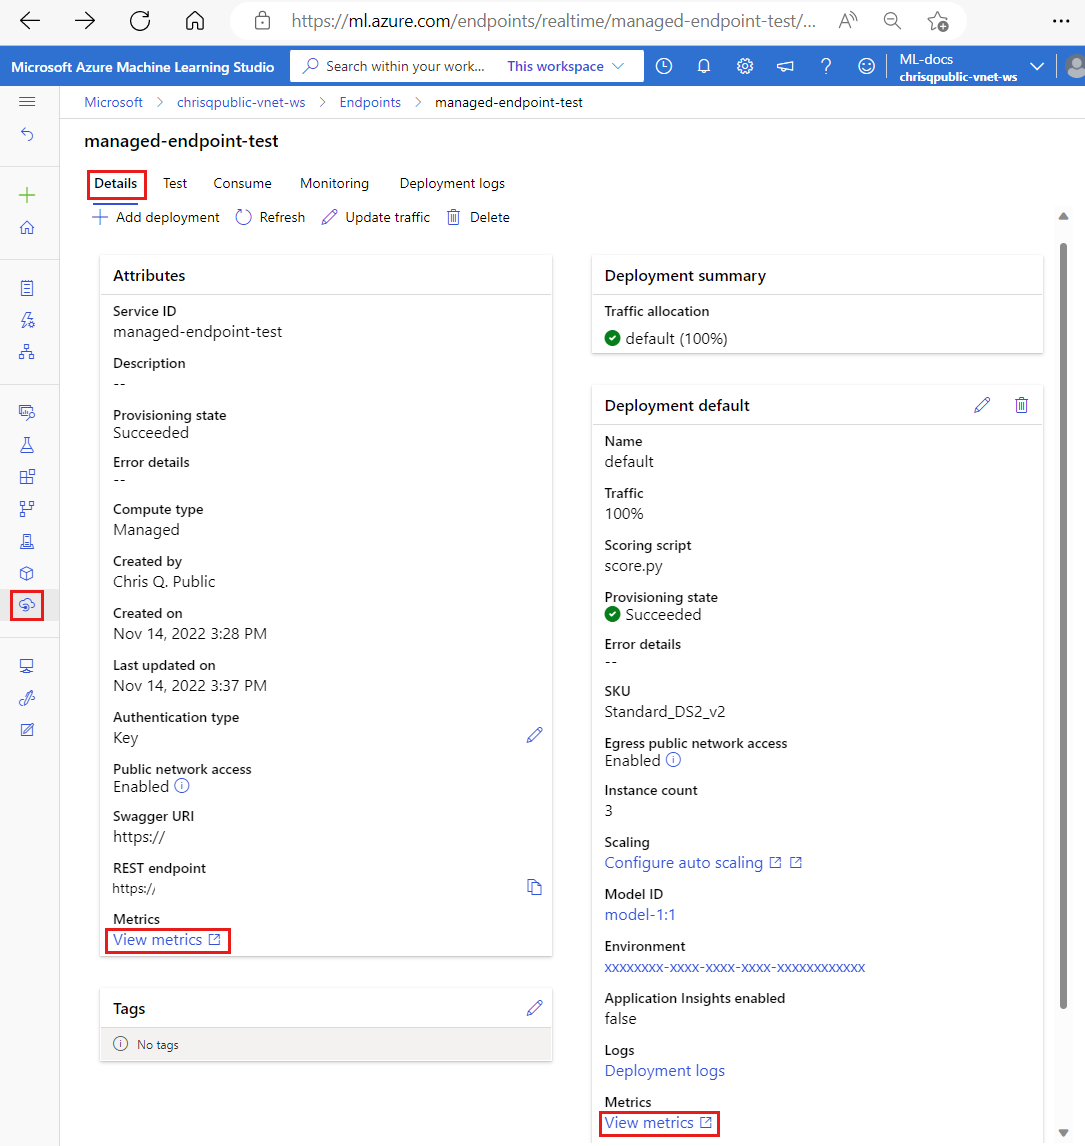
You can view metrics pages for online endpoints or deployments in the Azure portal. An easy way to access these metrics pages is through links available in the Azure Machine Learning studio user interface—specifically in the Details tab of an endpoint's page. Following these links will take you to the exact metrics page in the Azure portal for the endpoint or deployment. Alternatively, you can also go into the Azure portal to search for the metrics page for the endpoint or deployment.
To access the metrics pages through links available in the studio:
Go to the Azure Machine Learning studio.
In the left navigation bar, select the Endpoints page.
Select an endpoint by clicking its name.
Select View metrics in the Attributes section of the endpoint to open up the endpoint's metrics page in the Azure portal.
Select View metrics in the section for each available deployment to open up the deployment's metrics page in the Azure portal.

To access metrics directly from the Azure portal:
Sign in to the Azure portal.
Navigate to the online endpoint or deployment resource.
Online endpoints and deployments are Azure Resource Manager (ARM) resources that can be found by going to their owning resource group. Look for the resource types Machine Learning online endpoint and Machine Learning online deployment.
In the left-hand column, select Metrics.
Available metrics
Depending on the resource that you select, the metrics that you see will be different. Metrics are scoped differently for online endpoints and online deployments.
Metrics at endpoint scope
- Traffic
| Metric ID | Unit | Description | Aggregate Method | Splittable By | Example Metric Alerts |
|---|---|---|---|---|---|
| RequestsPerMinute | Count | The number of requests sent to Endpoint within a minute | Average | Deployment, ModelStatusCode, StatusCode, StatusCodeClass | Alert me when I have <= 0 transactions in the system |
| RequestLatency | Milliseconds | The complete interval of time taken for a request to be responded | Average | Deployment | Alert me when average latency > 2 sec |
| RequestLatency_P50 | Milliseconds | The request latency at the 50th percentile aggregated by all request latency values collected over a period of 60 seconds | Average | Deployment | Alert me when average latency > 2 sec |
| RequestLatency_P90 | Milliseconds | The request latency at the 90th percentile aggregated by all request latency values collected over a period of 60 seconds | Average | Deployment | Alert me when average latency > 2 sec |
| RequestLatency_P95 | Milliseconds | The request latency at the 95th percentile aggregated by all request latency values collected over a period of 60 seconds | Average | Deployment | Alert me when average latency > 2 sec |
| RequestLatency_P99 | Milliseconds | The request latency at the 99th percentile aggregated by all request latency values collected over a period of 60 seconds | Average | Deployment | Alert me when average latency > 2 sec |
- Network
| Metric ID | Unit | Description | Aggregate Method | Splittable By | Example Metric Alerts |
|---|---|---|---|---|---|
| NetworkBytes | Bytes per second | The bytes per second served for the endpoint | Average | - | - |
| ConnectionsActive | Count | The total number of concurrent TCP connections active from clients | Average | - | - |
| NewConnectionsPerSecond | Count | The average number of new TCP connections per second established from clients | Average | - | - |
- Model Data Collection
| Metric ID | Unit | Description | Aggregate Method | Splittable By | Example Metric Alerts |
|---|---|---|---|---|---|
| DataCollectionEventsPerMinute | Count | The number of data collection events processed per minute | Average | Deployment, Type | - |
| DataCollectionErrorsPerMinute | Count | The number of data collection events dropped per minute | Average | Deployment, Type, Reason | - |
For example, you can split along the deployment dimension to compare the request latency of different deployments under an endpoint.
Bandwidth throttling
Bandwidth will be throttled if the quota limits are exceeded for managed online endpoints. For more information on limits, see the article on limits for online endpoints. To determine if requests are throttled:
- Monitor the "Network bytes" metric
- The response trailers will have the fields:
ms-azureml-bandwidth-request-delay-msandms-azureml-bandwidth-response-delay-ms. The values of the fields are the delays, in milliseconds, of the bandwidth throttling. For more information, see Bandwidth limit issues.
Metrics at deployment scope
- Saturation
| Metric ID | Unit | Description | Aggregate Method | Splittable By | Example Metric Alerts |
|---|---|---|---|---|---|
| CpuUtilizationPercentage | Percent | How much percentage of CPU was utilized | Minimun, Maximum, Average | InstanceId | Alert me when % Capacity Used > 75% |
| CpuMemoryUtilizationPercentage | Percent | How much percent of Memory was utilized | Minimun, Maximum, Average | InstanceId | |
| DiskUtilization | Percent | How much disk space was utilized | Minimun, Maximum, Average | InstanceId, Disk | |
| GpuUtilizationPercentage | Percent | Percentage of GPU utilization on an instance - Utilization is reported at one minute intervals | Minimun, Maximum, Average | InstanceId | |
| GpuMemoryUtilizationPercentage | Percent | Percentage of GPU memory utilization on an instance - Utilization is reported at one minute intervals | Minimun, Maximum, Average | InstanceId | |
| GpuEnergyJoules | Joule | Interval energy in Joules on a GPU node - Energy is reported at one minute intervals | Minimun, Maximum, Average | InstanceId |
- Availability
| Metric ID | Unit | Description | Aggregate Method | Splittable By | Example Metric Alerts |
|---|---|---|---|---|---|
| DeploymentCapacity | Count | The number of instances in the deployment | Minimum, Maximum, Average | InstanceId, State | Alert me when the % Availability of my service drops below 100% |
- Traffic
| Metric ID | Unit | Description | Aggregate Method | Splittable By | Example Metric Alerts |
|---|---|---|---|---|---|
| RequestsPerMinute | Count | The number of requests sent to online deployment within a minute | Average | StatusCode | Alert me when I have <= 0 transactions in the system |
| RequestLatency_P50 | Milliseconds | The average P50 request latency aggregated by all request latency values collected over the selected time period | Average | - | Alert me when average latency > 2 sec |
| RequestLatency_P90 | Milliseconds | The average P90 request latency aggregated by all request latency values collected over the selected time period | Average | - | Alert me when average latency > 2 sec |
| RequestLatency_P95 | Milliseconds | The average P95 request latency aggregated by all request latency values collected over the selected time period | Average | - | Alert me when average latency > 2 sec |
| RequestLatency_P99 | Milliseconds | The average P99 request latency aggregated by all request latency values collected over the selected time period | Average | - | Alert me when average latency > 2 sec |
- Model Data Collection
| Metric ID | Unit | Description | Aggregate Method | Splittable By | Example Metric Alerts |
|---|---|---|---|---|---|
| DataCollectionEventsPerMinute | Count | The number of data collection events processed per minute | Average | InstanceId, Type | - |
| DataCollectionErrorsPerMinute | Count | The number of data collection events dropped per minute | Average | InstanceId, Type, Reason | - |
For instance, you can compare CPU and/or memory utilization between difference instances for an online deployment.
Create dashboards and alerts
Azure Monitor allows you to create dashboards and alerts, based on metrics.
Create dashboards and visualize queries
You can create custom dashboards and visualize metrics from multiple sources in the Azure portal, including the metrics for your online endpoint. For more information on creating dashboards and visualizing queries, see Dashboards using log data and Dashboards using application data.
Create alerts
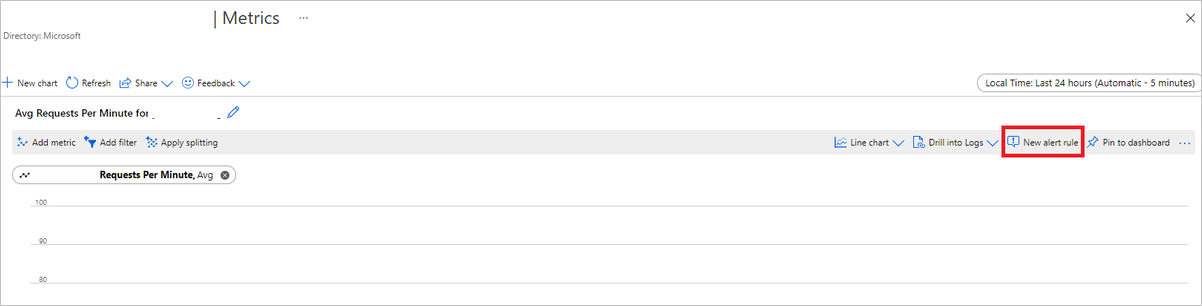
You can also create custom alerts to notify you of important status updates to your online endpoint:
At the top right of the metrics page, select New alert rule.
Select a condition name to specify when your alert should be triggered.
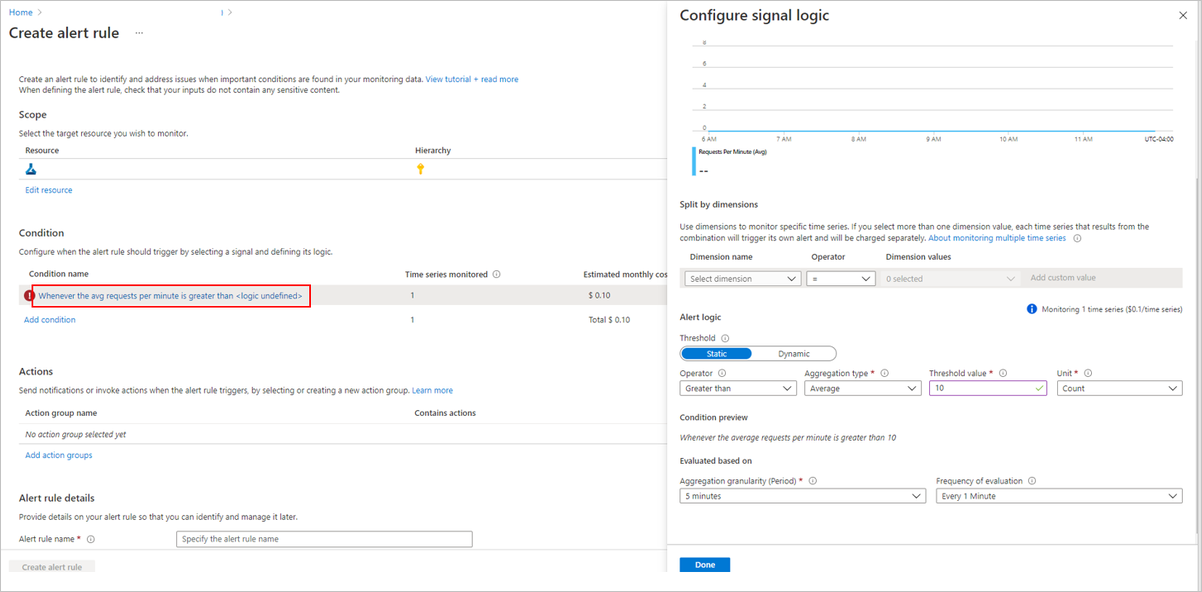
Select Add action groups > Create action groups to specify what should happen when your alert is triggered.
Choose Create alert rule to finish creating your alert.


For more information, see Create Azure Monitor alert rules.
Enable autoscale based on metrics
You can enable autoscale of deployments using metrics using UI or code. When you use code (either CLI or SDK), you can use Metrics IDs listed in the table of available metrics in condition for triggering autoscaling. For more information, see Autoscaling online endpoints.
Logs
There are three logs that can be enabled for online endpoints:
AmlOnlineEndpointTrafficLog: You could choose to enable traffic logs if you want to check the information of your request. Below are some cases:
If the response isn't 200, check the value of the column "ResponseCodeReason" to see what happened. Also check the reason in the "HTTPS status codes" section of the Troubleshoot online endpoints article.
You could check the response code and response reason of your model from the column "ModelStatusCode" and "ModelStatusReason".
You want to check the duration of the request like total duration, the request/response duration, and the delay caused by the network throttling. You could check it from the logs to see the breakdown latency.
If you want to check how many requests or failed requests recently. You could also enable the logs.
AmlOnlineEndpointConsoleLog: Contains logs that the containers output to the console. Below are some cases:
If the container fails to start, the console log can be useful for debugging.
Monitor container behavior and make sure that all requests are correctly handled.
Write request IDs in the console log. Joining the request ID, the AmlOnlineEndpointConsoleLog, and AmlOnlineEndpointTrafficLog in the Log Analytics workspace, you can trace a request from the network entry point of an online endpoint to the container.
You can also use this log for performance analysis in determining the time required by the model to process each request.
AmlOnlineEndpointEventLog: Contains event information regarding the container's life cycle. Currently, we provide information on the following types of events:
Name Message BackOff Back-off restarting failed container Pulled Container image "<IMAGE_NAME>" already present on machine Killing Container inference-server failed liveness probe, will be restarted Created Created container image-fetcher Created Created container inference-server Created Created container model-mount LivenessProbeFailed Liveness probe failed: <FAILURE_CONTENT> ReadinessProbeFailed Readiness probe failed: <FAILURE_CONTENT> Started Started container image-fetcher Started Started container inference-server Started Started container model-mount Killing Stopping container inference-server Killing Stopping container model-mount
How to enable/disable logs
Important
Logging uses Azure Log Analytics. If you do not currently have a Log Analytics workspace, you can create one using the steps in Create a Log Analytics workspace in the Azure portal.
In the Azure portal, go to the resource group that contains your endpoint and then select the endpoint.
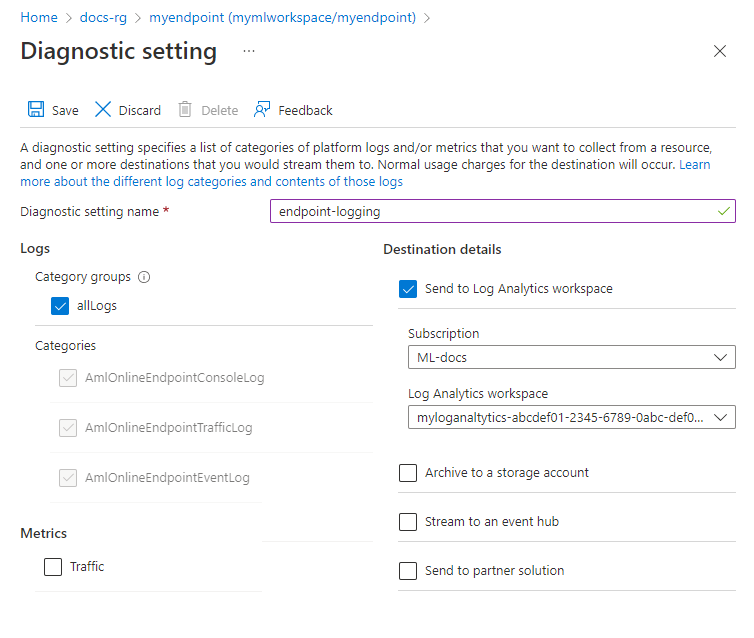
From the Monitoring section on the left of the page, select Diagnostic settings and then Add settings.
Select the log categories to enable, select Send to Log Analytics workspace, and then select the Log Analytics workspace to use. Finally, enter a Diagnostic setting name and select Save.
Important
It may take up to an hour for the connection to the Log Analytics workspace to be enabled. Wait an hour before continuing with the next steps.
Submit scoring requests to the endpoint. This activity should create entries in the logs.
From either the online endpoint properties or the Log Analytics workspace, select Logs from the left of the screen.
Close the Queries dialog that automatically opens, and then double-click the AmlOnlineEndpointConsoleLog. If you don't see it, use the Search field.
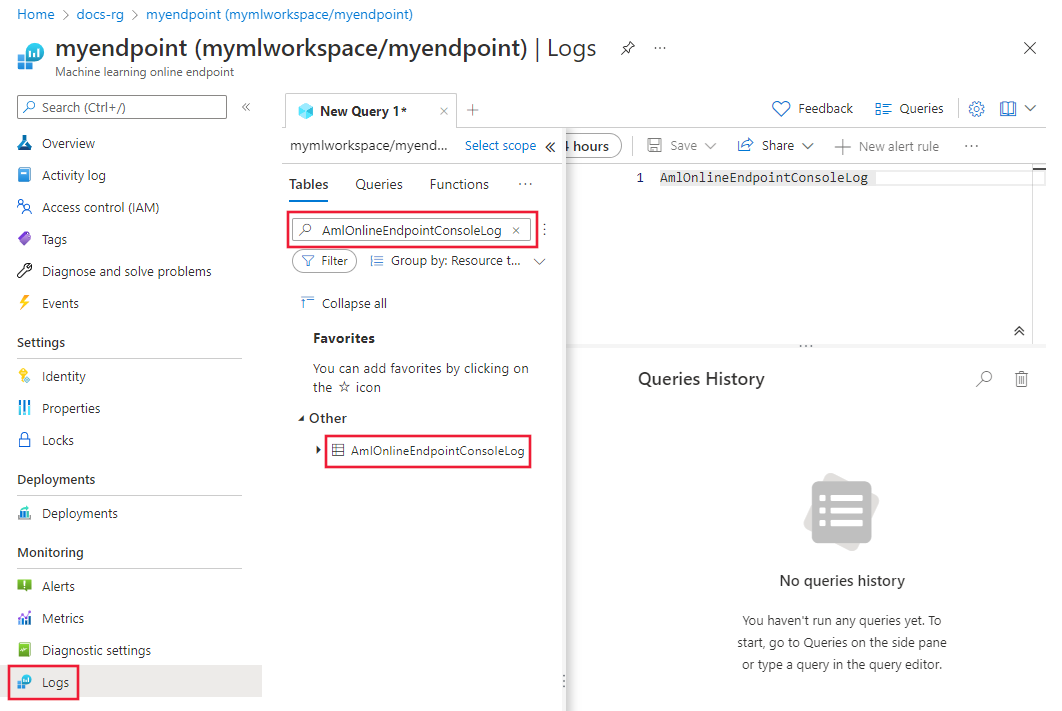
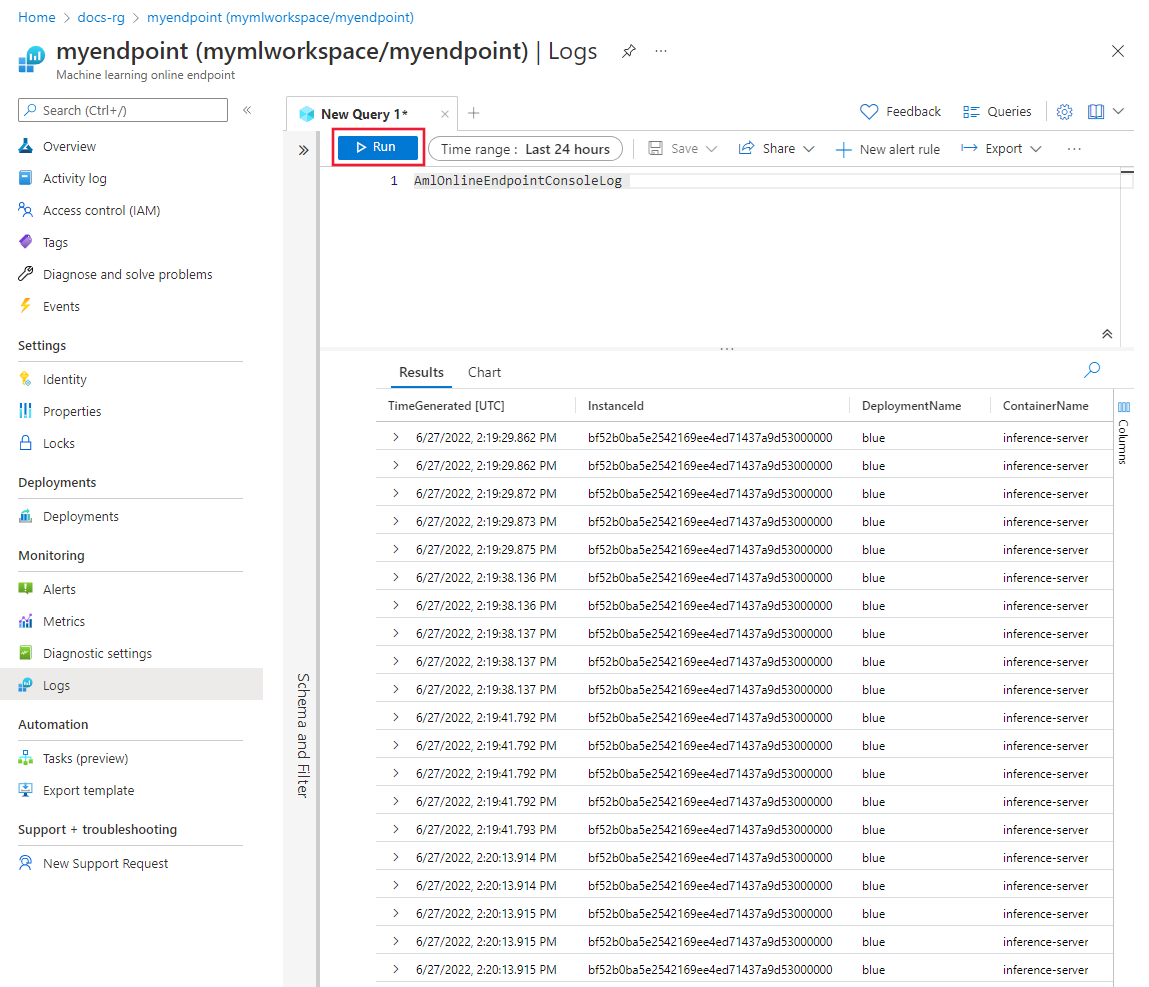
Select Run.
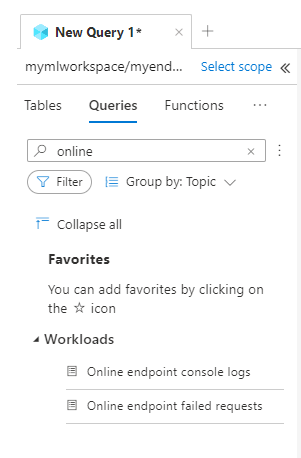
Example queries
You can find example queries on the Queries tab while viewing logs. Search for Online endpoint to find example queries.
Log column details
The following tables provide details on the data stored in each log:
AmlOnlineEndpointTrafficLog
| Property | Description |
|---|---|
| Method | The requested method from client. |
| Path | The requested path from client. |
| SubscriptionId | The machine learning subscription ID of the online endpoint. |
| AzureMLWorkspaceId | The machine learning workspace ID of the online endpoint. |
| AzureMLWorkspaceName | The machine learning workspace name of the online endpoint. |
| EndpointName | The name of the online endpoint. |
| DeploymentName | The name of the online deployment. |
| Protocol | The protocol of the request. |
| ResponseCode | The final response code returned to the client. |
| ResponseCodeReason | The final response code reason returned to the client. |
| ModelStatusCode | The response status code from model. |
| ModelStatusReason | The response status reason from model. |
| RequestPayloadSize | The total bytes received from the client. |
| ResponsePayloadSize | The total bytes sent back to the client. |
| UserAgent | The user-agent header of the request, including comments but truncated to a max of 70 characters. |
| XRequestId | The request ID generated by Azure Machine Learning for internal tracing. |
| XMSClientRequestId | The tracking ID generated by the client. |
| TotalDurationMs | Duration in milliseconds from the request start time to the last response byte sent back to the client. If the client disconnected, it measures from the start time to client disconnect time. |
| RequestDurationMs | Duration in milliseconds from the request start time to the last byte of the request received from the client. |
| ResponseDurationMs | Duration in milliseconds from the request start time to the first response byte read from the model. |
| RequestThrottlingDelayMs | Delay in milliseconds in request data transfer due to network throttling. |
| ResponseThrottlingDelayMs | Delay in milliseconds in response data transfer due to network throttling. |
AmlOnlineEndpointConsoleLog
| Property | Description |
|---|---|
| TimeGenerated | The timestamp (UTC) of when the log was generated. |
| OperationName | The operation associated with log record. |
| InstanceId | The ID of the instance that generated this log record. |
| DeploymentName | The name of the deployment associated with the log record. |
| ContainerName | The name of the container where the log was generated. |
| Message | The content of the log. |
AmlOnlineEndpointEventLog
| Property | Description |
|---|---|
| TimeGenerated | The timestamp (UTC) of when the log was generated. |
| OperationName | The operation associated with log record. |
| InstanceId | The ID of the instance that generated this log record. |
| DeploymentName | The name of the deployment associated with the log record. |
| Name | The name of the event. |
| Message | The content of the event. |
Using Application Insights
Curated environments include integration with Application Insights, and you can enable or disable this integration when you create an online deployment. Built-in metrics and logs are sent to Application Insights, and you can use the built-in features of Application Insights (such as Live metrics, Transaction search, Failures, and Performance) for further analysis.
See Application Insights overview for more.
In the studio, you can use the Monitoring tab on an online endpoint's page to see high-level activity monitor graphs for the managed online endpoint. To use the monitoring tab, you must select Enable Application Insight diagnostic and data collection when you create your endpoint.

Related content
- Learn how to view costs for your deployed endpoint.
- Read more about metrics explorer.
Aiseolas
Ag teacht go luath: Le linn 2024 beimid ag cur deireadh de réir a chéile le fadhbanna GitHub mar mheicníocht aiseolais d’inneachar agus córas aiseolais nua a chur ina áit. Chun tuilleadh faisnéise a fháil féach ar :https://aka.ms/ContentUserFeedback.
Cuir isteach agus féach ar aiseolas le haghaidh