Service Fabric Linux cluster events in Syslog
Service Fabric exposes a set of platform events to inform you of important activity in your cluster. The full list of events that are exposed is available here. There are various ways through which these events can be consumed. In this article, we discuss how to configure Service Fabric to write these events to Syslog.
Introduction
In the 6.4 release, the SyslogConsumer was introduced to send the Service Fabric platform events to Syslog for Linux clusters. Once turned on, events automatically flow to Syslog which can be collected and sent by the Log Analytics Agent.
Each Syslog event has four components
- Facility
- Identity
- Message
- Severity
The SyslogConsumer writes all platform events using Facility Local0. You can update to any valid facility by changing the config. The Identity used is ServiceFabric. The Message field contains the whole event serialized in JSON so that it can be queried and consumed by various tools.
Enable SyslogConsumer
To enable the SyslogConsumer, you need to perform an upgrade of your cluster. The fabricSettings section needs to be updated with the following code. Note this code just includes sections related to SyslogConsumer
    "fabricSettings": [
        {
            "name": "Diagnostics",
            "parameters": [
            {
                "name": "ConsumerInstances",
                "value": "AzureWinFabCsv, AzureWinFabCrashDump, AzureTableWinFabEtwQueryable, SyslogConsumer"
            }
            ]
        },
        {
            "name": "SyslogConsumer",
            "parameters": [
            {
                "name": "ProducerInstance",
                "value": "WinFabLttProducer"
            },
            {
            "name": "ConsumerType",
            "value": "SyslogConsumer"
            },
            {
                "name": "IsEnabled",
                "value": "true"
            }
            ]
        },
        {
            "name": "Common",
            "parameters": [
            {
                "name": "LinuxStructuredTracesEnabled",
                "value": "true"
            }
            ]
        }
    ],
Here are the changes to call out
- In the Common section, there's a new parameter called
LinuxStructuredTracesEnabled. This is required to have Linux events structured and serialized when sent to Syslog. - In the Diagnostics section, a new ConsumerInstance: SyslogConsumer was added. This tells the platform that there's another consumer of the events.
- The new section SyslogConsumer needs to have
IsEnabledastrue. It's configured to use the Local0 facility automatically. You can override this by adding another parameter.
    {
        "name": "New LogFacility",
        "value": "<Valid Syslog Facility>"
    }
Azure Monitor logs integration
You can read these Syslog events in a monitoring tool such as Azure Monitor logs. You can create a Log Analytics workspace by using the Azure Marketplace using these instructions.
You also need to add the Log Analytics agent to your cluster to collect and send this data to the workspace. This is the same agent used to collect performance counters.
Navigate to the
Advanced Settingssection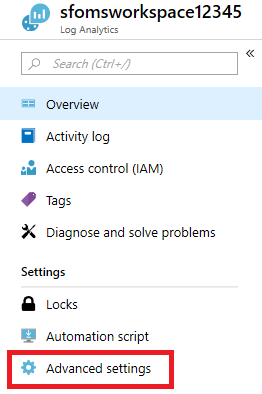
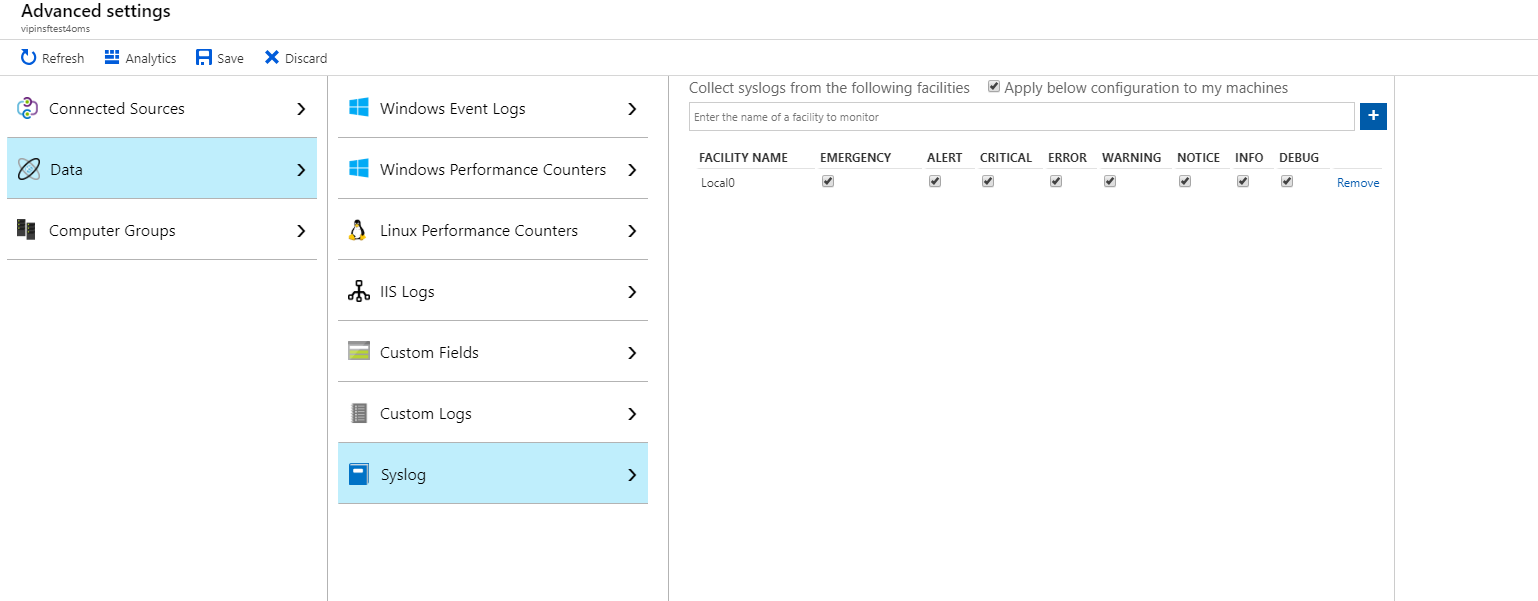
Select
DataSelect
SyslogConfigure Local0 as the Facility to track. You can add another Facility if you changed it in fabricSettings
Head over to the query explorer by clicking
Logsin the workspace resource's menu to start querying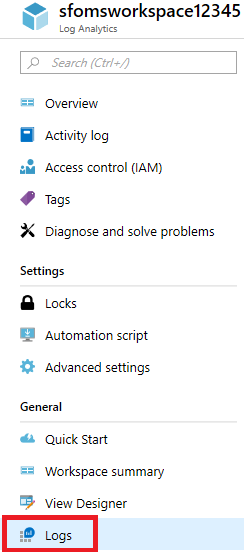
You can query against the
Syslogtable looking forServiceFabricas the ProcessName. The following query is an example of how to parse the JSON in the event and display its contents
Syslog | where ProcessName == "ServiceFabric" | extend $payload = parse_json(SyslogMessage) | project $payload
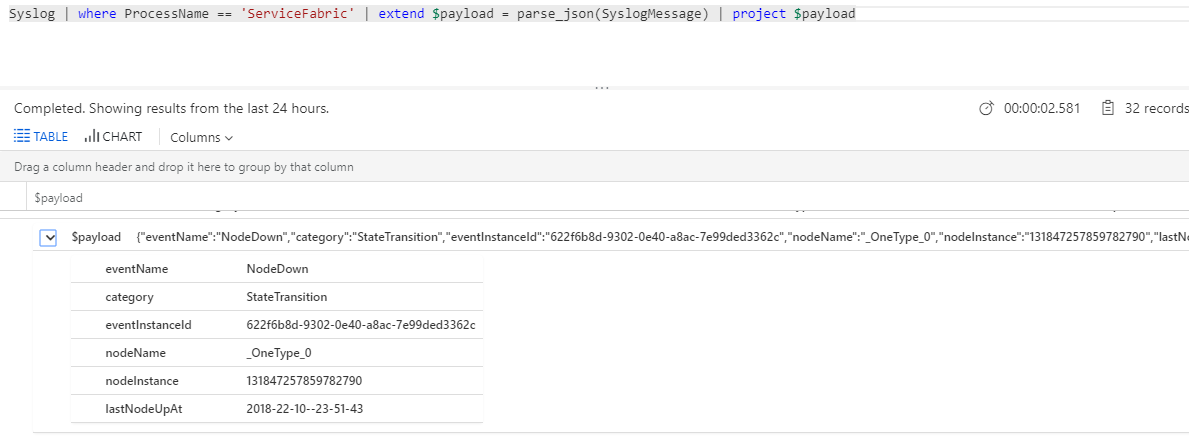
The example above is of a NodeDown event. You can view the full list of events here.
Next steps
- Deploy the Log Analytics agent onto your nodes to gather performance counters and collect docker stats and logs for your containers
- Get familiarized with the log search and querying features offered as part of Azure Monitor logs
- Use View Designer to create custom views in Azure Monitor logs
- Reference for how to Azure Monitor logs integration with Syslog.
Aiseolas
Ag teacht go luath: Le linn 2024 beimid ag cur deireadh de réir a chéile le fadhbanna GitHub mar mheicníocht aiseolais d’inneachar agus córas aiseolais nua a chur ina áit. Chun tuilleadh faisnéise a fháil féach ar :https://aka.ms/ContentUserFeedback.
Cuir isteach agus féach ar aiseolas le haghaidh