Log Analytics tutorial
Log Analytics is a tool in the Azure portal to edit and run log queries from data collected by Azure Monitor logs and interactively analyze their results. You can use Log Analytics queries to retrieve records that match particular criteria, identify trends, analyze patterns, and provide various insights into your data.
This tutorial walks you through the Log Analytics interface, gets you started with some basic queries, and shows you how you can work with the results. You learn how to:
- Understand the log data schema.
- Write and run simple queries, and modify the time range for queries.
- Filter, sort, and group query results.
- View, modify, and share visuals of query results.
- Load, export, and copy queries and results.
Important
In this tutorial, you use Log Analytics features to build one query and use another example query. When you're ready to learn the syntax of queries and start directly editing the query itself, read the Kusto Query Language tutorial. That tutorial walks you through example queries that you can edit and run in Log Analytics. It uses several of the features that you learn in this tutorial.
Prerequisites
This tutorial uses the Log Analytics demo environment, which includes plenty of sample data that supports the sample queries. You can also use your own Azure subscription, but you might not have data in the same tables.
Note
Log Analytics has two modes - Simple and KQL. This tutorial walks you through KQL mode. For information on Simple mode, see Analyze data using Log Analytics Simple mode.
Open Log Analytics
Open the Log Analytics demo environment, or select Logs from the Azure Monitor menu in your subscription. This step sets the initial scope to a Log Analytics workspace so that your query selects from all data in that workspace. If you select Logs from an Azure resource's menu, the scope is set to only records from that resource. For details about the scope, see Log query scope.
You can view the scope in the upper-left corner of the Logs experience, below the name of your active query tab. If you're using your own environment, you see an option to select a different scope. This option isn't available in the demo environment.
View table information
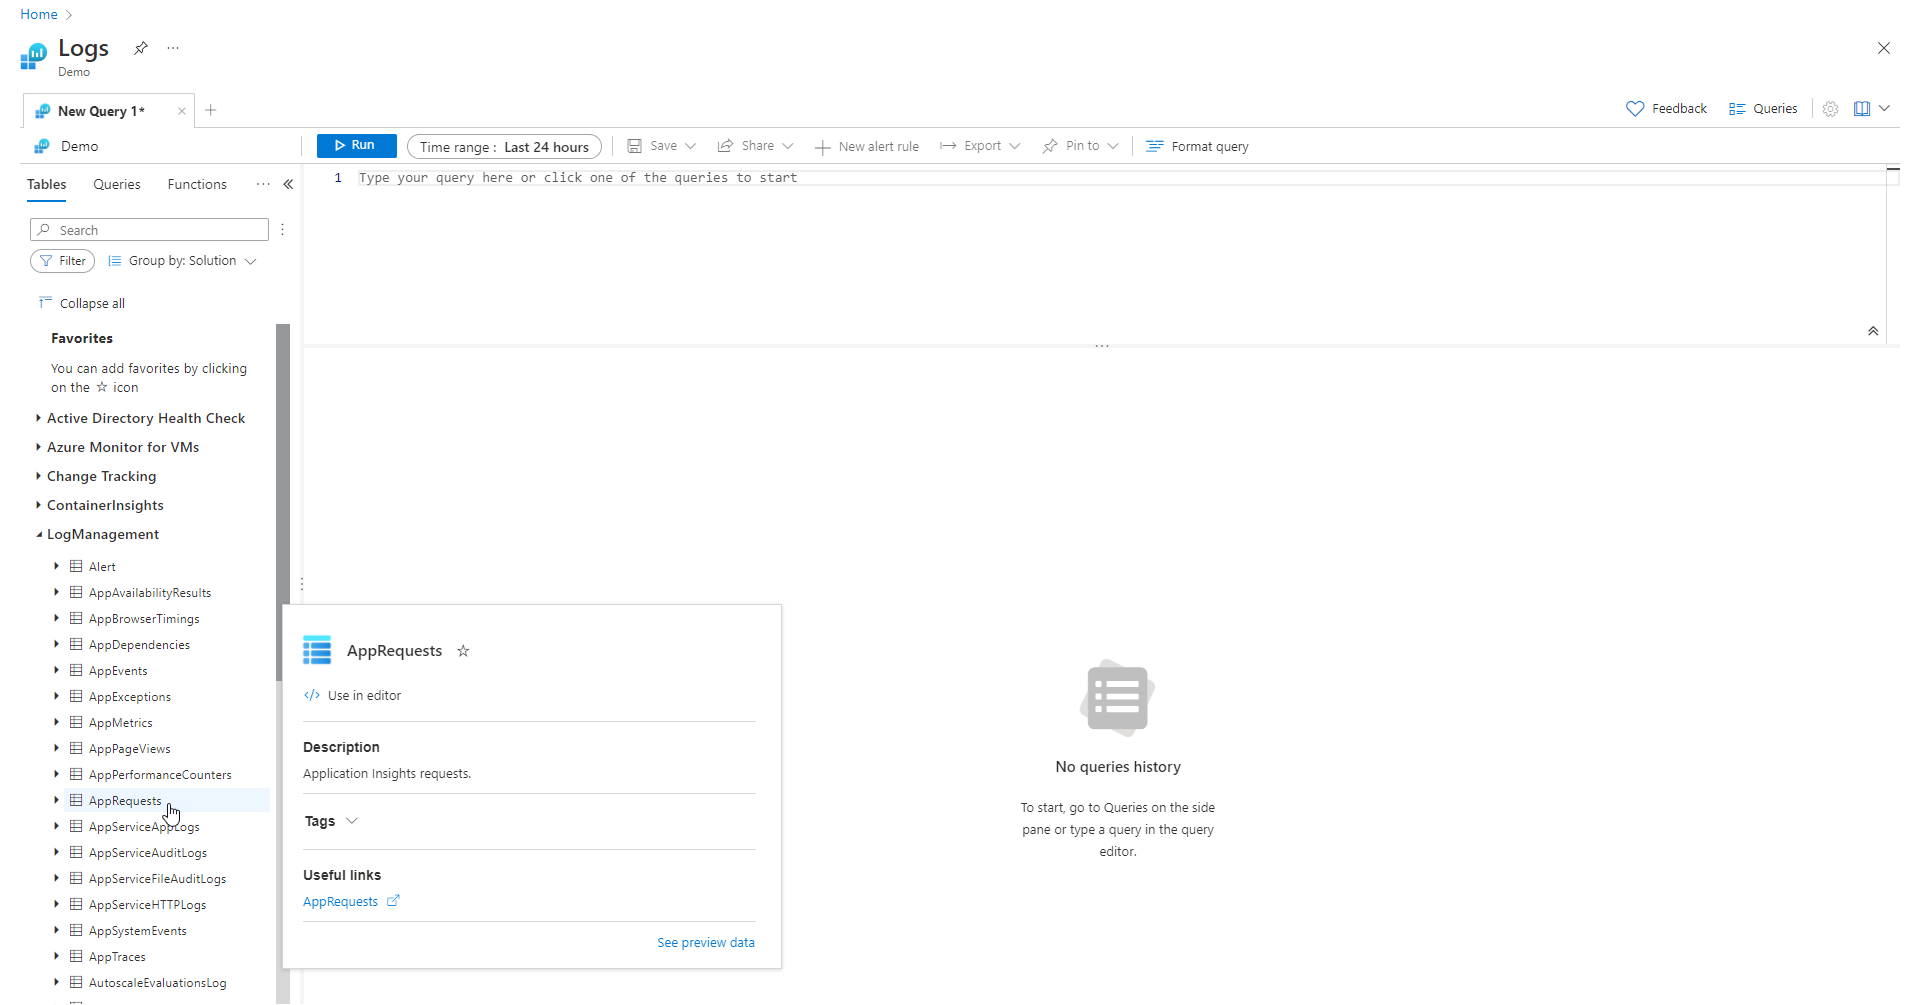
The left side of the screen includes the Tables tab, where you can inspect the tables that are available in the current scope. These tables are grouped by Solution by default, but you can change their grouping or filter them.
Expand the Log Management solution and locate the AppRequests table. You can expand the table to view its schema, or hover over its name to show more information about it.
Select the link below Useful links (in this example AppRequests) to go to the table reference that documents each table and its columns.
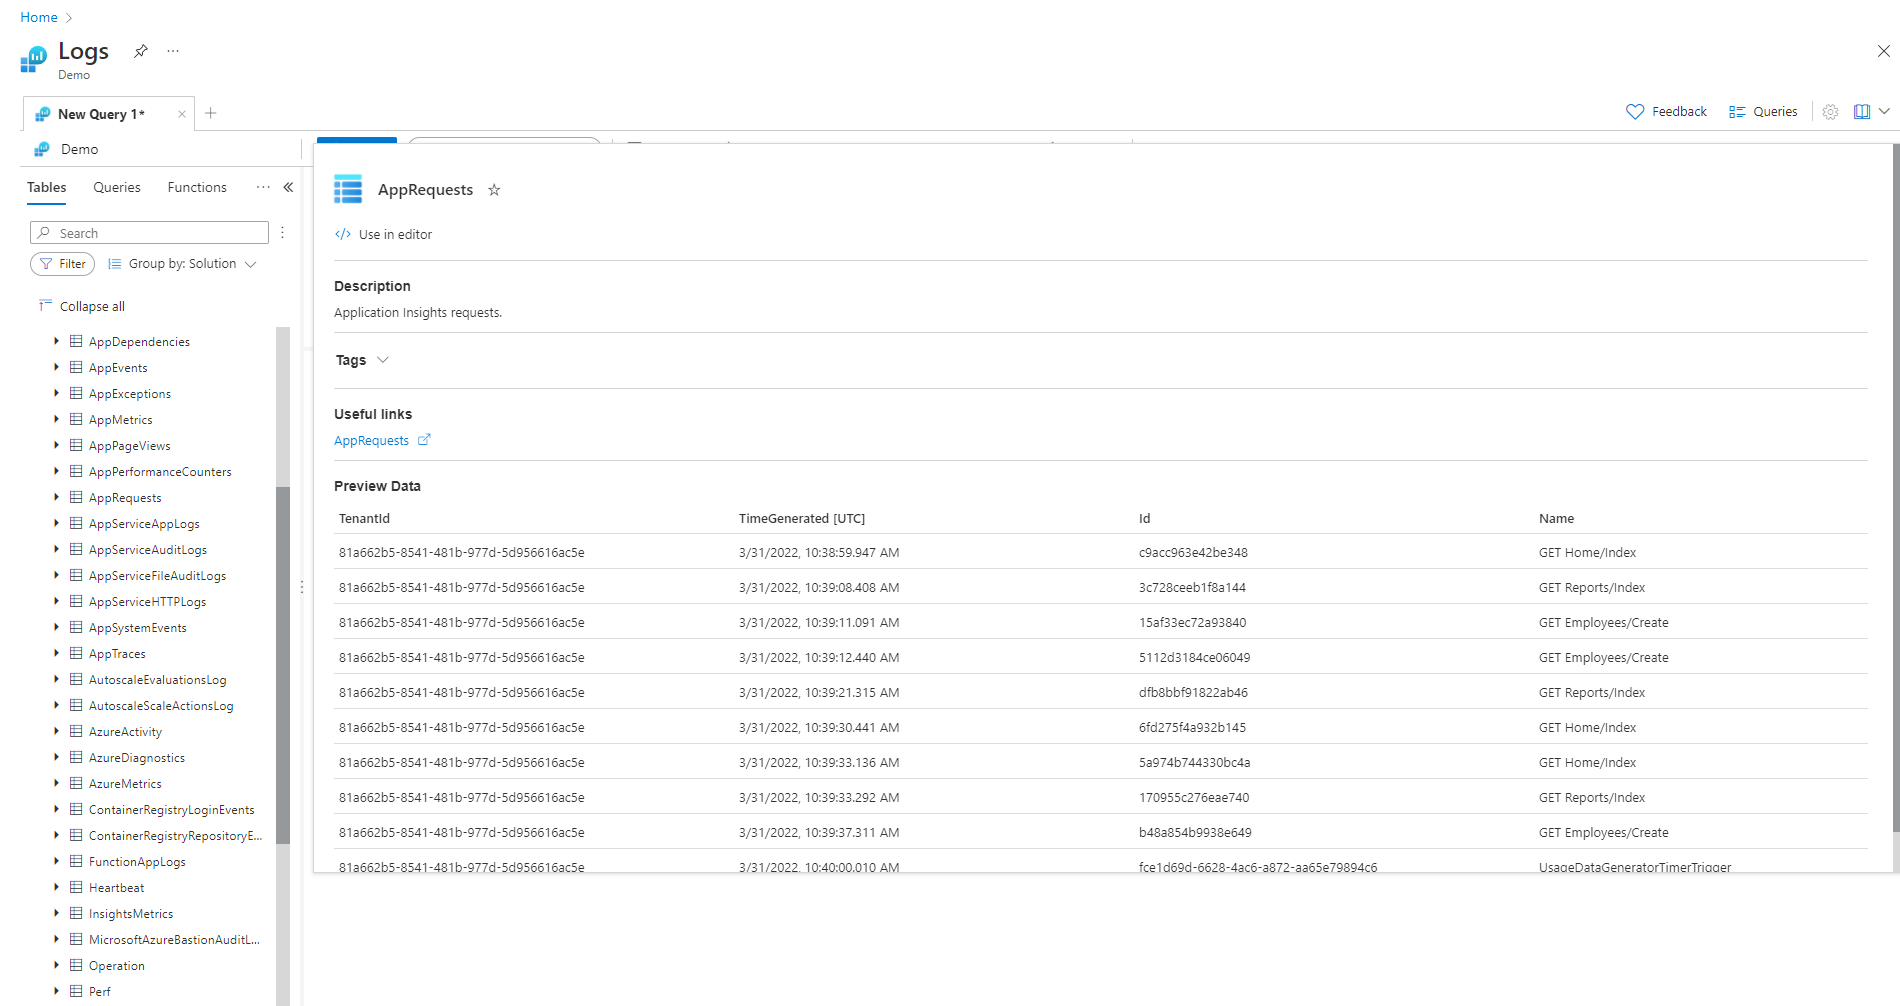
Select Preview data to have a quick look at a few recent records in the table. This preview can be useful to ensure it's the data you're expecting before you run a query with it.
Write a query
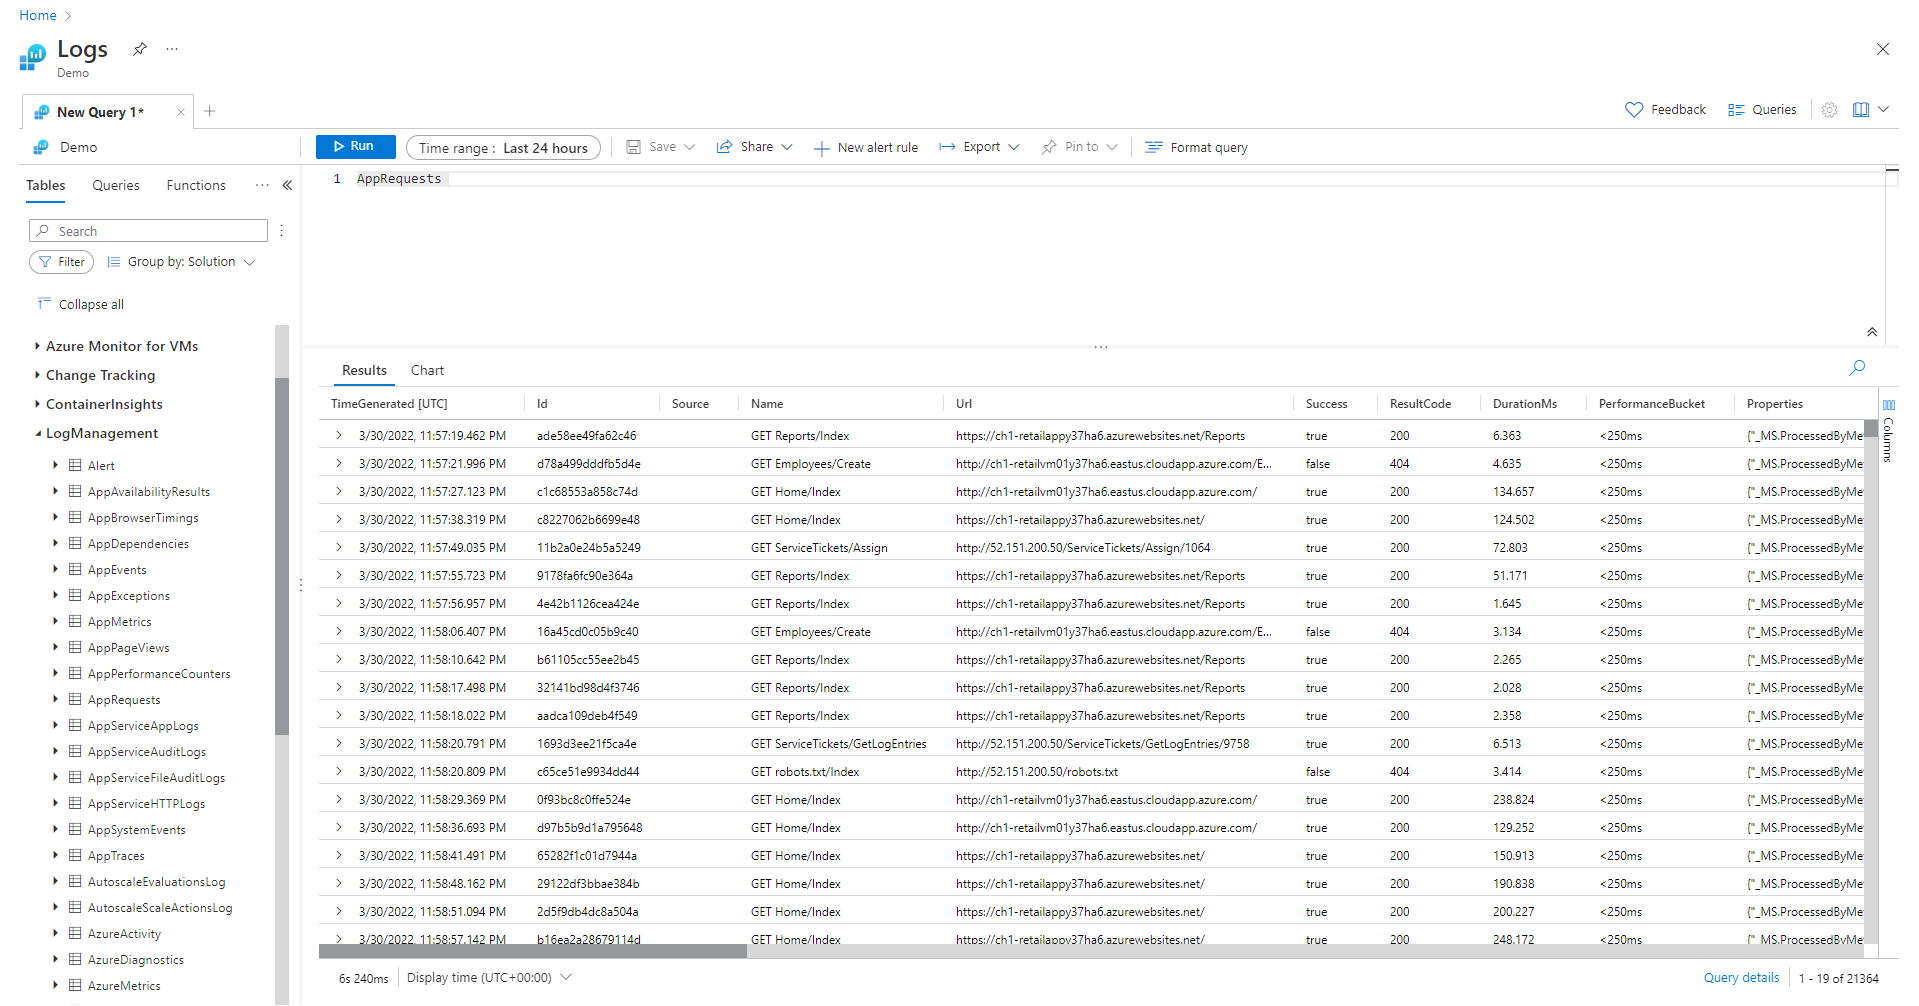
Let's write a query by using the AppRequests table. Double-click its name or hover over it and click on Use in editor to add it to the query window. You can also type directly in the window. You can even get IntelliSense which helps completing the names of tables in the current scope and Kusto Query Language (KQL) commands.
This is the simplest query that we can write. It just returns all the records in a table. Run it by selecting the Run button or by selecting Shift+Enter with the cursor positioned anywhere in the query text.
You can see that we do have results. The number of records that the query returns appears in the lower-right corner. The maximum number of results that you can retrieve in the Log Analytics portal experience is 30,000.
Time range
All queries return records generated within a set time range. By default, the query returns records generated in the last 24 hours.
You can set a different time range by using the where operator in the query. You can also use the Time range dropdown list at the top of the screen.
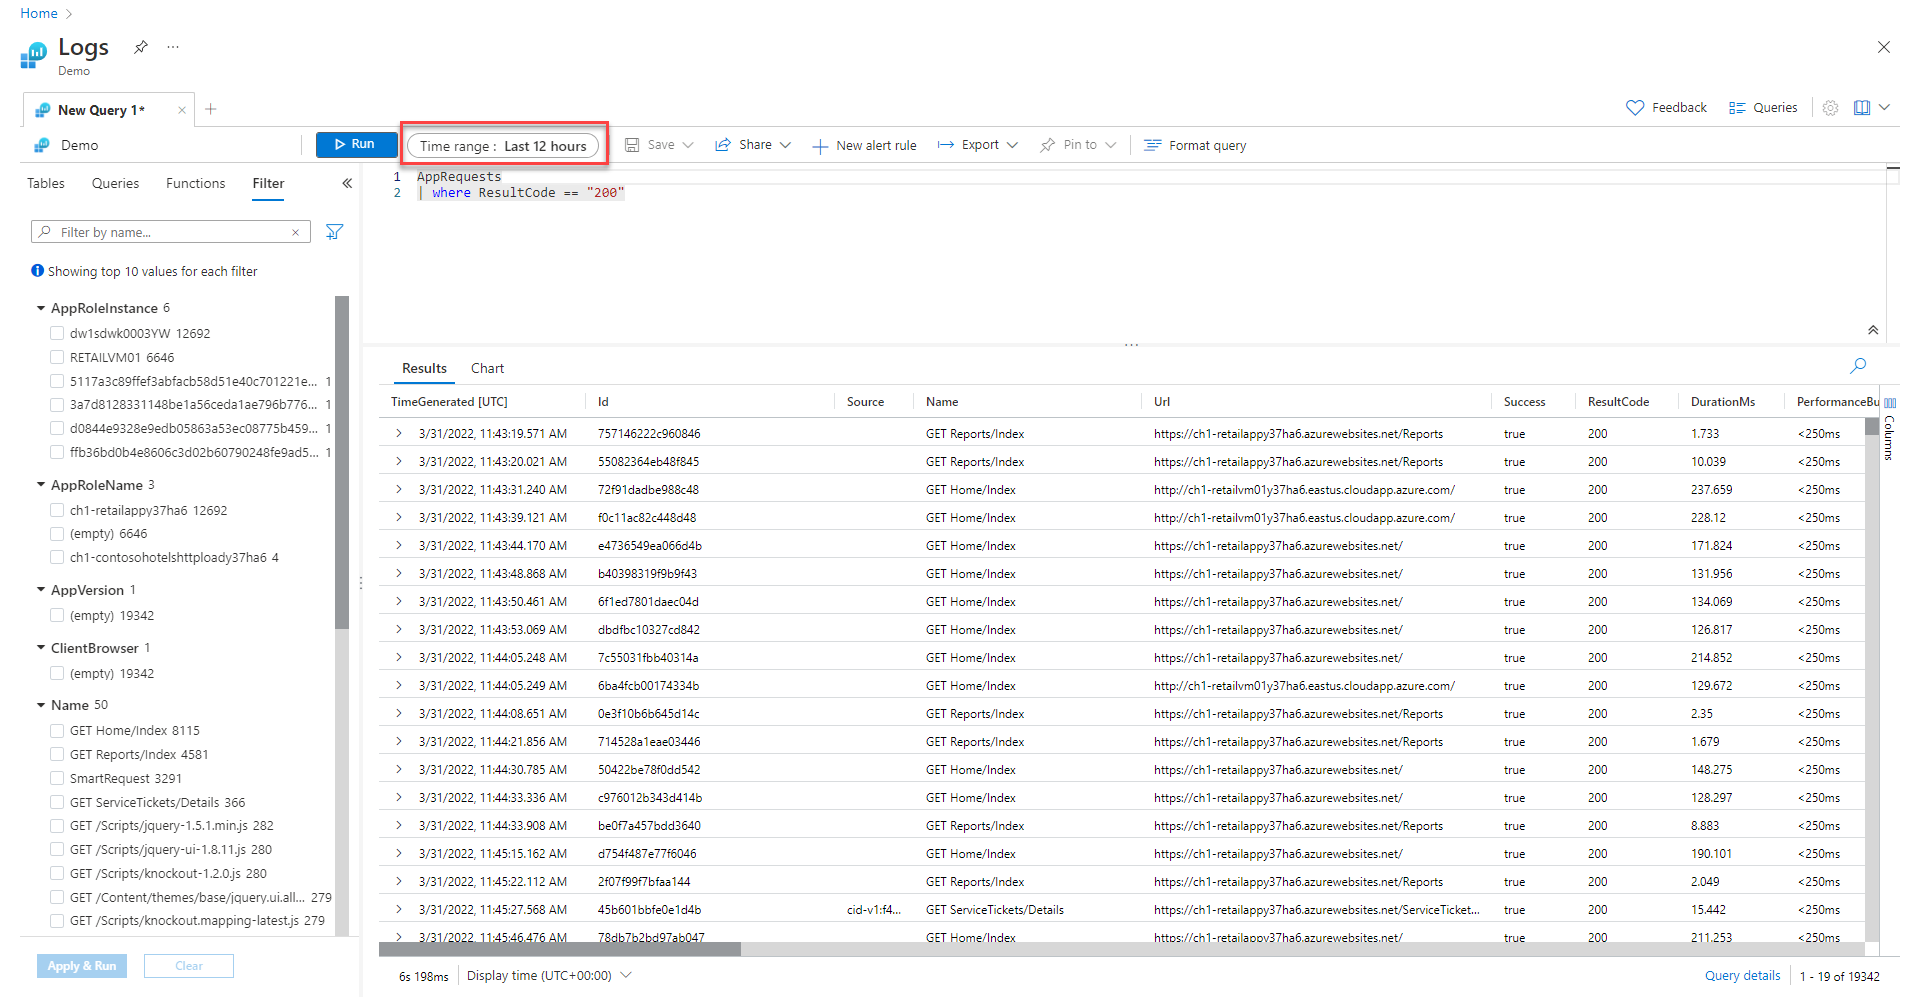
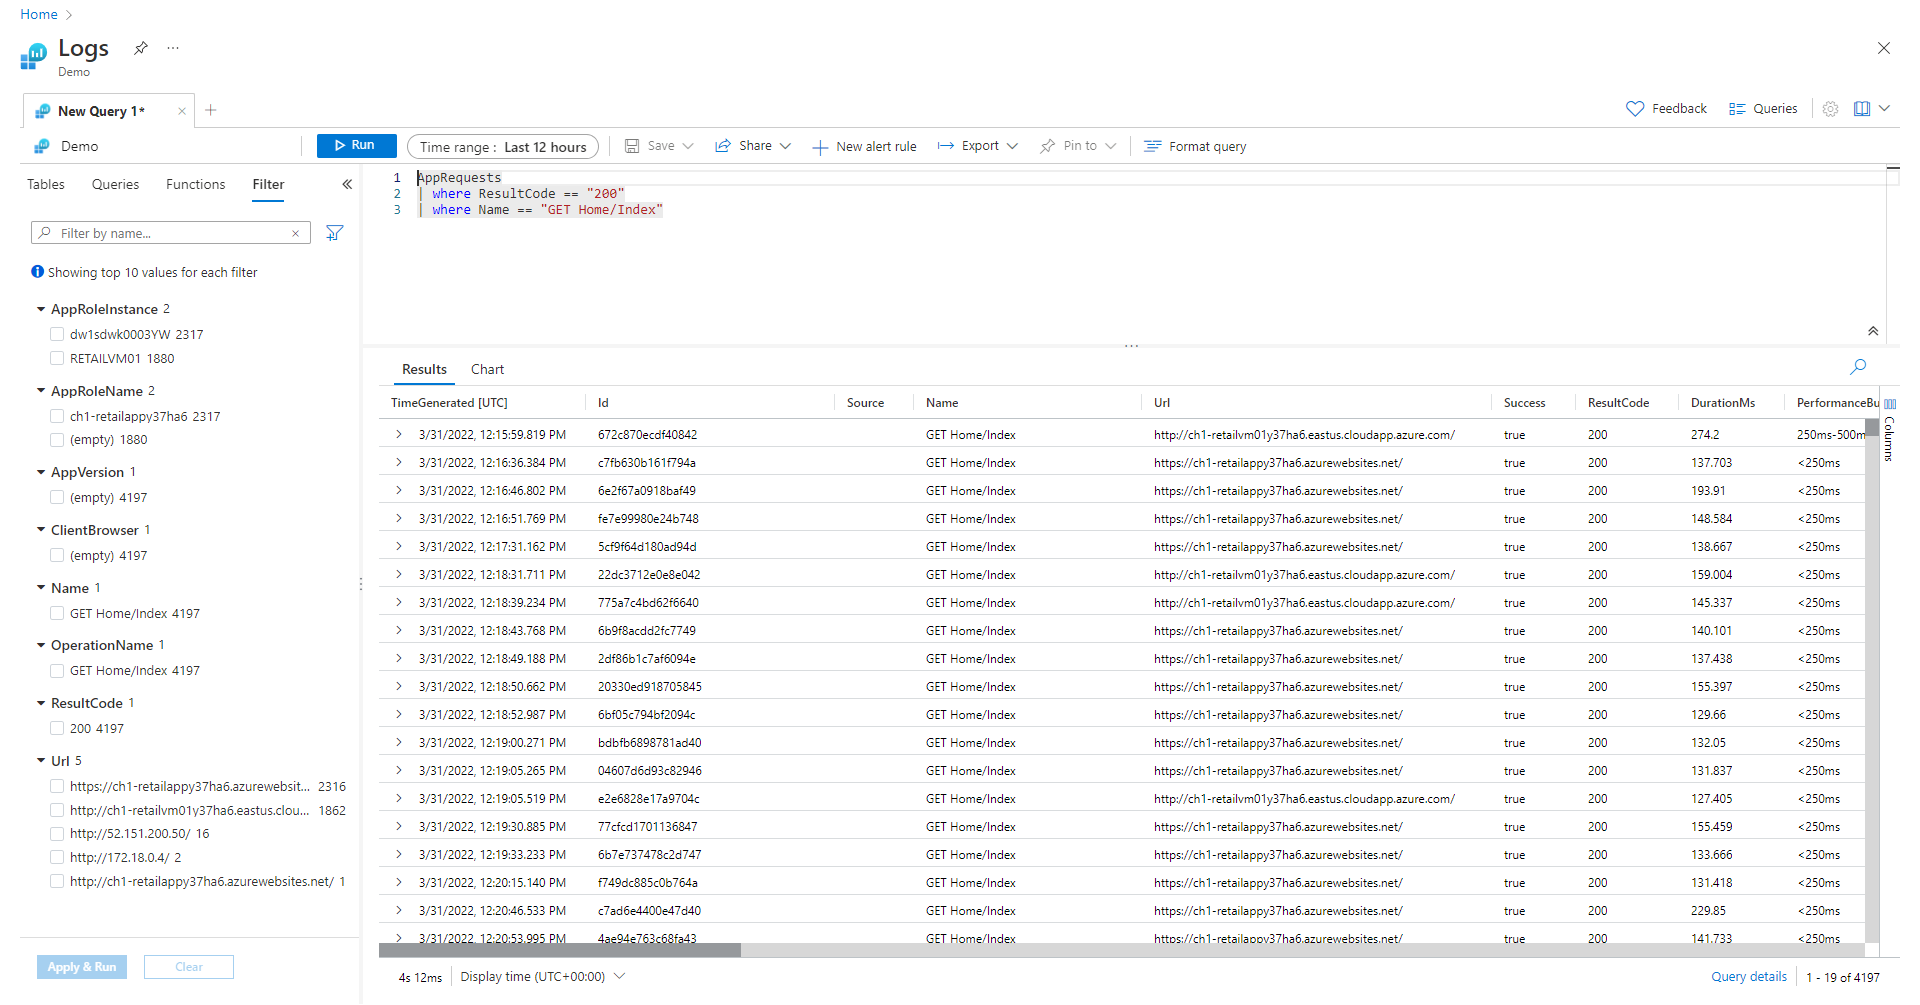
Let's change the time range of the query by selecting Last 12 hours from the Time range dropdown. Select Run to return the results.
Note
Changing the time range by using the Time range dropdown doesn't change the query in the query editor.
Multiple filters
Let's reduce our results further by adding another filter condition. A query can include any number of filters to target exactly the set of records that you want. On the left side of the screen where the Tables tab is active, select the Filter tab instead. If you can't find it, click on the ellipsis to view more tabs.
On the Filter tab, select Load old filters to view the top 10 values for each filter.
Select Get Home/Index under Name, then click on Apply & Run.
Analyze results
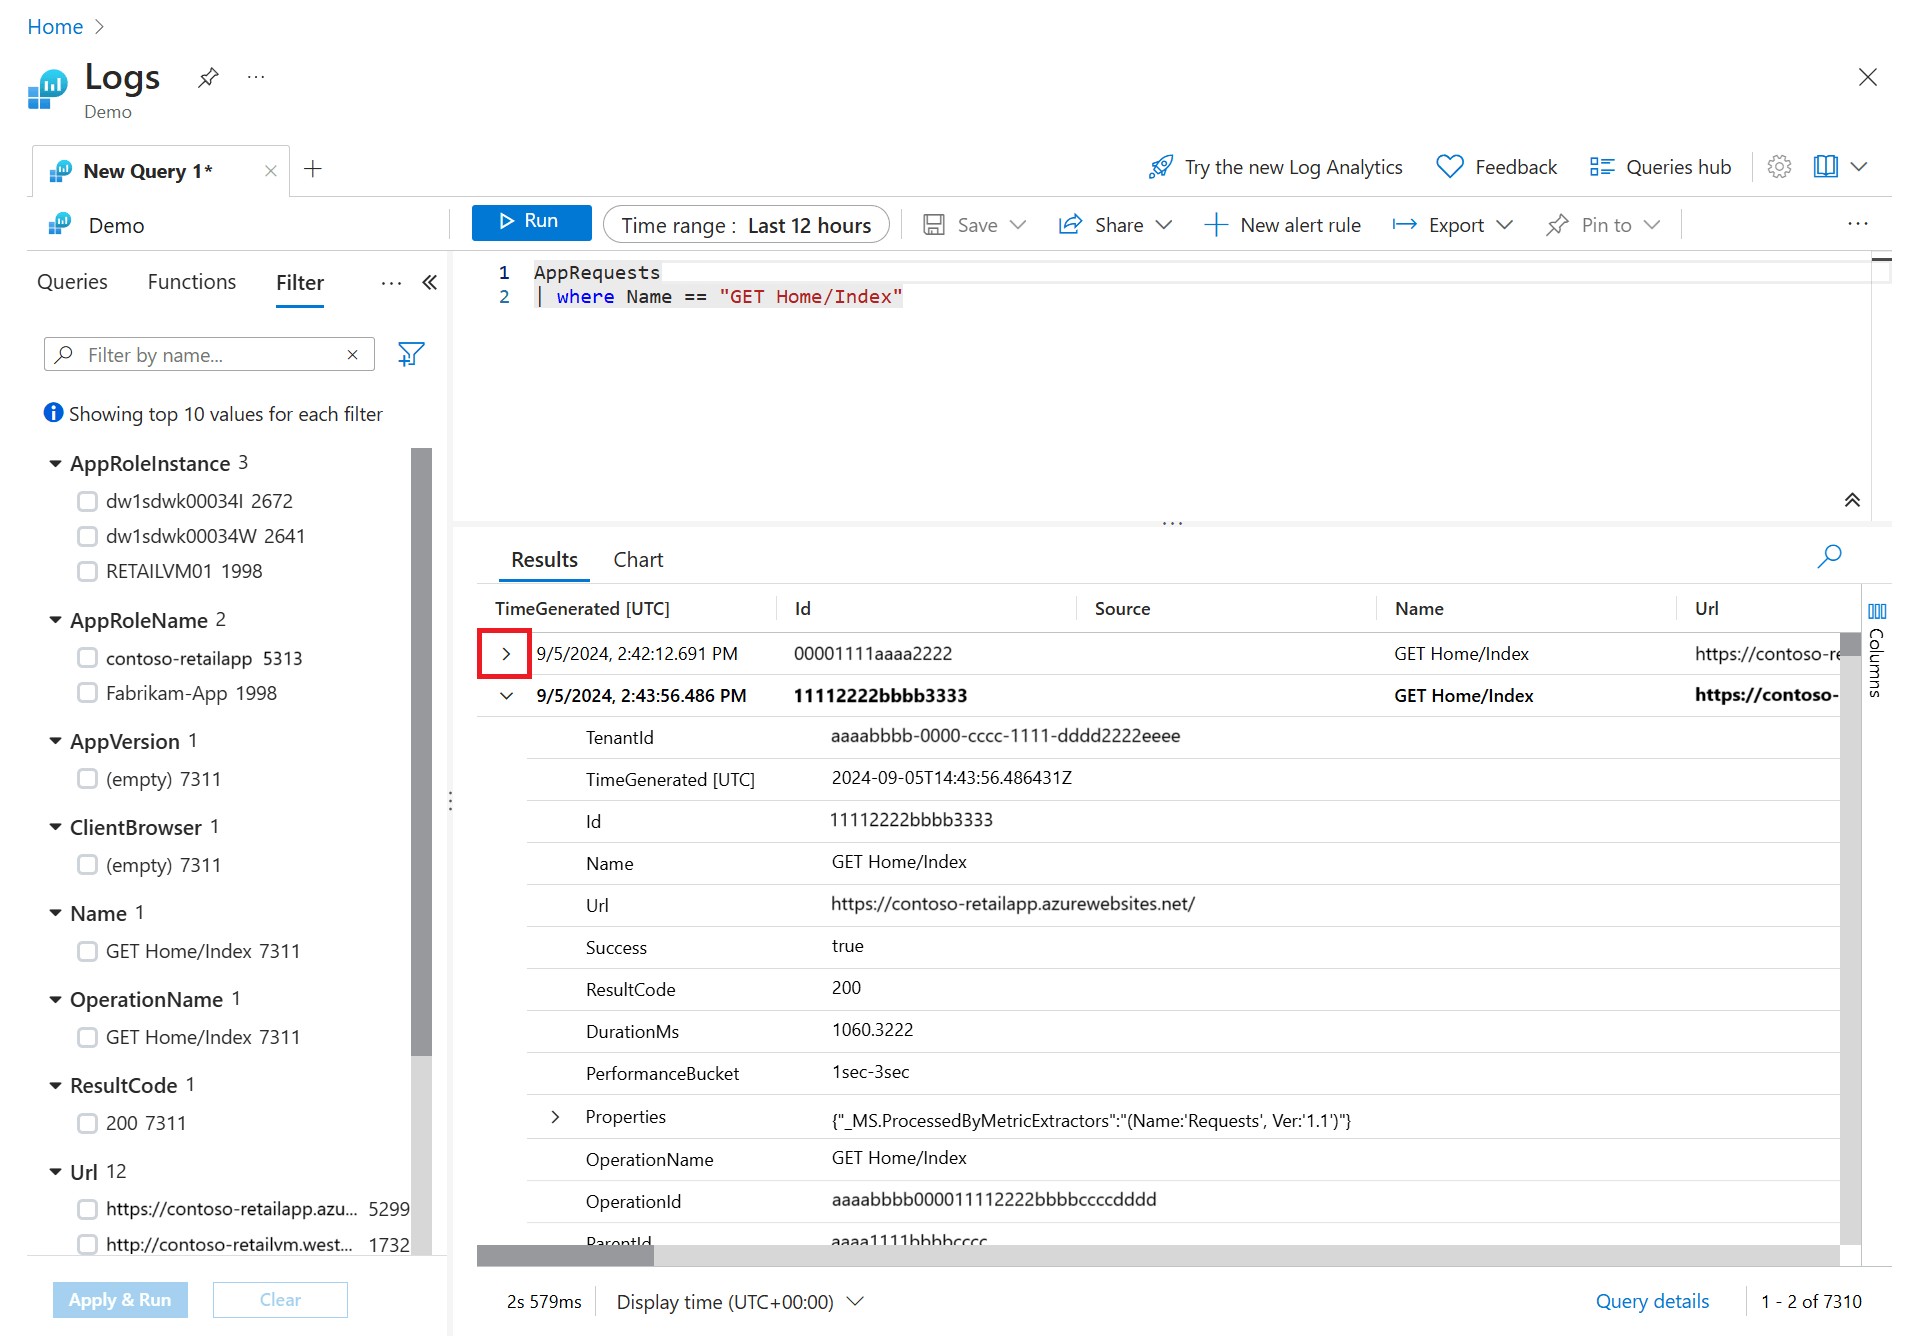
In addition to helping you write and run queries, Log Analytics provides features for working with the results. Start by expanding a record to view the values for all of its columns by clicking the chevron on the left side of the row.
Select the name of any column to sort the results by that column. Select the filter icon next to it to provide a filter condition. This action is similar to adding a filter condition to the query itself, except that this filter is cleared if the query is run again. Use this method if you want to quickly analyze a set of records as part of interactive analysis.
Set a filter on the DurationMs column to limit the records to those that took more than 150 milliseconds.
- The results table allows you to filter just like in Excel. Select the ellipsis in the Name column header.
- Uncheck Select All, then search for Get Home/Index and check it. Filters are automatically applied to your results.
Search through query results
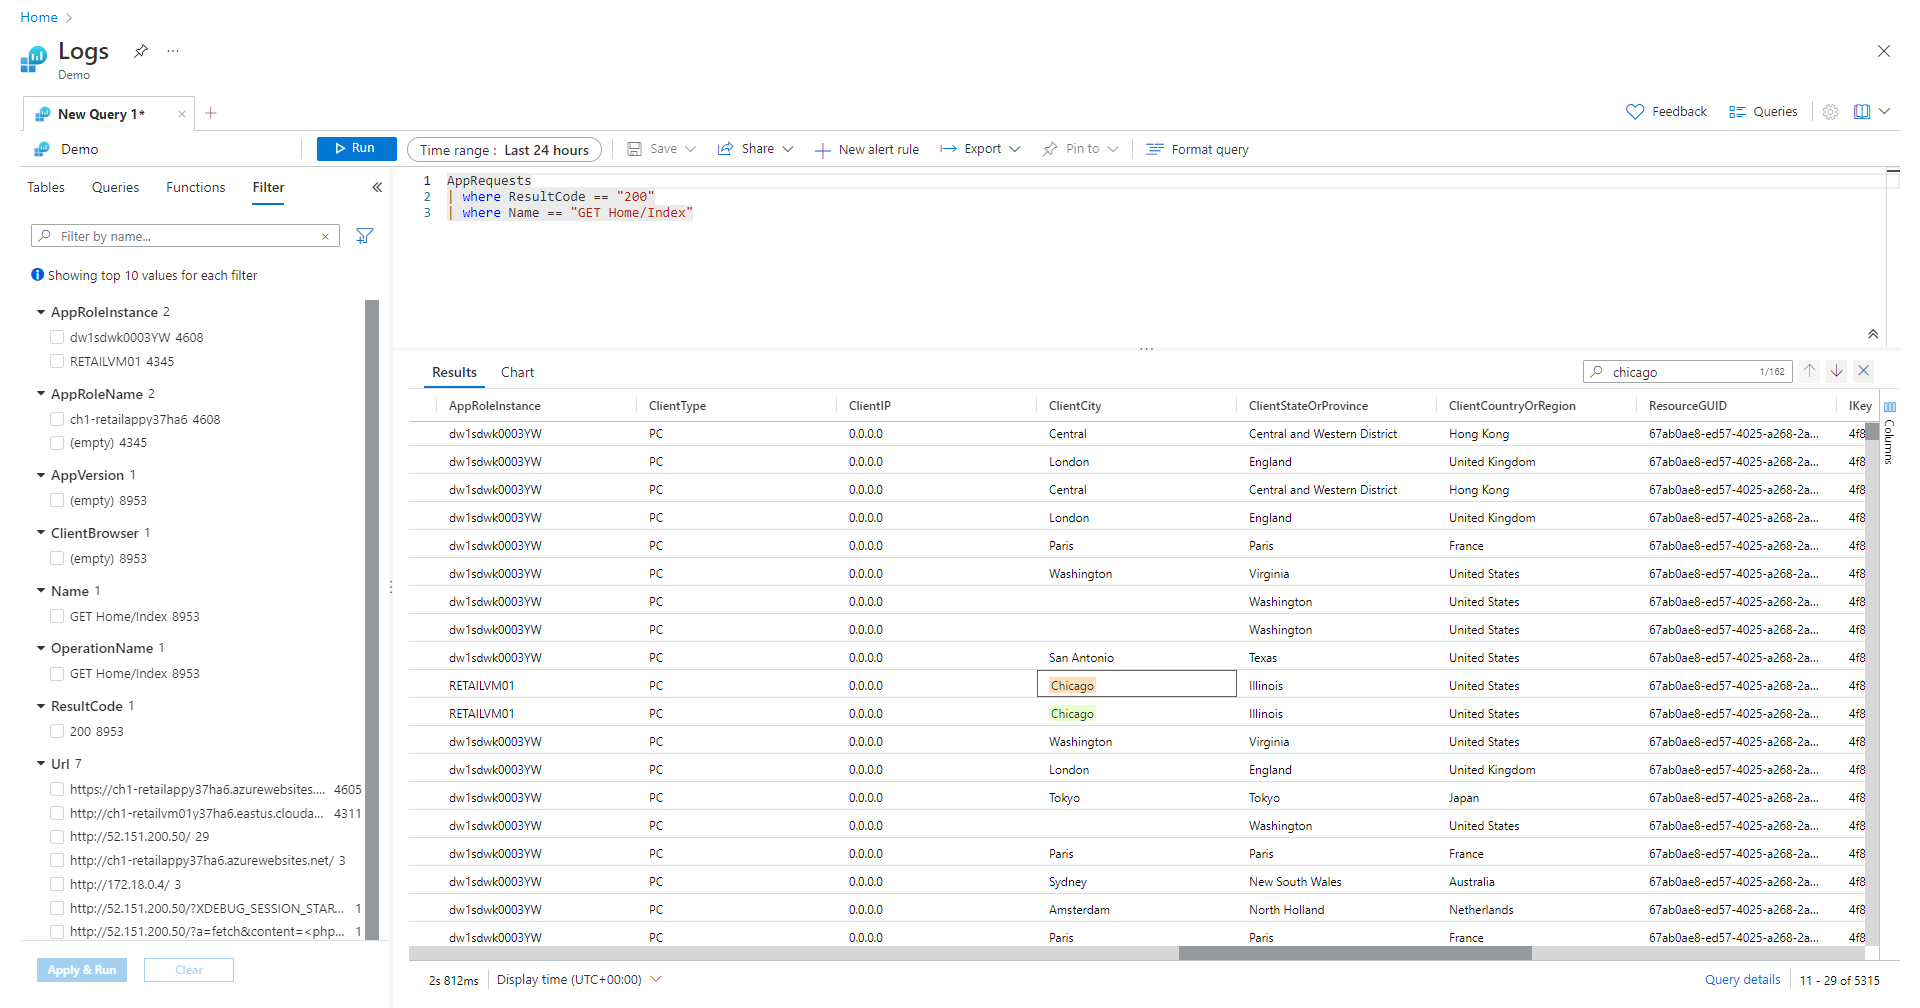
Let's search through the query results by using the search box at the top right of the results pane.
Enter Chicago in the query results search box, and select the arrows to find all instances of this string in your search results.
Reorganize and summarize data
To better visualize your data, you can reorganize and summarize the data in the query results based on your needs.
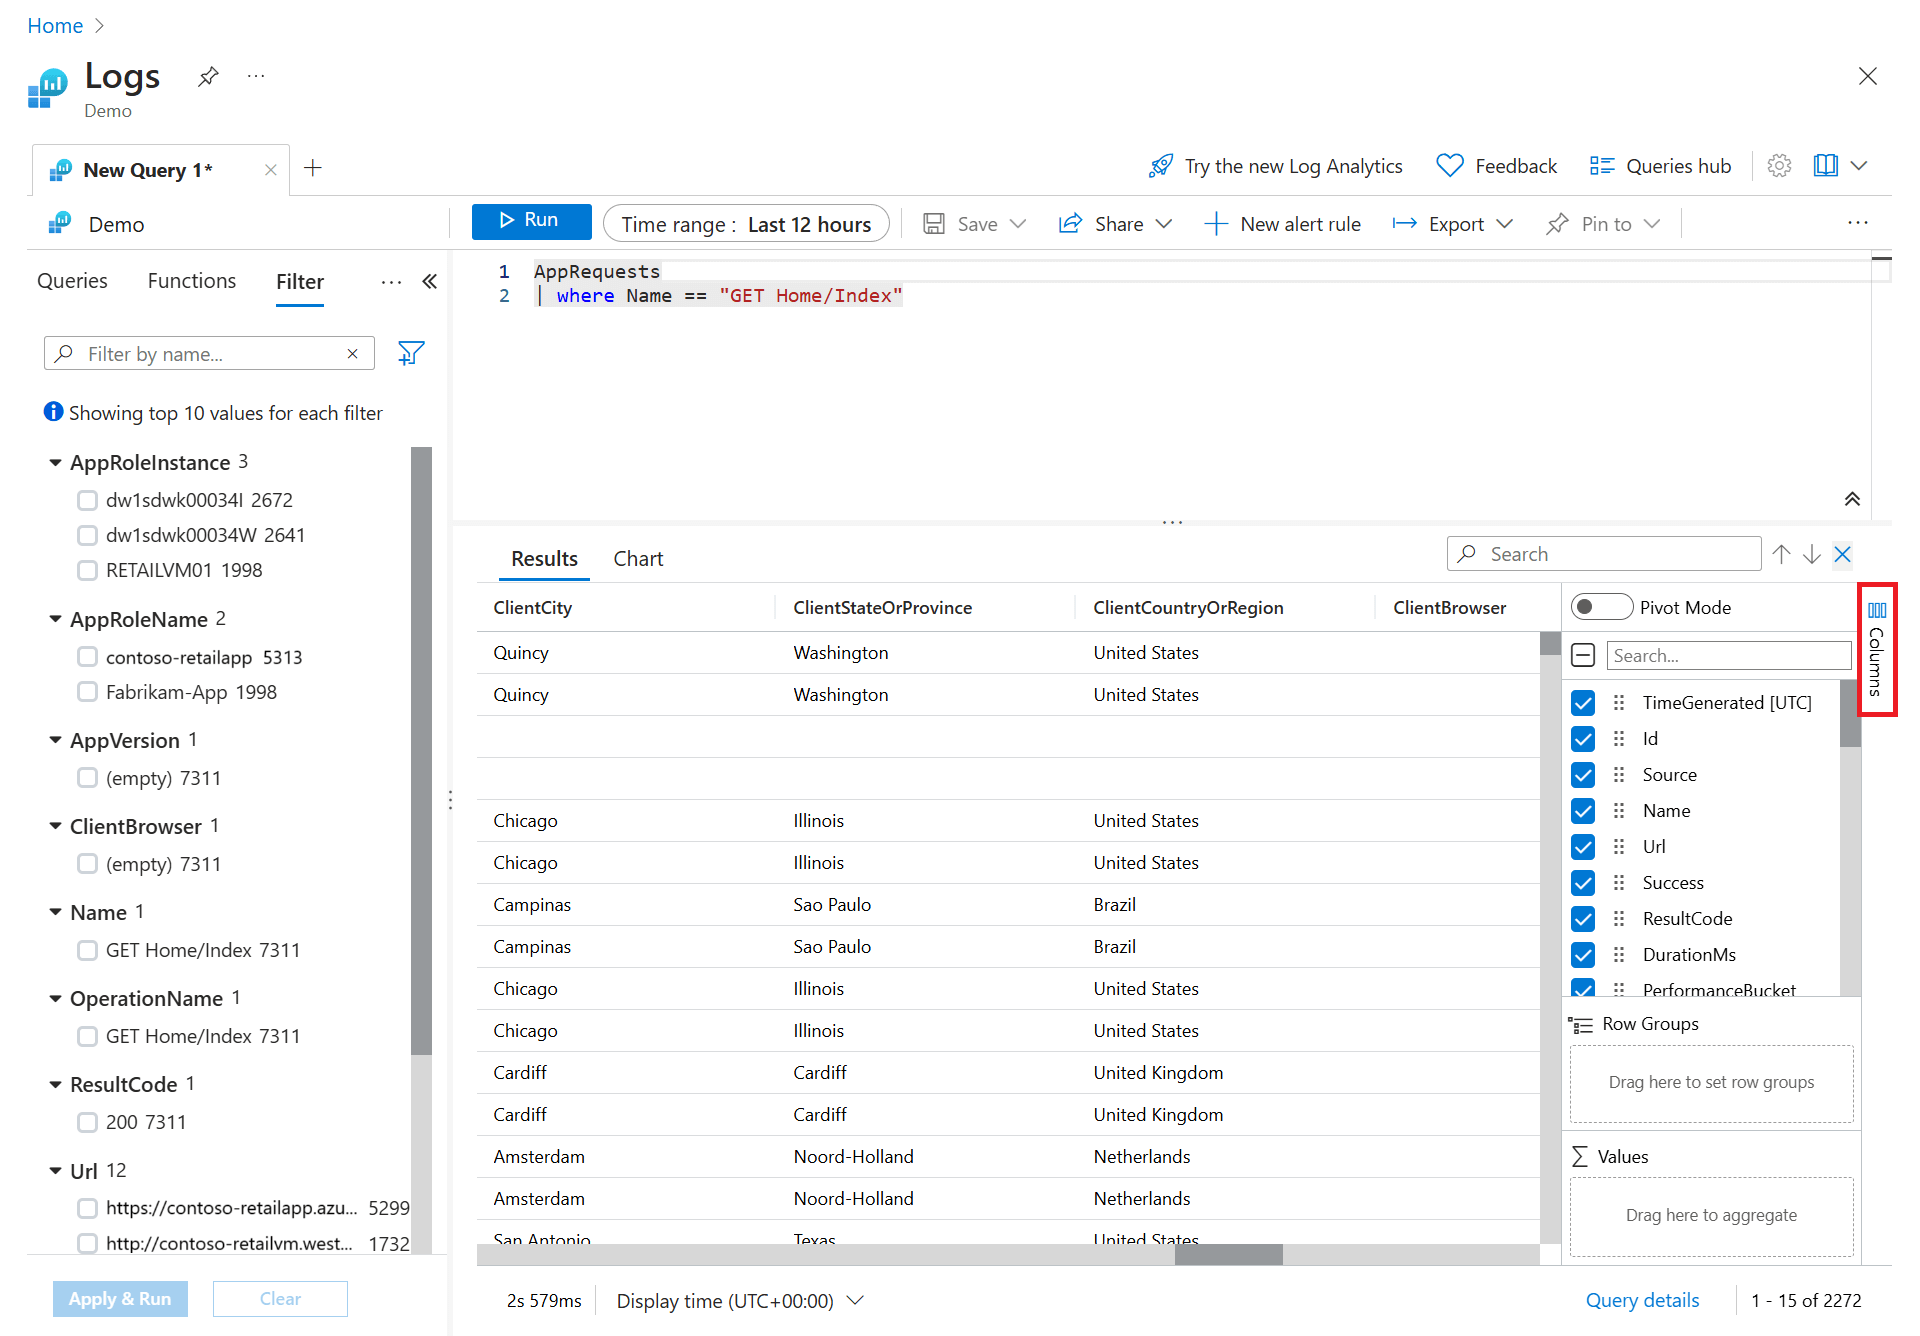
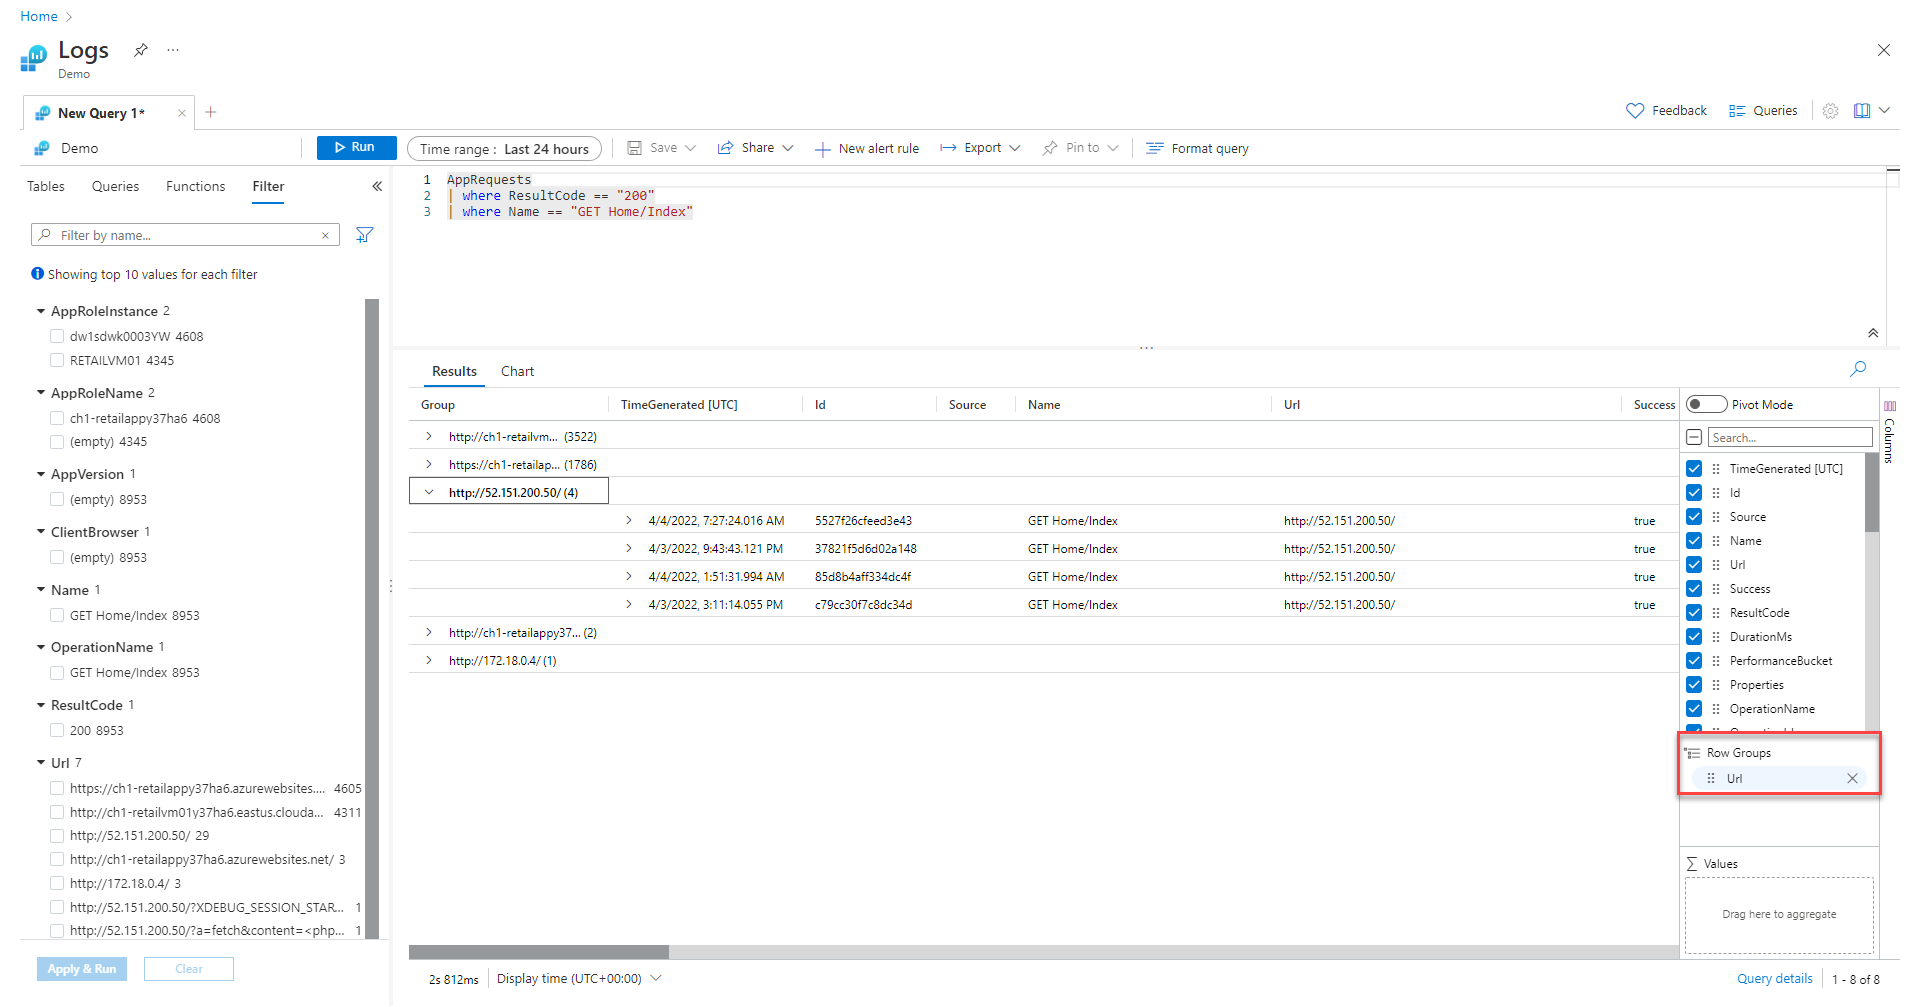
Select Columns to the right of the results pane to open the Columns sidebar.
In the sidebar, you see a list of all available columns. Drag the Url column into the Row Groups section. Results are now organized by that column, and you can collapse each group to help you with your analysis. This action is similar to adding a filter condition to the query, but instead of refetching data from the server, you're processing the data your original query returned. When you run the query again, Log Analytics retrieves data based on your original query. Use this method if you want to quickly analyze a set of records as part of interactive analysis.
Create a pivot table
To analyze the performance of your pages, create a pivot table.
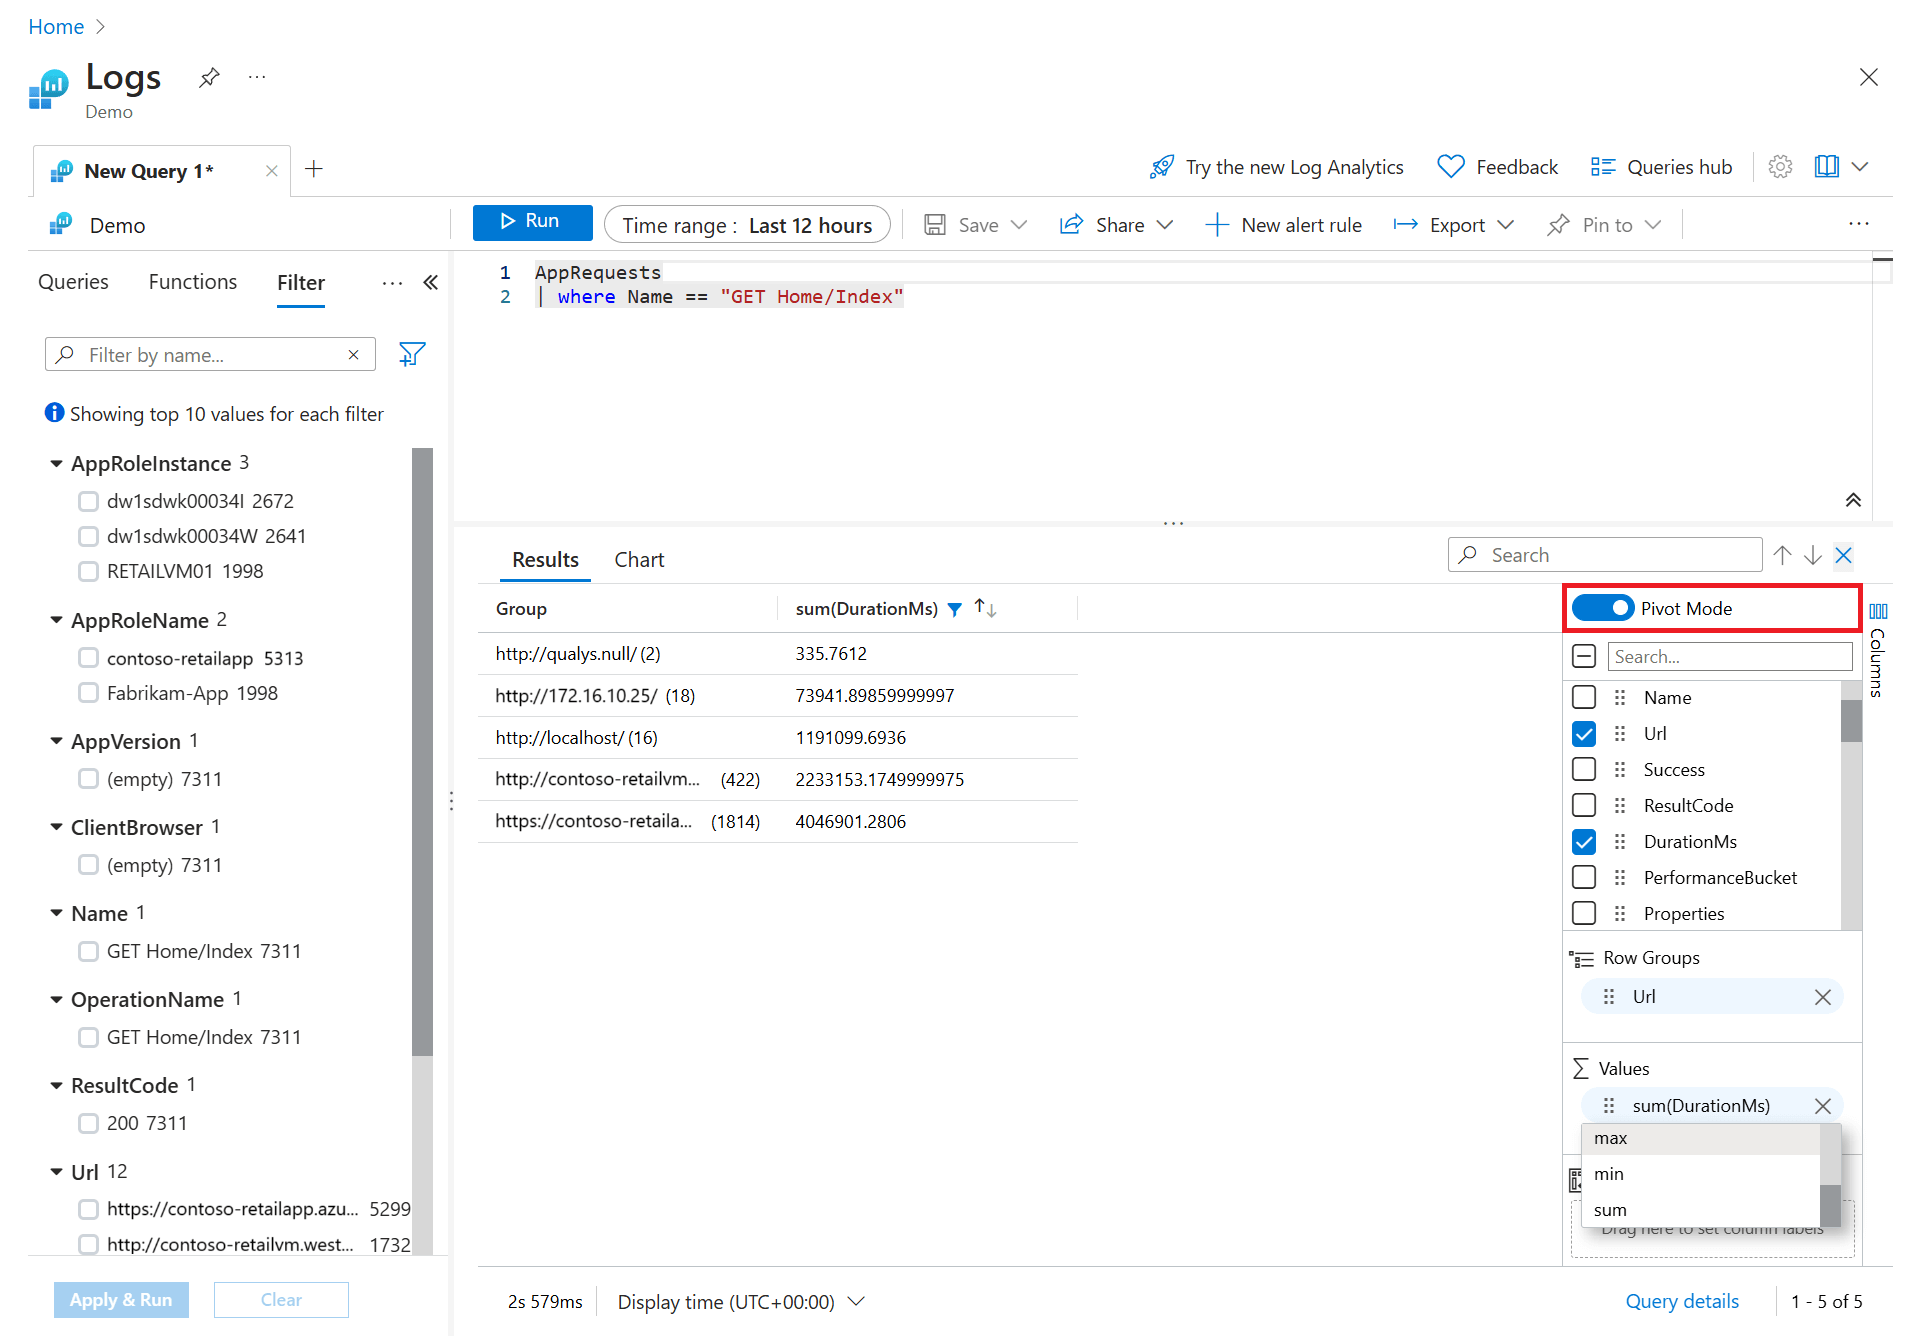
In the Columns sidebar, select Pivot Mode.
Select Url and DurationMs to show the total duration of all calls to each URL.
To view the maximum call duration to each URL, select sum(DurationMs) > max.
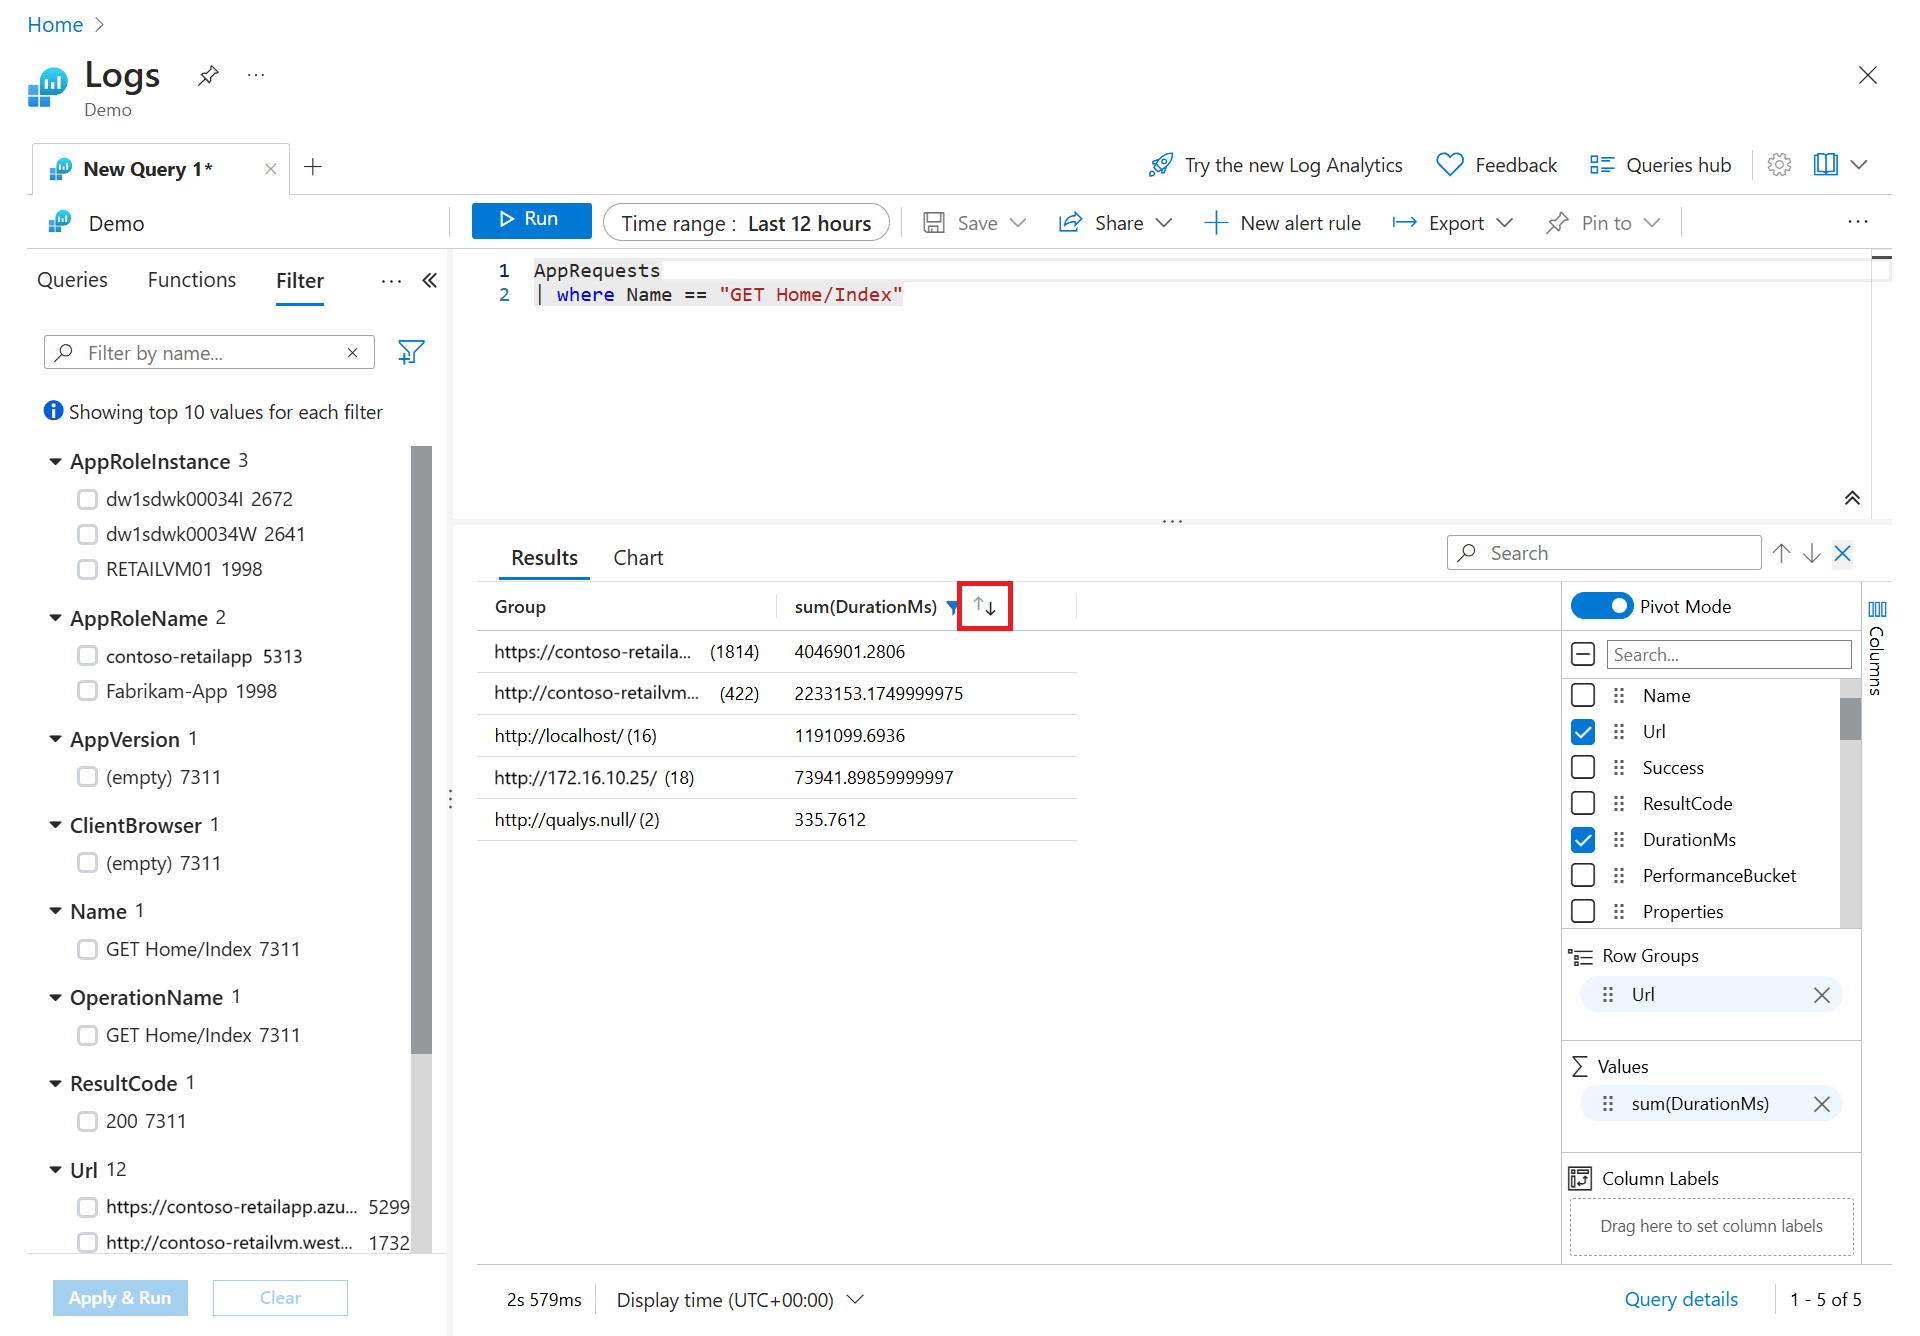
Now let's sort the results by longest maximum call duration by selecting the max(DurationMs) column in the results pane.
Work with charts
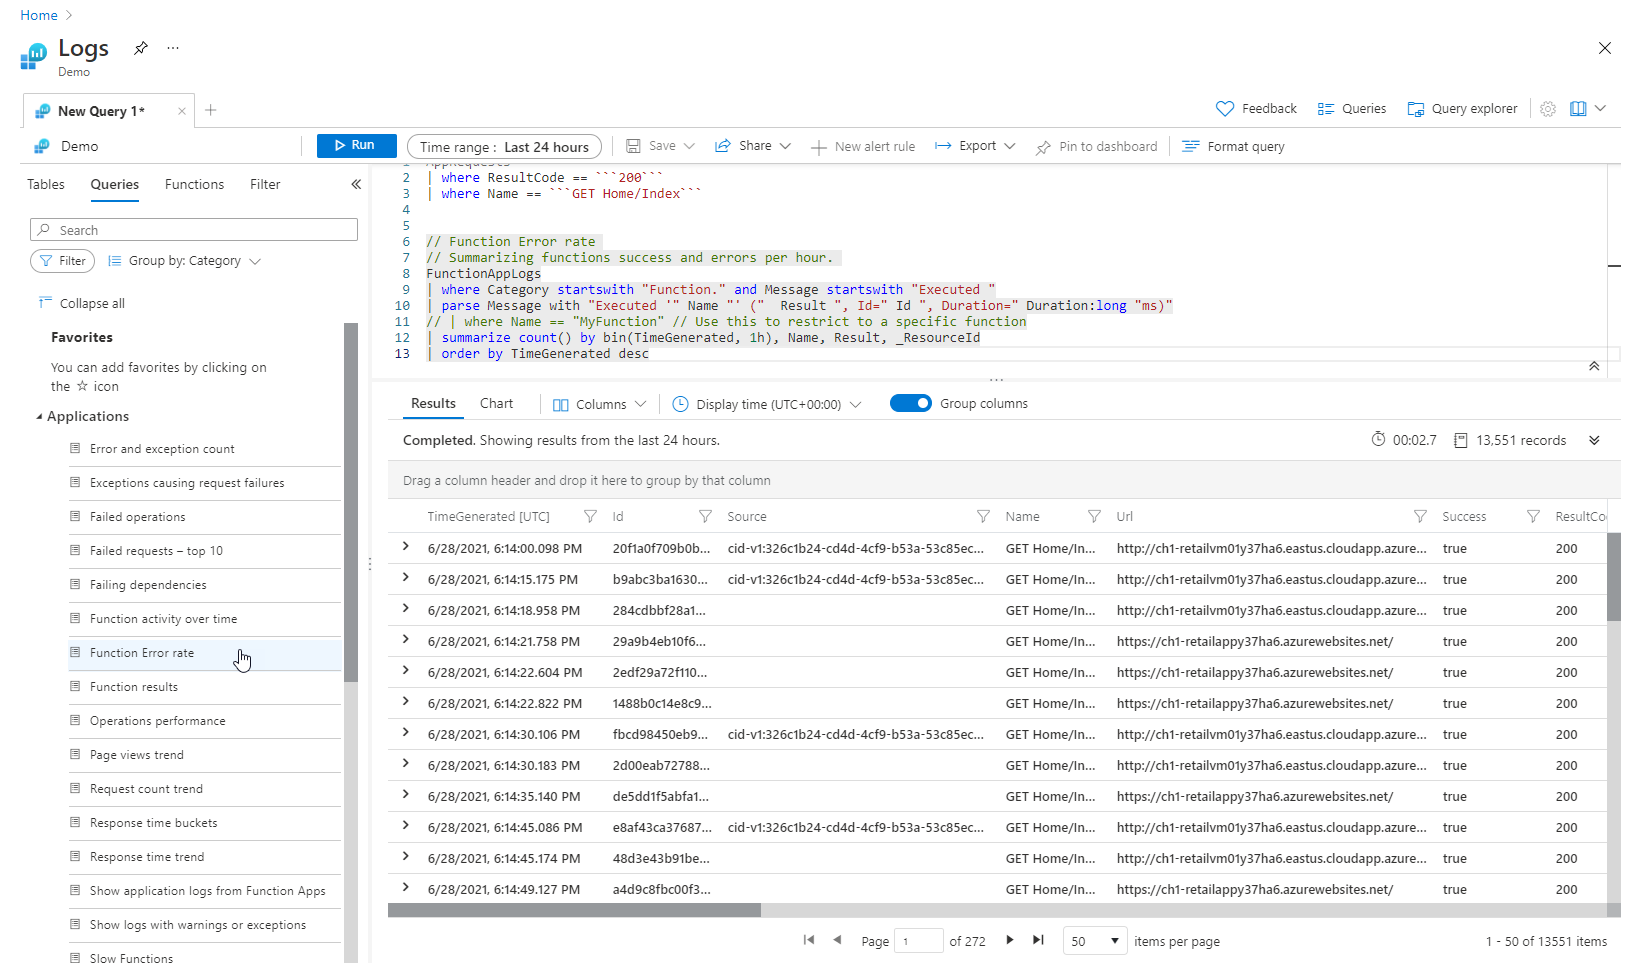
Let's look at a query that uses numerical data that we can view in a chart. Instead of building a query, we select an example query.
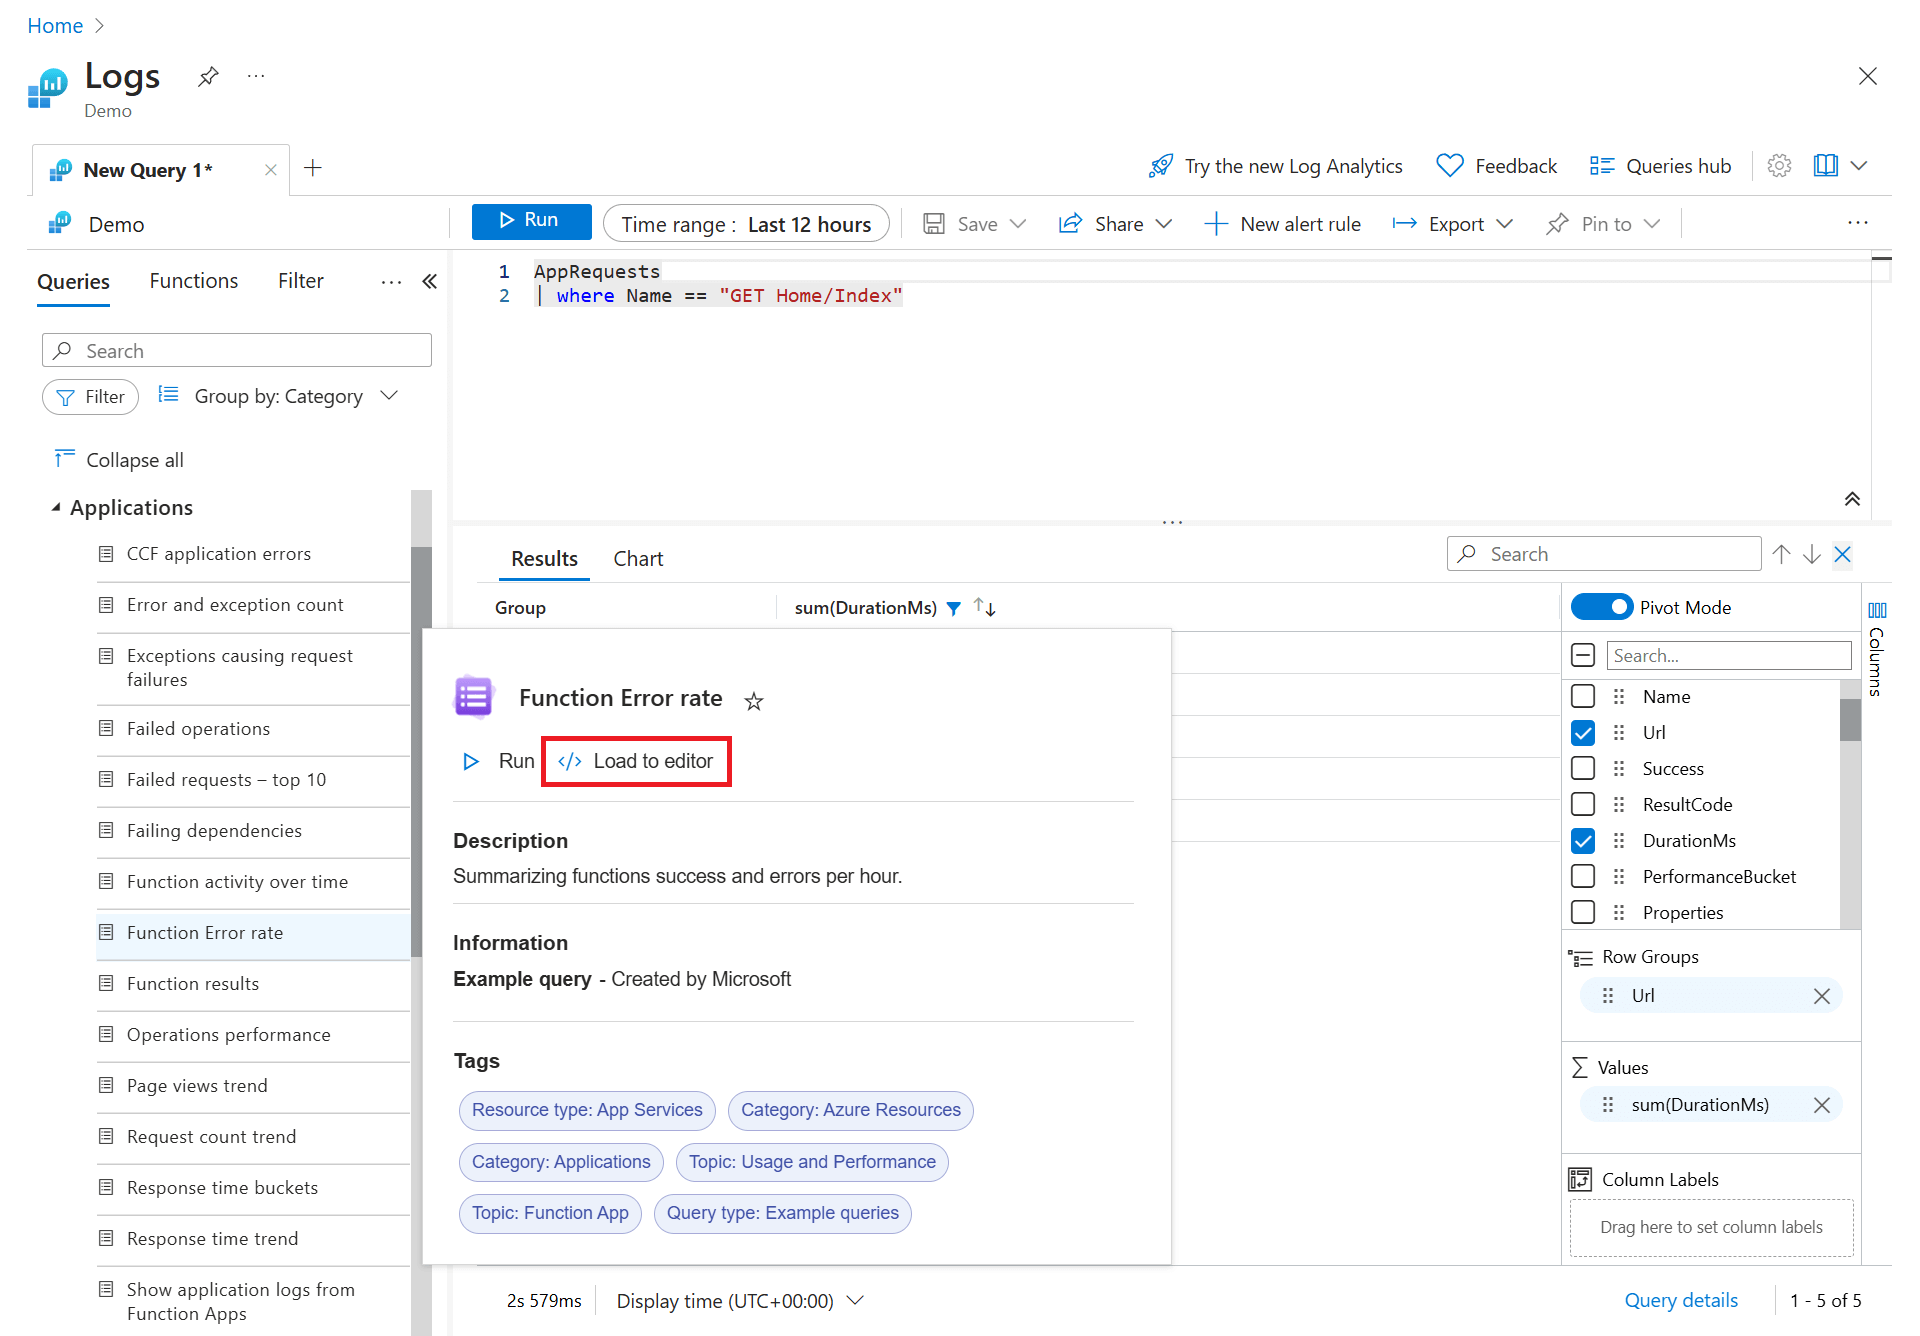
Select Queries on the left pane. This pane includes example queries that you can add to the query window. If you're using your own workspace, you should have various queries in multiple categories.
Load the Function Error rate query in the Applications category to the editor. To do so, double-click the query or hover over the query name to show more information, then select Load to editor.
Notice that the new query is separated from the other by a blank line. A query in KQL ends when it encounters a blank line, making them separate queries.
Click anywhere in a query to select it, then click on the Run button to run it.
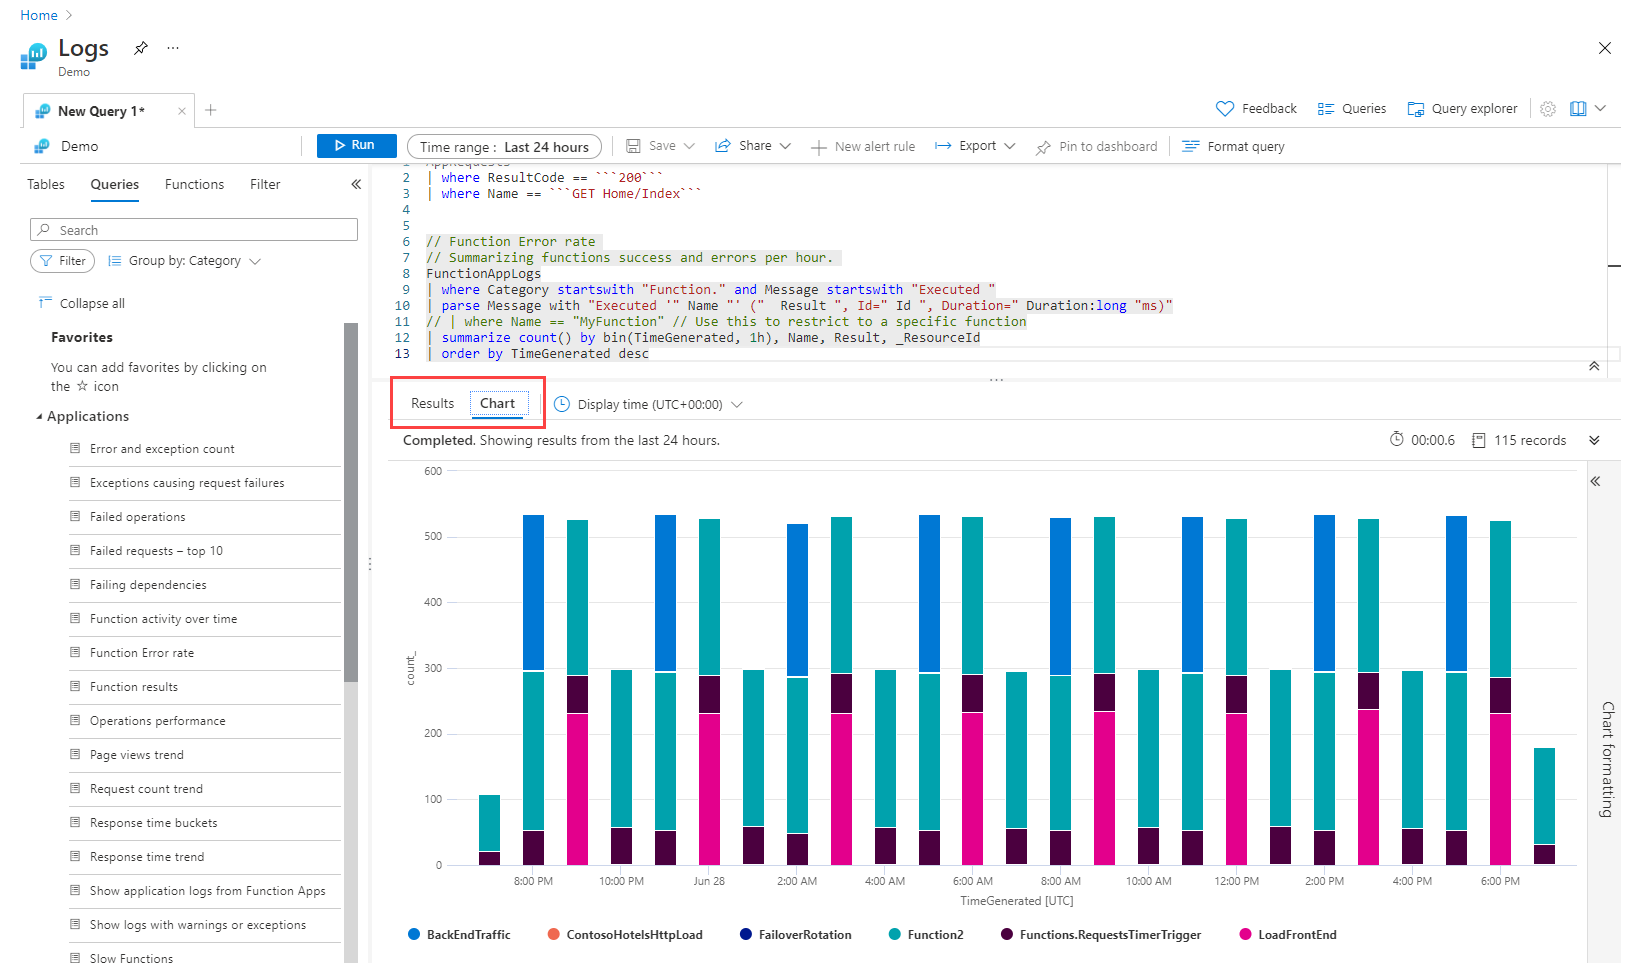
To view the results in a graph, select Chart on the results pane. Notice that there are various options for working with the chart, such as changing it to another type.
Next steps
Now that you know how to use Log Analytics, complete the tutorial on using log queries:

