Tutorial: Configure Azure DDoS Protection diagnostic logging through portal
In this tutorial, you learn how to:
- Configure diagnostic logs.
- Query logs in log analytics workspace.
Configure diagnostic logging for Azure DDoS Protection to gain visibility into DDoS attacks.
Prerequisites
- If you don't have an Azure subscription, create a free account before you begin.
- Before you can complete the steps in this guide, you must first create a Azure DDoS protection plan. DDoS Network Protection must be enabled on a virtual network or DDoS IP Protection must be enabled on a public IP address.
- In order to use diagnostic logging, you must first create a Log Analytics workspace with diagnostic settings enabled.
- DDoS monitors public IP addresses assigned to resources within a virtual network. If you don't have any resources with public IP addresses in the virtual network, you must first create a resource with a public IP address.
Configure diagnostic logs
Sign in to the Azure portal.
In the search box at the top of the portal, enter Monitor. Select Monitor in the search results.
Select Diagnostic Settings under Settings in the left pane, then select the following information in the Diagnostic settings page. Next, select Add diagnostic setting.
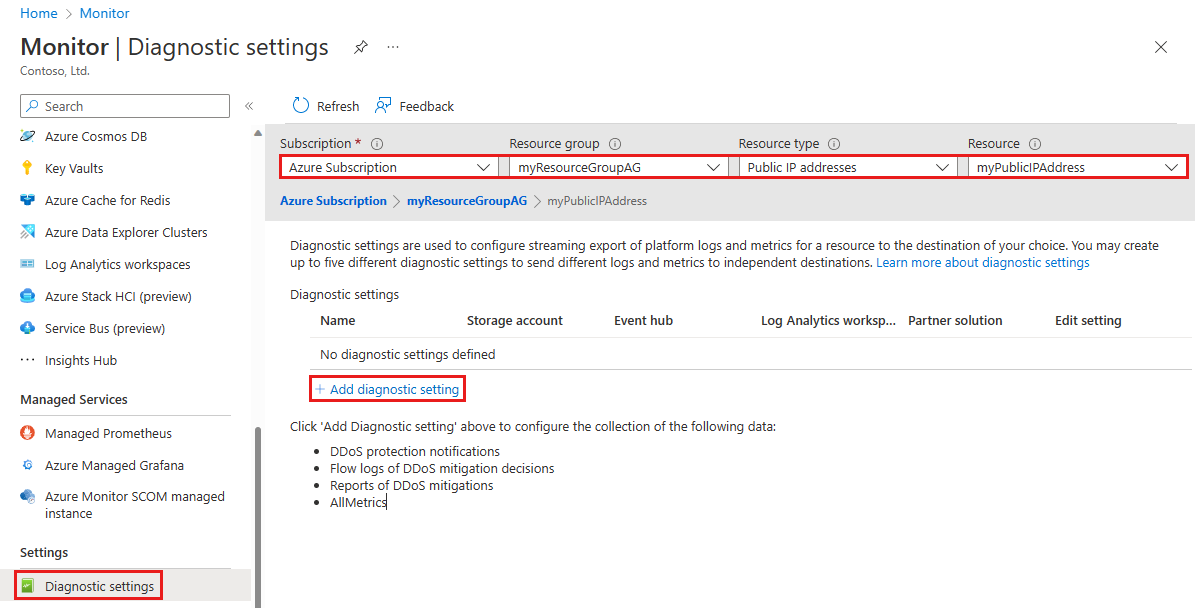
Setting Value Subscription Select the Subscription that contains the public IP address you want to log. Resource group Select the Resource group that contains the public IP address you want to log. Resource type Select Public IP Addresses. Resource Select the specific Public IP address you want to log metrics for. On the Diagnostic setting page, under Destination details, select Send to Log Analytics workspace, then enter the following information, then select Save.
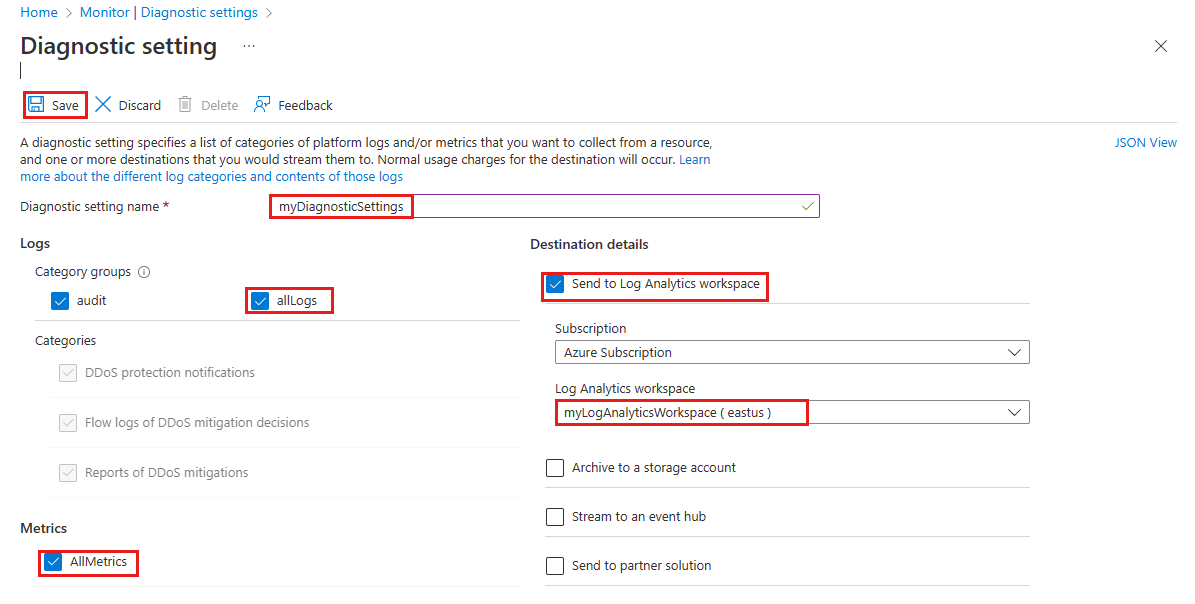
Setting Value Diagnostic setting name Enter myDiagnosticSettings. Logs Select allLogs. Metrics Select AllMetrics. Destination details Select Send to Log Analytics workspace. Subscription Select your Azure subscription. Log Analytics Workspace Select myLogAnalyticsWorkspace.
Validate
In the search box at the top of the portal, enter Monitor. Select Monitor in the search results.
Select Diagnostic Settings under Settings in the left pane, then select the following information in the Diagnostic settings page:
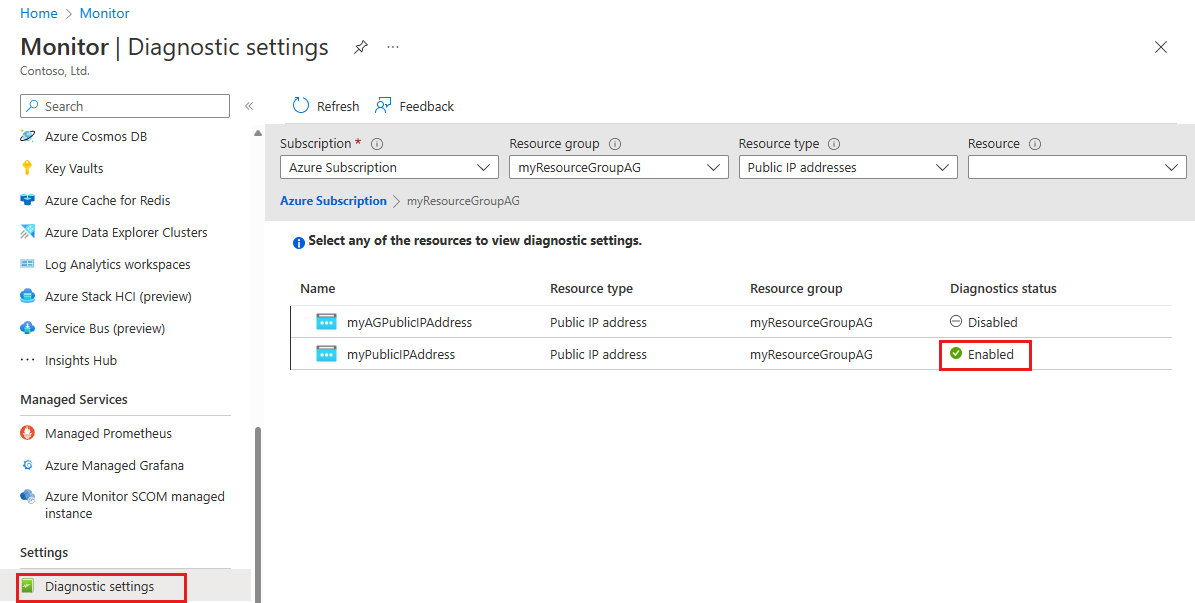
Setting Value Subscription Select the Subscription that contains the public IP address. Resource group Select the Resource group that contains the public IP address. Resource type Select Public IP Addresses. Confirm your Diagnostic status is Enabled.
Next steps
In this tutorial you learned how to configure diagnostic logging for DDoS Protection. To learn how to configure diagnostic logging alerts, continue to the next article.
प्रतिक्रिया
जल्द आ रहा है: 2024 के दौरान हम सामग्री के लिए फीडबैक तंत्र के रूप में GitHub मुद्दों को चरणबद्ध तरीके से समाप्त कर देंगे और इसे एक नई फीडबैक प्रणाली से बदल देंगे. अधिक जानकारी के लिए, देखें: https://aka.ms/ContentUserFeedback.
के लिए प्रतिक्रिया सबमिट करें और देखें