Microsoft Defender for IoT components
The Microsoft Defender for IoT system is built to provide broad coverage and visibility from diverse data sources.
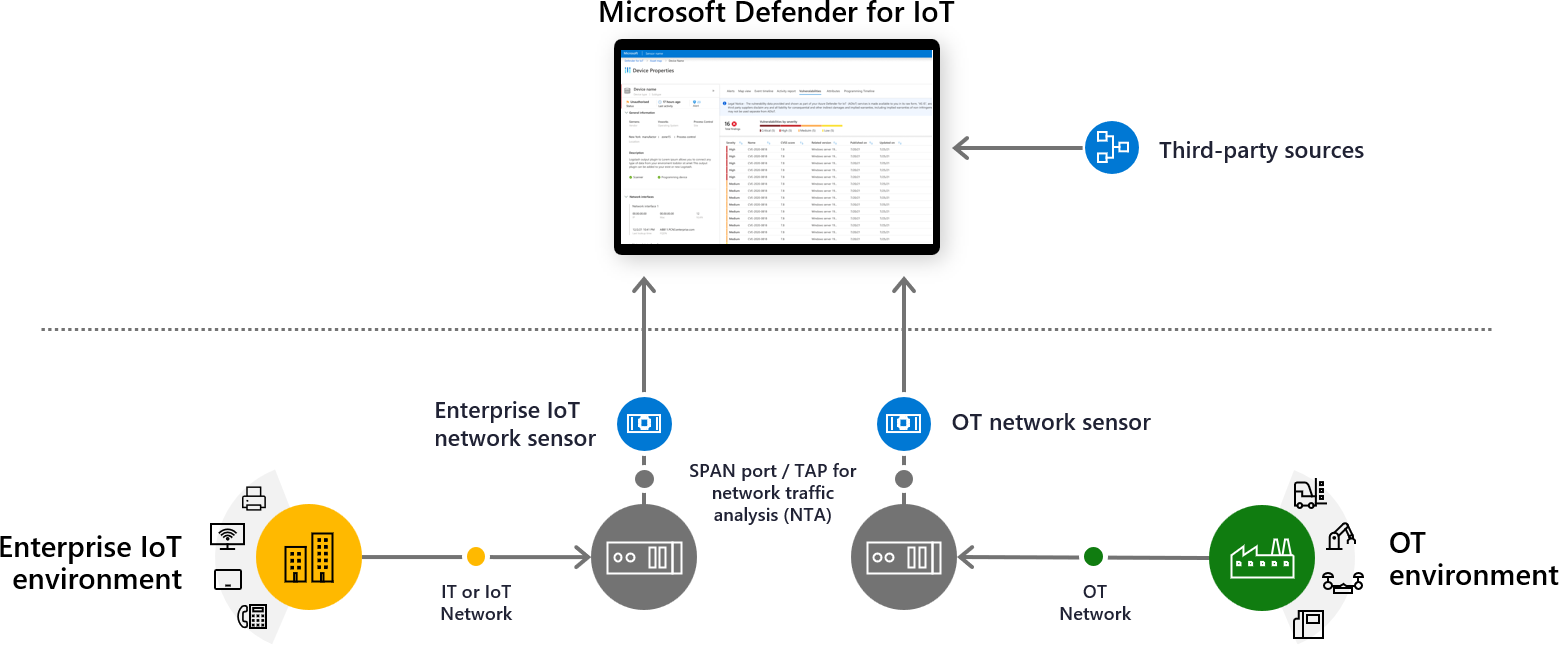
The following image shows how data can stream into Defender for IoT from network sensors and third-party sources to provide a unified view of IoT/OT security. Defender for IoT in the Azure portal provides asset inventories, vulnerability assessments, and continuous threat monitoring.

Defender for IoT connects to both cloud and on-premises components, and is built for scalability in large and geographically distributed environments.
Defender for IoT includes the following OT security monitoring components:
The Azure portal, for cloud management and integration to other Microsoft services, such as Microsoft Sentinel.
Operational technology (OT) or Enterprise IoT network sensors, to detect devices across your network. Defender for IoT network sensors are deployed on either a virtual machine or a physical appliance. OT sensors can be configured as cloud-connected sensors, or fully on-premises, locally managed sensors.
An on-premises management console for centralized OT sensor management and monitoring for local, air-gapped environments.
OT and Enterprise IoT network sensors
Defender for IoT network sensors discover and continuously monitor network traffic across your network devices.
Network sensors are purpose-built for OT/IoT networks and connect to a SPAN port or network TAP. Defender for IoT network sensors can provide visibility into risks within minutes of connecting to the network.
Network sensors use OT/IoT-aware analytics engines and Layer-6 Deep Packet Inspection (DPI) to detect threats, such as fileless malware, based on anomalous or unauthorized activity.
Data collection, processing, analysis, and alerting takes place directly on the sensor, which can be ideal for locations with low bandwidth or high-latency connectivity. Only telemetry and insights are transferred on for management, either to the Azure portal or an on-premises management console.
For more information, see Defender for IoT OT deployment path.
Cloud-connected vs. local OT sensors
Cloud-connected sensors are sensors that are connected to Defender for IoT in Azure, and differ from locally managed sensors as follows:
When you have a cloud connected OT network sensor:
All data that the sensor detects is displayed in the sensor console, but alert information is also delivered to Azure, where it can be analyzed and shared with other Azure services.
Microsoft threat intelligence packages can be automatically pushed to cloud-connected sensors.
The sensor name defined during onboarding is the name displayed in the sensor, and is read-only from the sensor console.
In contrast, when working with locally managed sensors:
View any data for a specific sensor from the sensor console. For a unified view of all information detected by several sensors, use an on-premises management console.
You must manually upload any threat intelligence packages to locally managed sensors.
Sensor names can be updated in the sensor console.
For more information, see Manage OT sensors from the sensor console and Manage OT sensors from the management console.
Defender for IoT analytics engines
Defender for IoT network sensors analyze ingested data using built-in analytics engines, and trigger alerts based on both real-time and pre-recorded traffic.
Analytics engines provide machine learning and profile analytics, risk analysis, a device database and set of insights, threat intelligence, and behavioral analytics.
As an example, the policy violation detection engine models industrial control systems (ICS) networks in order to detect deviations from the expected "baseline" behavior-by utilizing Behavioral Anomaly Detection (BAD) as outlined in NISTIR 8219. This baseline is developed by understanding the regular activities that take place on the network, such as normal traffic patterns, user actions, and accesses to the ICS network. The BAD system then monitors the network for any deviation from the expected behavior and flags any policy violations. Examples of baseline deviations include the unauthorized use of function codes, access to specific objects, or changes to the configuration of a device.
Since many detection algorithms were built for IT, rather than OT networks, the extra baseline for ICS networks helps to shorten the system's learning curve for new detections.
Defender for IoT network sensors include the following main analytics engines:
| Name | Description | Examples |
|---|---|---|
| Protocol violation detection engine | Identifies the use of packet structures and field values that violate ICS protocol specifications. Protocol violations occur when the packet structure or field values don't comply with the protocol specification. |
An "Illegal MODBUS Operation (Function Code Zero)" alert indicates that a primary device sent a request with function code 0 to a secondary device. This action isn't allowed according to the protocol specification, and the secondary device might not handle the input correctly |
| Policy Violation | A policy violation occurs with a deviation from baseline behavior defined in learned or configured settings. | An "Unauthorized HTTP User Agent" alert indicates that an application that wasn't learned or approved by policy is used as an HTTP client on a device. This might be a new web browser or application on that device. |
| Industrial malware detection engine | Identifies behaviors that indicate the presence of malicious network activity via known malware, such as Conficker, Black Energy, Havex, WannaCry, NotPetya, and Triton. | A "Suspicion of Malicious Activity (Stuxnet)" alert indicates that the sensor detected suspicious network activity known to be related to the Stuxnet malware. This malware is an advanced persistent threat aimed at industrial control and SCADA networks. |
| Anomaly detection engine | Detects unusual machine-to-machine (M2M) communications and behaviors. This engine models ICS networks and therefore requires a shorter learning period than analytics developed for IT. Anomalies are detected faster, with minimal false positives. |
A "Periodic Behavior in Communication Channel" alert reflects periodic and cyclic behavior of data transmission, which is common in industrial networks. Other examples include excessive SMB sign-in attempts, and PLC scan detected alerts. |
| Operational incident detection | Detects operational issues such as intermittent connectivity that can indicate early signs of equipment failure. | A "Device is Suspected to be Disconnected (Unresponsive)" alert is triggered when a device isn't responding to any kind of request for a predefined period. This alert might indicate a device shutdown, disconnection, or malfunction. Another example might be if the Siemens S7 stop PLC command was sent alerts. |
Management options
Defender for IoT provides hybrid network support using the following management options:
The Azure portal. Use the Azure portal as a single pane of glass to view all data ingested from your devices via cloud-connected network sensors. The Azure portal provides extra value, such as workbooks, connections to Microsoft Sentinel, security recommendations, and more.
Also use the Azure portal to obtain new appliances and software updates, onboard and maintain your sensors in Defender for IoT, and update threat intelligence packages. For example:
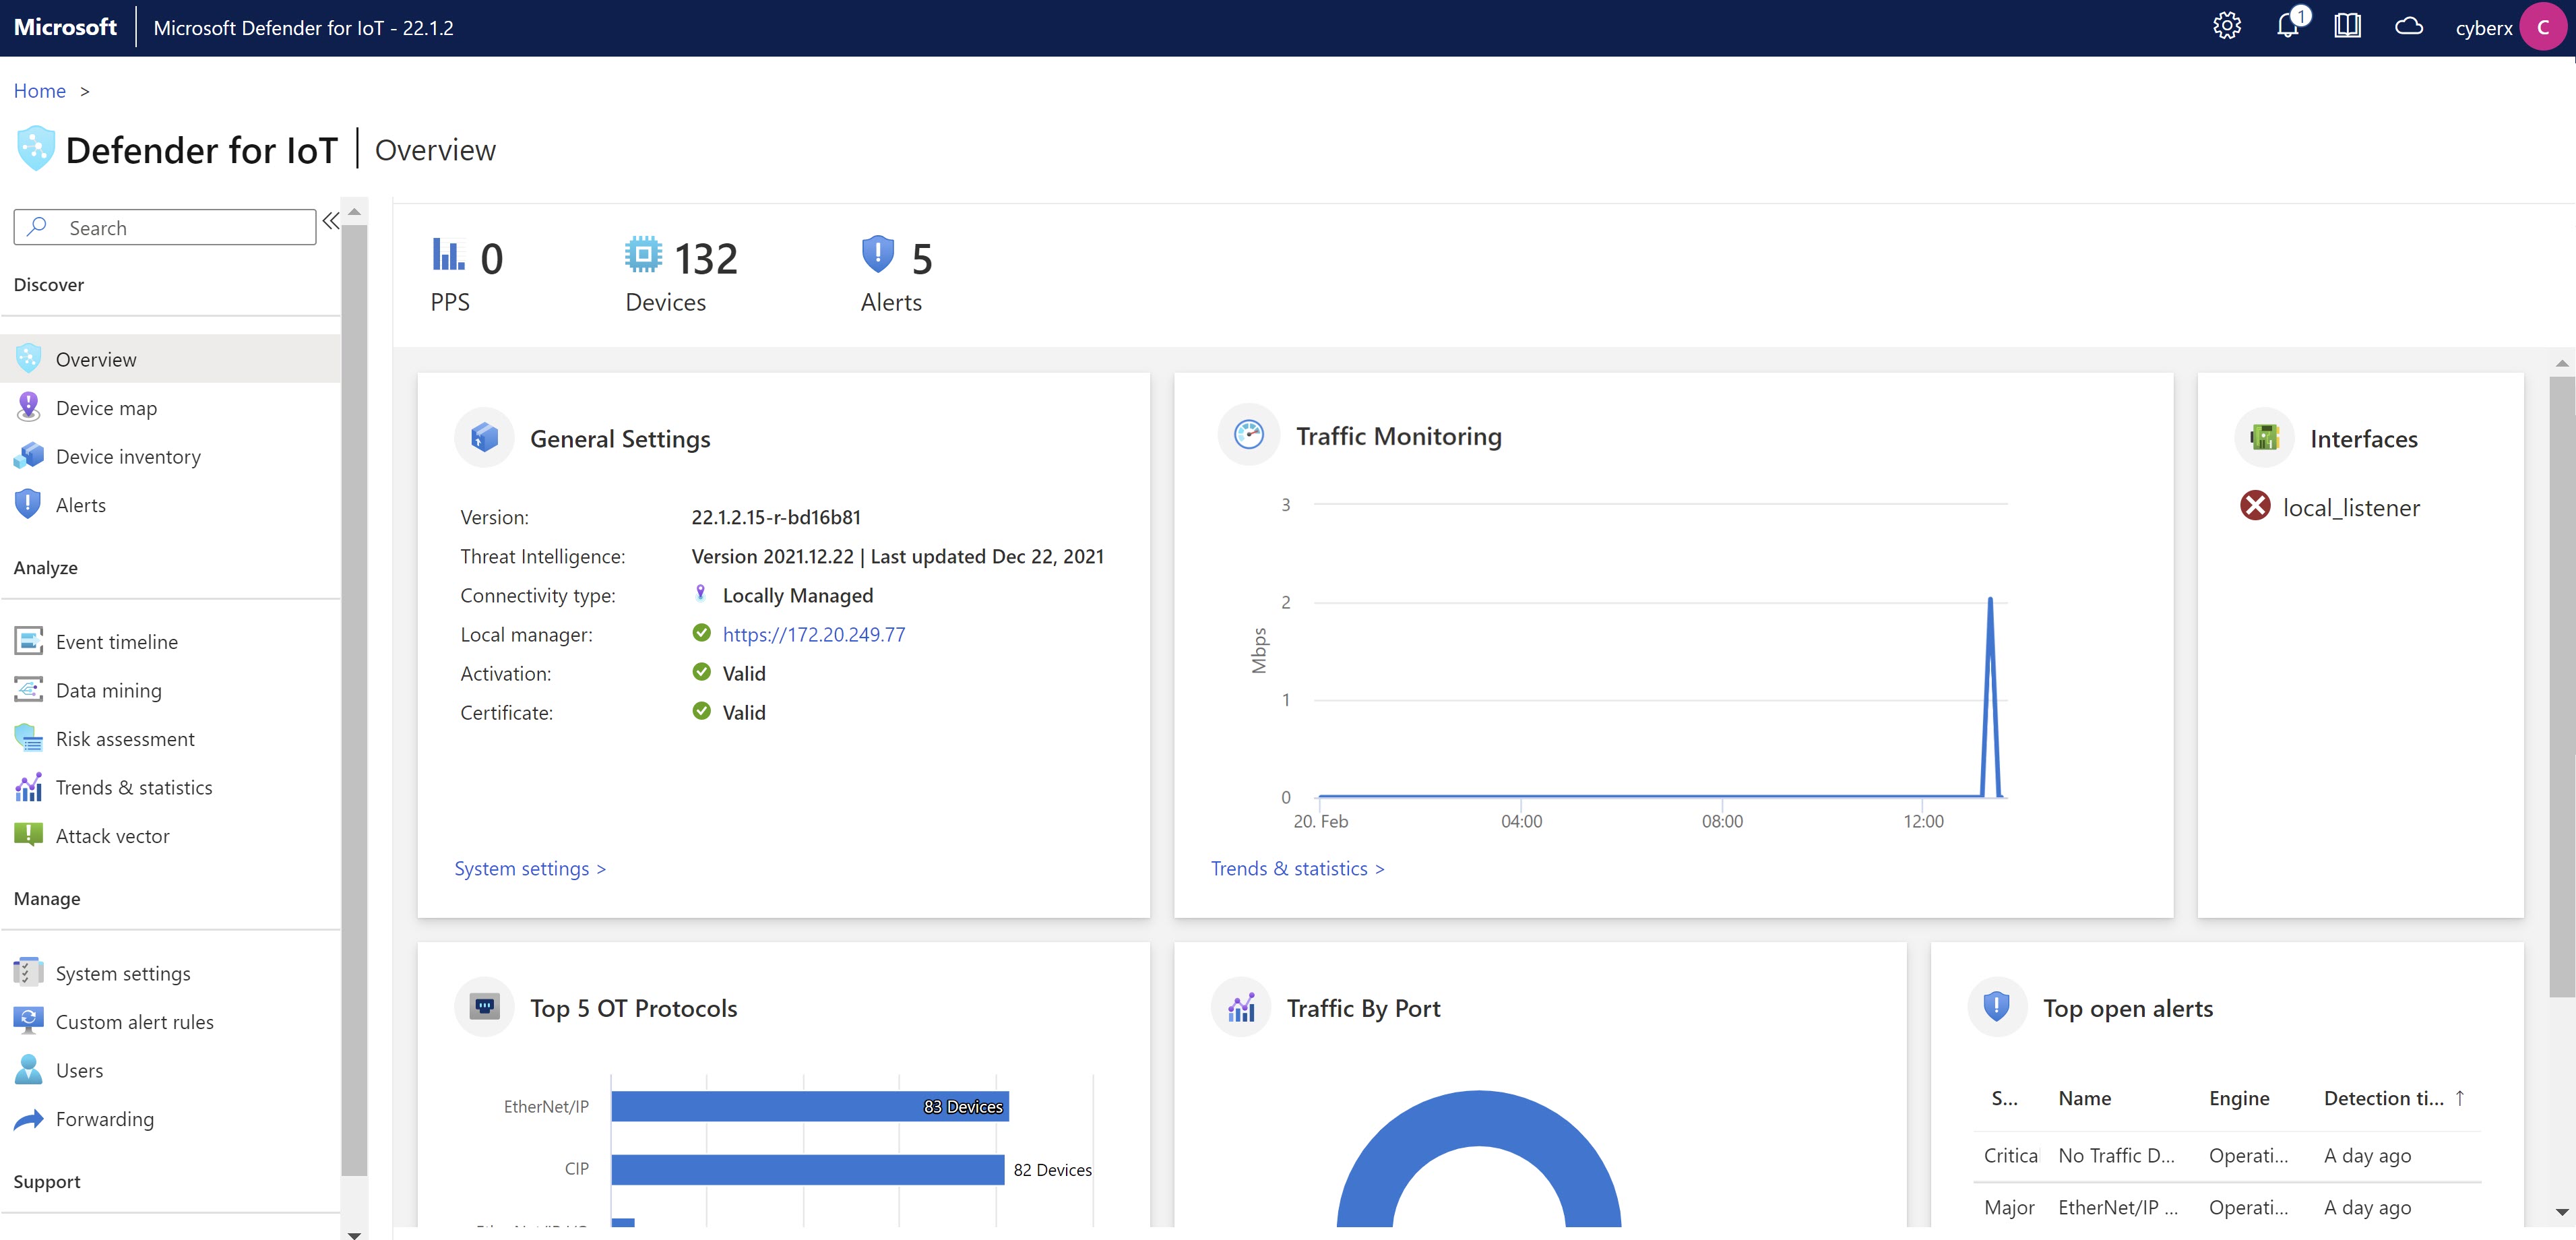
The OT sensor console. View detections for devices connected to a specific OT sensor from the sensor's console. Use the sensor console to view a network map for devices detected by that sensor, a timeline of all events that occur on the sensor, forward sensor information to partner systems, and more. For example:
The on-premises management console. In air-gapped environments, you can get a central view of data from all of your sensors from an on-premises management console, using extra maintenance tools and reporting features.
The software version on your on-premises management console must be equal to that of your most up-to-date sensor version. Each on-premises management console version is backwards compatible to older, supported sensor versions, but cannot connect to newer sensor versions.
For more information, see Air-gapped OT sensor management deployment path.
Devices monitored by Defender for IoT
Defender for IoT can discover all devices, of all types, across all environments. Devices are listed in the Defender for IoT Device inventory pages based on a unique IP and MAC address coupling.
Defender for IoT identifies single and unique devices as follows:
| Type | Description |
|---|---|
| Identified as individual devices | Devices identified as individual devices include: IT, OT, or IoT devices with one or more NICs, including network infrastructure devices such as switches and routers Note: A device with modules or backplane components, such as racks or slots, is counted as a single device, including all modules or backplane components. |
| Not identified as individual devices | The following items aren't considered as individual devices, and do not count against your license: - Public internet IP addresses - Multi-cast groups - Broadcast groups - Inactive devices Network-monitored devices are marked as inactive when there's no network activity detected within a specified time: - OT networks: No network activity detected for more than 60 days - Enterprise IoT networks: No network activity detected for more than 30 days Note: Endpoints already managed by Defender for Endpoint are not considered as separate devices by Defender for IoT. |

