How to enable diagnostic settings for the MedTech service
In this article, learn how to enable diagnostic settings for the MedTech service to:
- Create a diagnostic setting to export logs and metrics for audit, analysis, or troubleshooting of the MedTech service.
- Use the Azure Log Analytics workspace to view the MedTech service logs.
- Access the MedTech service predefined Azure Log Analytics queries.
Create a diagnostic setting for the MedTech service
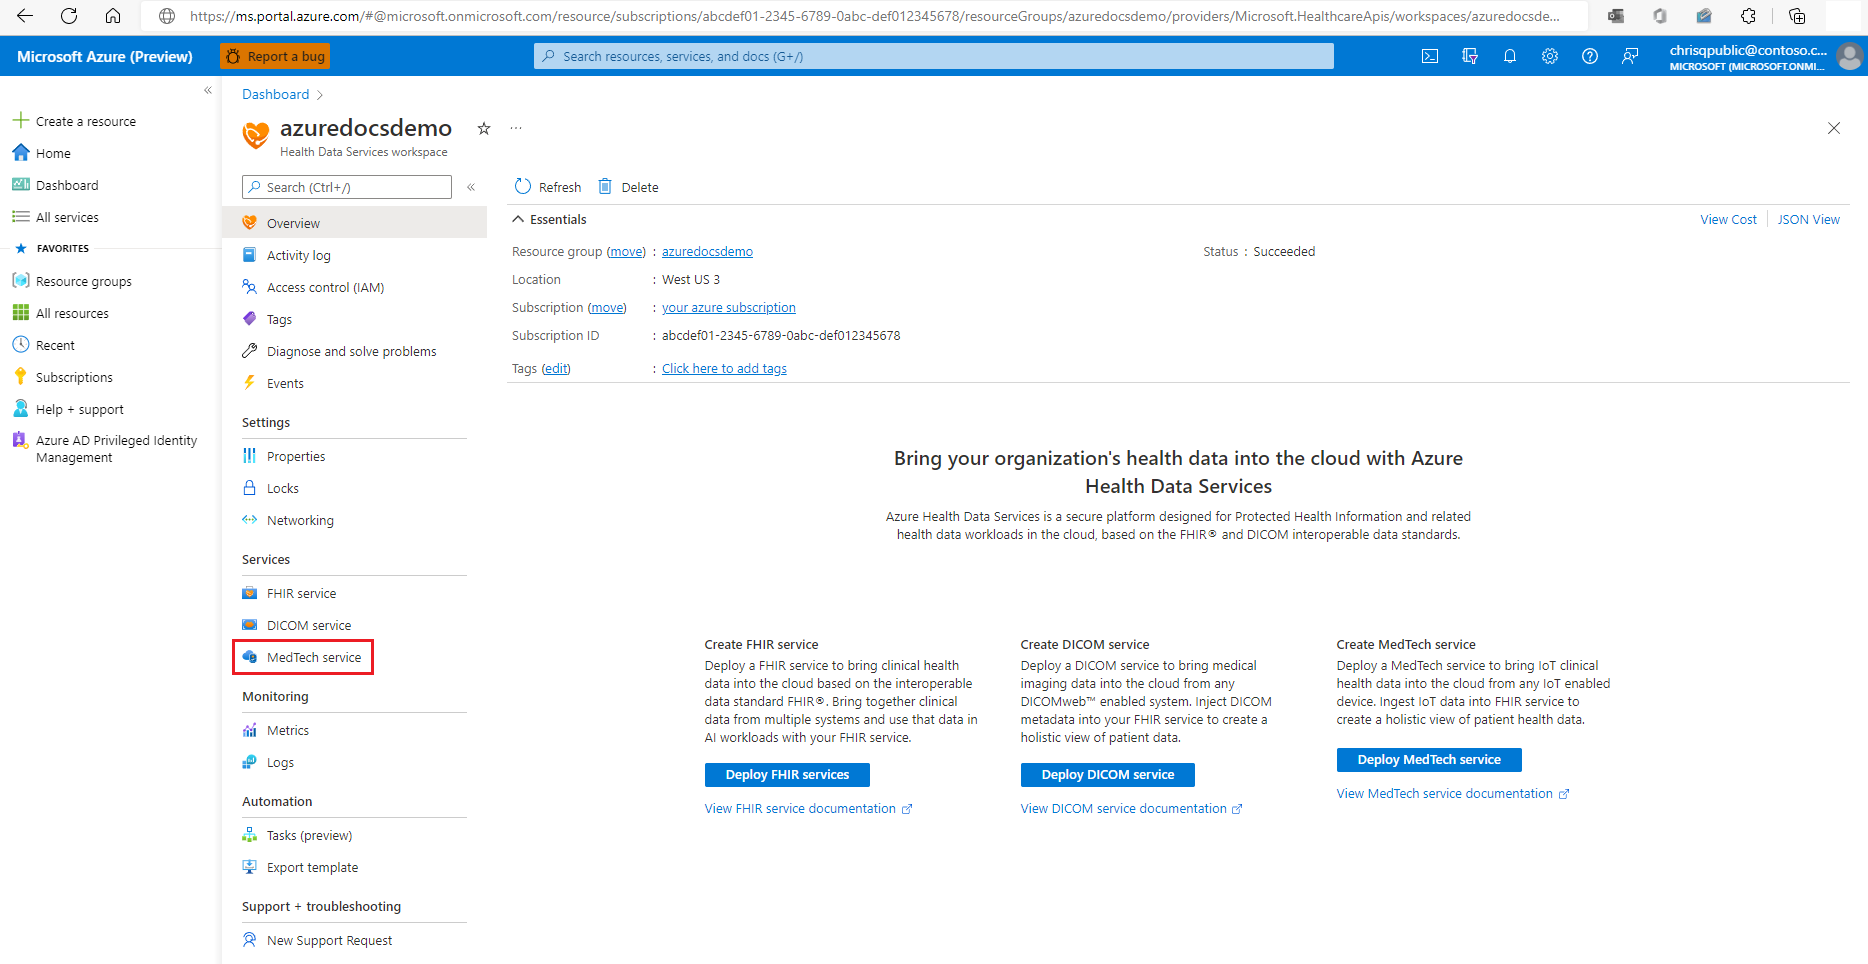
To enable logs and metrics export for your MedTech service, select MedTech service in your workspace under Services.
Select the MedTech service that you want to enable a diagnostic setting for. In this example, we'll be using a MedTech service named mt-azuredocsdemo. You'll be selecting a MedTech service within your own Azure Health Data Services workspace.
Select the Diagnostic settings option under Monitoring.
Select the + Add diagnostic setting option.
The + Add diagnostic setting page will open, requiring configuration information from you.
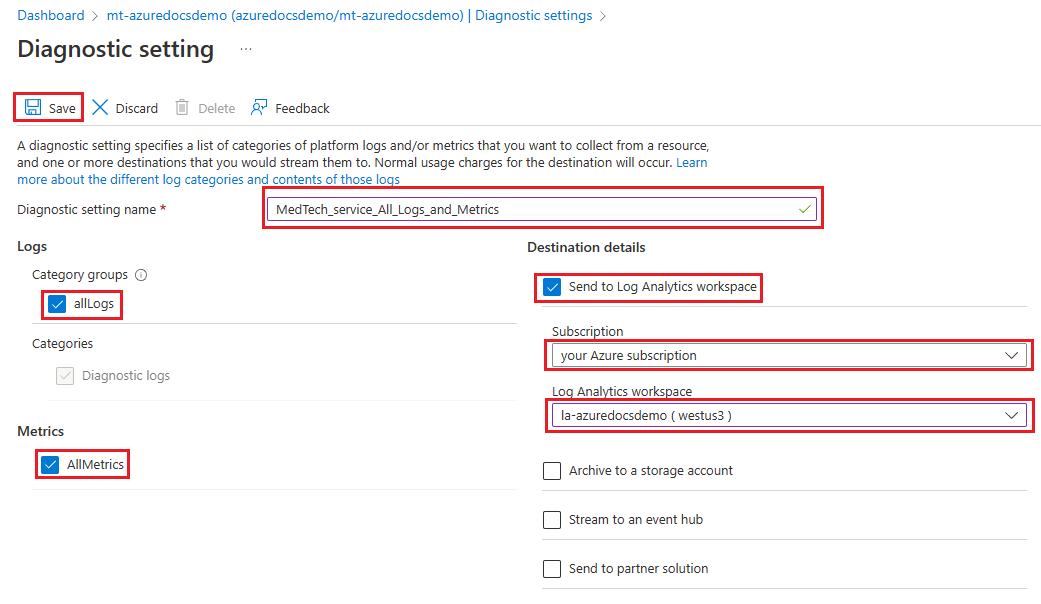
Enter a display name in the Diagnostic setting name box. For this example, we'll name it MedTech_service_All_Logs_and_Metrics. You'll enter a display name of your own choosing.
Under Logs, select the AllLogs option.
Under Metrics, select the AllMetrics option.
Note
To view a complete list of MedTech service metrics associated with AllMetrics, see Supported metrics with Azure Monitor.
Under Destination details, select the destination or destinations you want to use for your exported MedTech service logs and metrics. In this example, we've selected an Azure Log Analytics workspace named la-azuredocsdemo. You'll select a destination of your own choosing.
Important
Each Destination details selection requires that certain resources (for example, an existing Azure Log Analytics workspace or storage account) be created and available before the selection can be successfully configured. Choose each selection to see which resources are required.
For a successful configuration, you should only have a single destination per diagnostic setting.
Metrics can be exported to the following destinations:
Destination Description Azure Log Analytics workspace Metrics are converted to log form. Sending the metrics to the Azure Monitor Logs store (which is searchable via Log Analytics) enables you to integrate them into queries, alerts, and visualizations with existing log data. Azure storage account Archiving logs and metrics to an Azure storage account is useful for audit, static analysis, or backup. Compared to Azure Monitor Logs and a Log Analytics workspace, Azure storage is less expensive, and logs can be kept there indefinitely. Azure event hub Sending logs and metrics to an event hub allows you to stream data to external systems such as third-party Security Information and Event Managements (SIEMs) and other Log Analytics solutions. Azure Monitor partner integrations Specialized integrations between Azure Monitor and other non-Microsoft monitoring platforms. Useful when you're already using one of the partners. Select the Save option to save your diagnostic setting selections.
Once you've selected the Save option, the page will display a message that the diagnostic setting for your MedTech service has been saved successfully.
Note
It might take up to 15 minutes for the first MedTech service logs and metrics to display in the destination of your choice.
To view your saved diagnostic setting, select Diagnostic settings.
The Diagnostic settings page will open, displaying your newly created diagnostic setting for your MedTech service. You'll have the ability to:
- Edit setting: Edit or delete your saved MedTech service diagnostic setting.
- + Add diagnostic setting: Create more diagnostic settings for your MedTech service (for example: you might also want to send your MedTech service metrics to another destination like a Logs Analytics workspace).
Tip
To learn about how to work with diagnostic settings, see Diagnostic settings in Azure Monitor.
To learn about how to work with diagnostic logs, see Overview of Azure platform logs.
Use the Azure Log Analytics workspace to view the MedTech service logs
If you choose to include your Log Analytics workspace as a destination option for your diagnostic setting, you can view the logs within Logs in your MedTech service. If there are any logs, they'll be a result of exceptions for your MedTech service (for example: HealthCheck exceptions).
To access your Log Analytics workspace, select the Logs button within your MedTech service.
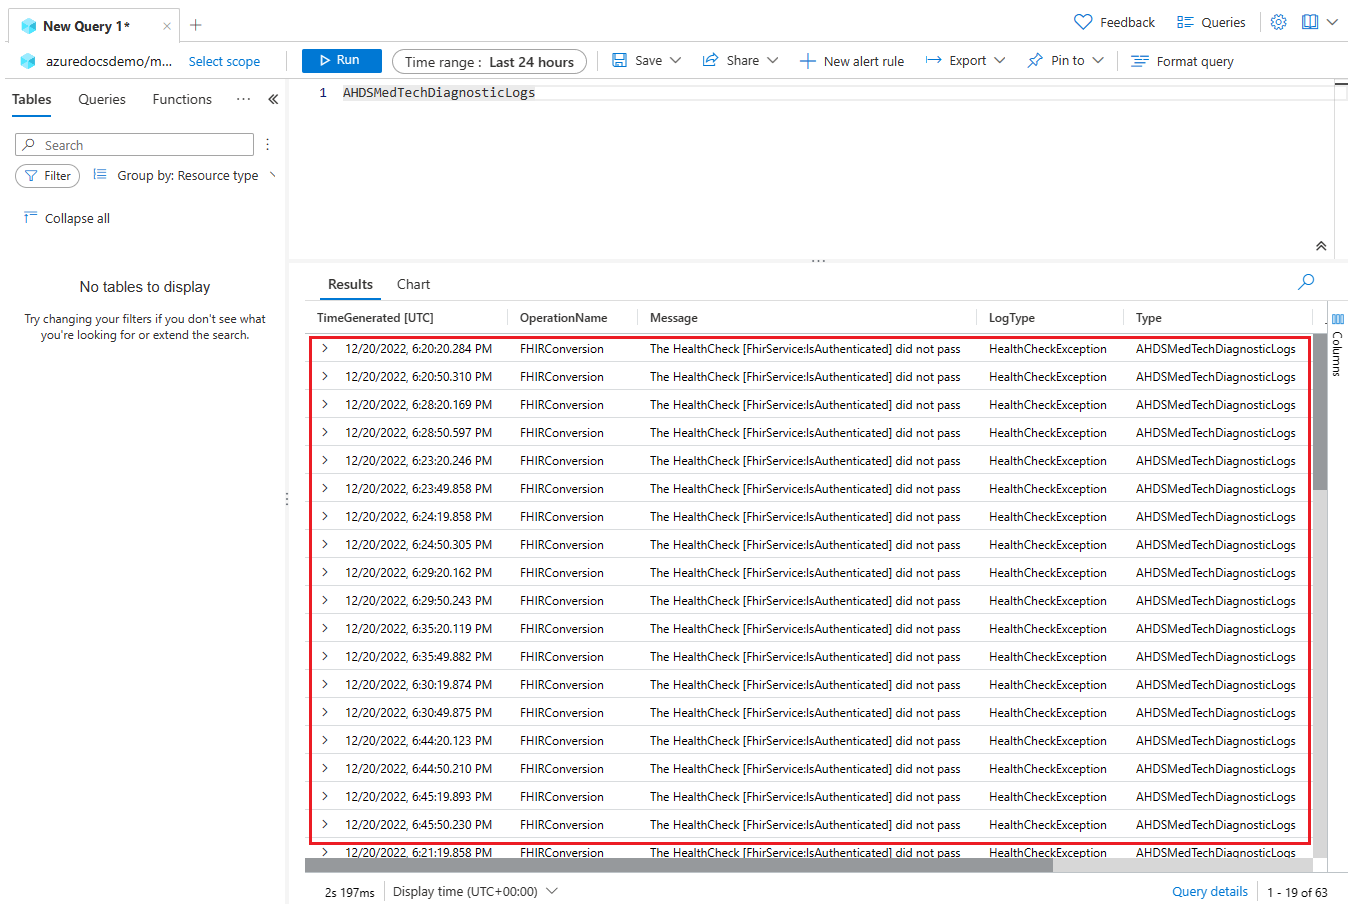
Copy the below table query string into your Log Analytics workspace query area and select Run. Using the AHDSMedTechDiagnosticLogs table will provide you with all logs contained in the entire table for the selected Time range setting (the default value is Last 24 hours). The MedTech service provides five predefined queries that will be addressed in the article section titled Accessing the MedTech service predefined Azure Log Analytics queries.
AHDSMedTechDiagnosticLogsIf your MedTech service is configured correctly and healthy, then the query should come back with no error logs.
If your MedTech service is misconfigured or unhealthy, then the query will come back with error logs.
Select the down arrow in one of the error logs to display the full error log message, which can be used to help troubleshoot issues with your MedTech service. In this example, the error log message shows that the MedTech service wasn't able to authenticate with the FHIR® service.
Once you've resolved the issue, you can adjust the Time range setting (for this example, we'll be using Last 30 minutes) and select Run to see that the error logs have cleared for the issue that you resolved with your MedTech service.
Warning
The above custom query is not saved and will have to be recreated if you leave your Log Analytics workspace without saving the custom query.
To learn how to save a custom query in Log Analytics, see Save a query in Azure Monitor Log Analytics
Tip
To learn how to use the Log Analytics workspace, see Azure Log Analytics workspace.
For assistance troubleshooting MedTech service errors, see Troubleshoot errors using the MedTech service logs.
Accessing the MedTech service predefined Azure Log Analytics queries
The MedTech service comes with predefined queries that can be used anytime in your Log Analytics workspace to filter and summarize your logs for more precise investigation. The queries can also be customized and saved/shared.
To access the predefined queries, select Queries, type MedTech in the Search area, select a predefined query by using a double-click, and select Run to execute the predefined query. In this example, we've selected MedTech healthcheck exceptions. You'll select a predefined query of your own choosing.
Tip
You can click on each of the MedTech service predefined queries to see their description and access different options for running the query or placing it into the Log Analytics workspace query area.
Multiple predefined queries can be selected. In this example, we've additionally selected Log count per MedTech log or exception type. You'll select another predefined query of your own choosing.
Only the highlighted predefined query will be executed.
Warning
Any changes that you've made to the predefined queries are not saved and will have to be recreated if you leave your Log Analytics workspace without saving custom changes you've made to the predefined queries.
To learn how to save a query in Log Analytics, see Save a query in Azure Monitor Log Analytics
Tip
To learn how to use the Log Analytics workspace, see Azure Log Analytics workspace.
For assistance troubleshooting MedTech service errors, see Troubleshoot errors using the MedTech service logs.
Next steps
Frequently asked questions about the MedTech service
Note
FHIR® is a registered trademark of HL7 and is used with the permission of HL7.


