Tutorial: Shape and combine data in Power BI Desktop
With Power BI Desktop, you can connect to many different types of data sources, then shape the data to meet your needs, enabling you to create visual reports to share with others. Shaping data means transforming the data: renaming columns or tables, changing text to numbers, removing rows, setting the first row as headers, and so on. Combining data means connecting to two or more data sources, shaping them as needed, then consolidating them into a single query.
In this tutorial, you'll learn how to:
- Shape data by using Power Query Editor.
- Connect to different data sources.
- Combine those data sources, and create a data model to use in reports.
Power Query Editor in Power BI Desktop uses the right-click menus, and the Transform ribbon. Most of what you can select in the ribbon is also available by right-clicking an item, such as a column, and choosing from the menu that appears.
Shape data
To shape data in Power Query Editor, you provide step-by-step instructions for Power Query Editor to adjust the data as it loads and presents the data. The original data source isn't affected; only this particular view of the data is adjusted, or shaped.
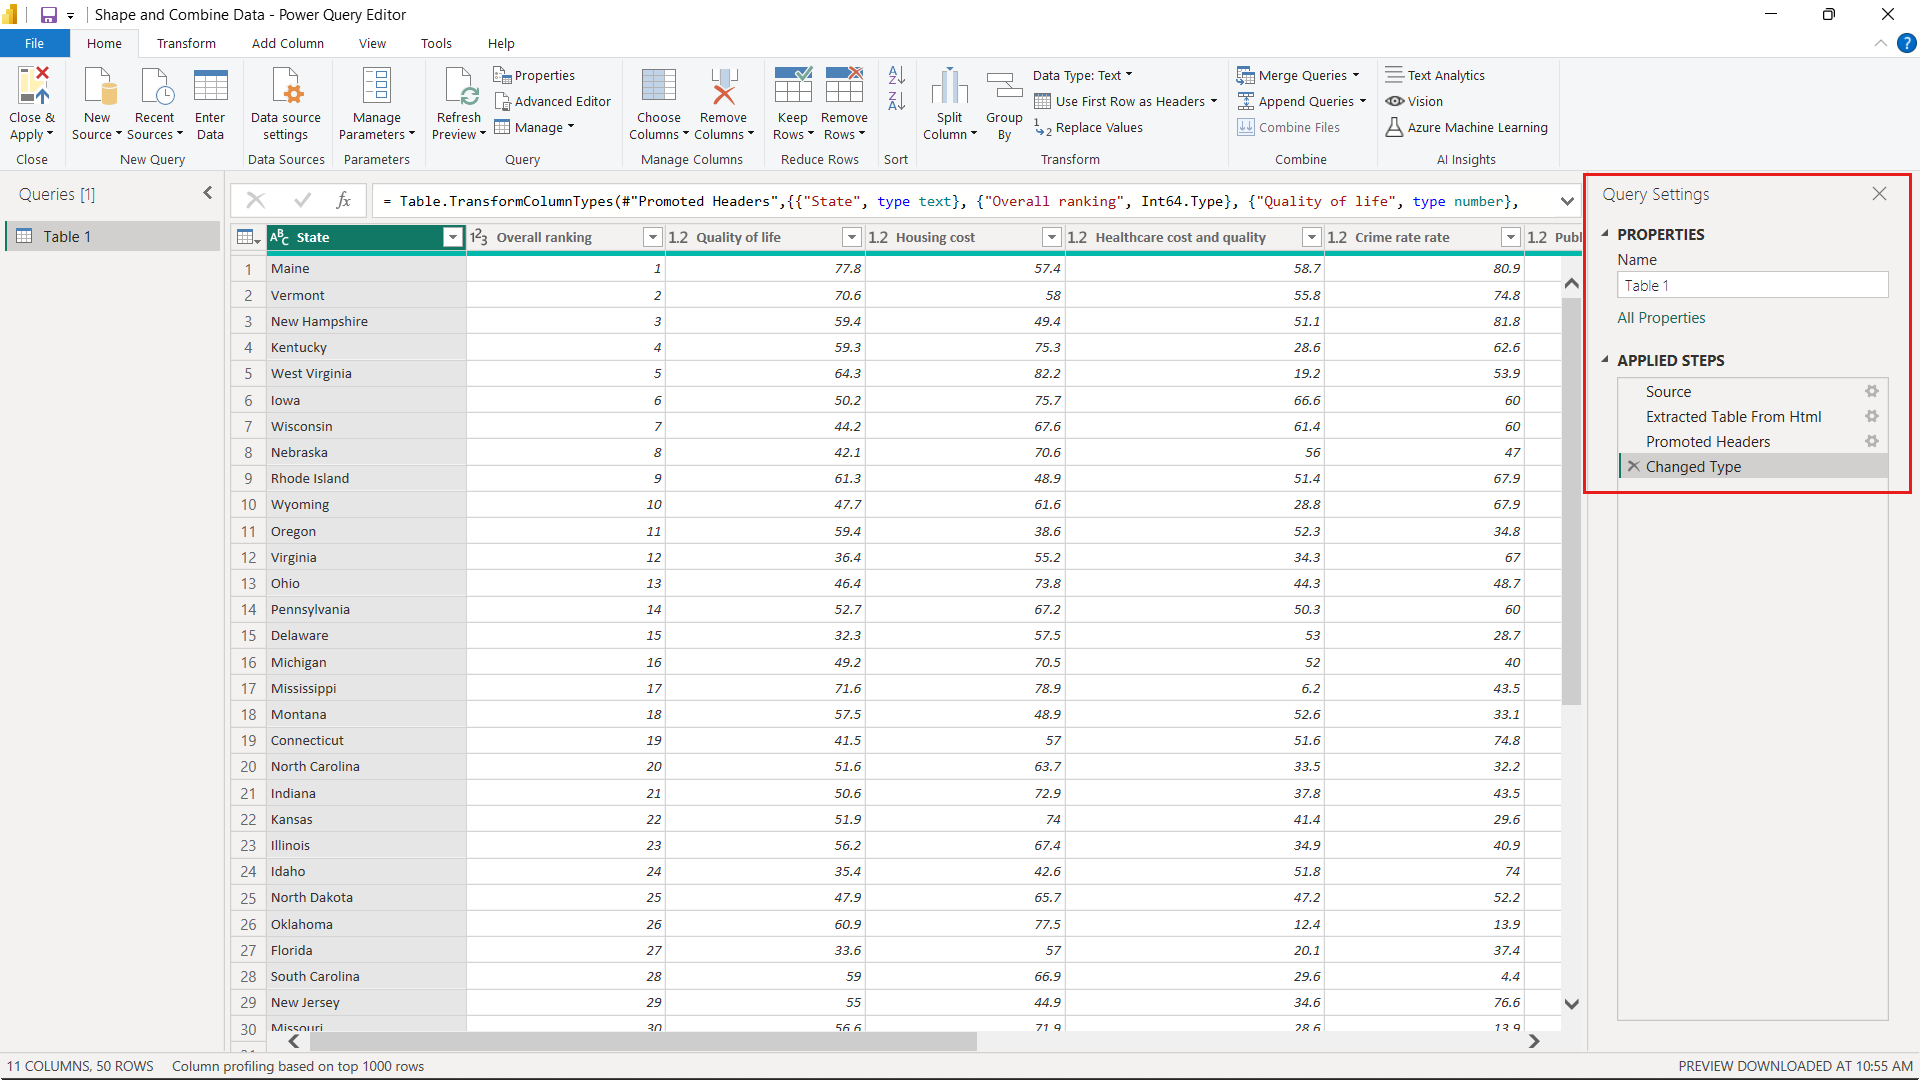
Power Query Editor records the steps you specify (such as rename a table, transform a data type, or delete a column). Each time this query connects to the data source, Power Query Editor carries out those steps so that the data is always shaped the way you specify. This process occurs whenever you use Power Query Editor, or for anyone who uses your shared query, such as on the Power BI service. Those steps are captured, sequentially, in the Query Settings pane, under APPLIED STEPS. We’ll go through each of those steps in this article.
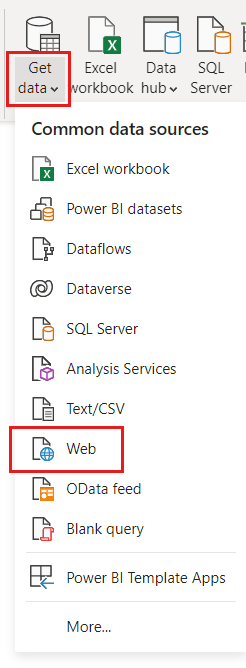
Import the data from a web source. Select the Get data dropdown, then choose Web.
Paste this URL into the From Web dialog and select OK.
https://www.fool.com/research/best-states-to-retire
In the Navigator dialog, select the checkbox for the entry that starts with
Individual factor scores, then choose Transform Data.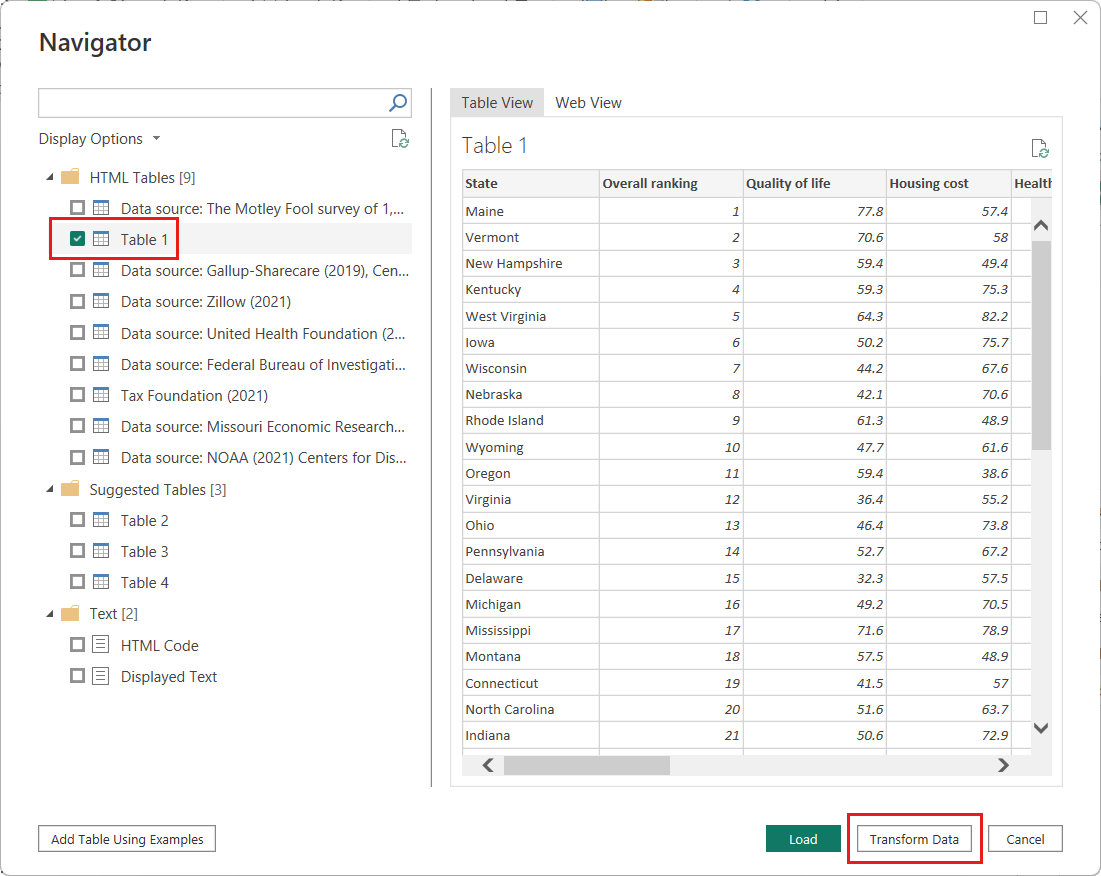
Tip
Some information in the tables from the previous URL may change or be updated occasionally. As a result, you may need to adjust the selections or steps in this article accordingly.
The Power Query Editor window opens. You can see the default steps applied so far, in the Query Settings pane under APPLIED STEPS.
- Source: Connecting to the website.
- Extracted Table from Html: Selecting the table.
- Promoted Headers: Changing the top row of data into column headers.
- Changed Type: Changing the column types, which are imported as text, to their inferred types.
Change the table name from the default
Individual factor scores...toRetirement Data, then press Enter.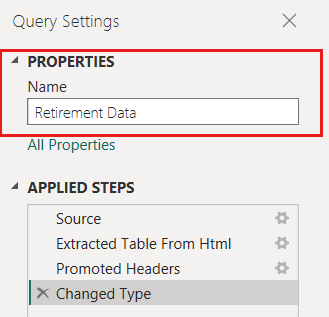
The existing data is ordered by a weighted score, as described on the source webpage under Methodology. We'll then sort the table on this column to compare the custom score's ranking to the existing score.
From the Add Column ribbon, select Custom Column.
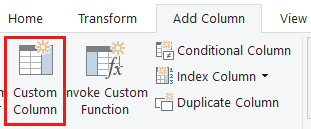
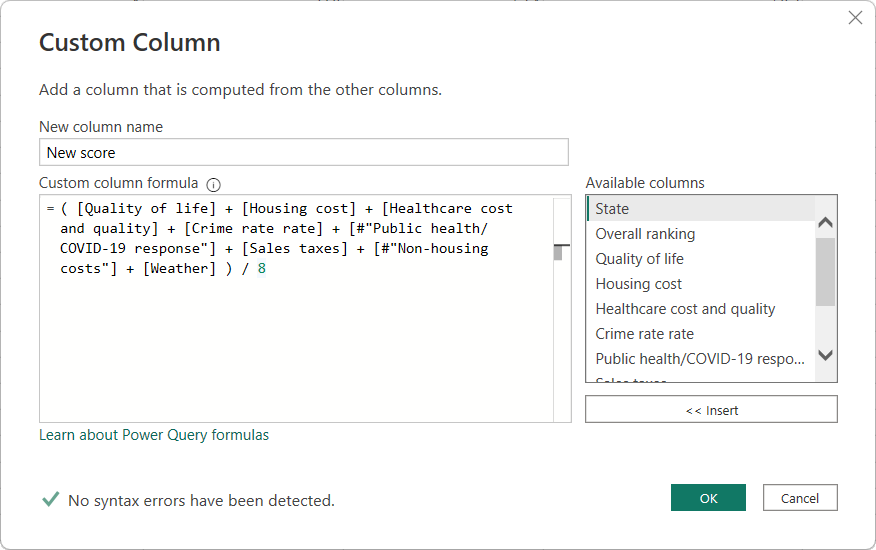
In the Custom Column dialog, in the New column name field, enter New score. For the Custom column formula, enter the following data:
( [Quality of life] + [Cost of housing] + [Public health] + [Crime] + [Taxes] + [Weather] + [#"Non-housing cost of living"] ) / 7Make sure the status message is No syntax errors have been detected, then select OK.
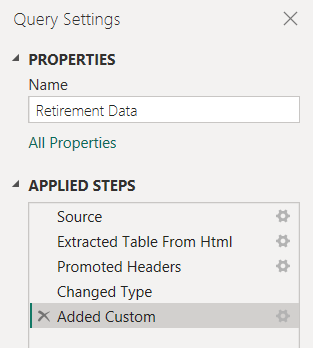
In Query Settings, the APPLIED STEPS list now shows the new Added Custom step we just defined.
Adjust the data
Before we work with this query, let's make a few changes to adjust its data:
Adjust the rankings by removing a column.
For example, assume Weather isn't a factor in our results. Removing this column from the query doesn't affect the other data.
Fix any errors.
Because we removed a column, we need to adjust our calculations in the New score column by changing its formula.
Sort the data.
Sort the data based on the New score column, and compare to the existing Rank column.
Replace the data.
We'll highlight how to replace a specific value and how to insert an applied step.
These changes are described in the following steps.
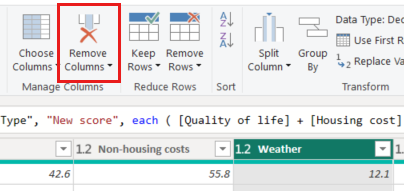
To remove the Weather column, select the column, choose the Home tab from the ribbon, and then choose Remove Columns.
Note
The New score values haven't changed, due to the ordering of the steps. Power Query Editor records the steps sequentially, yet independently, of each other. To apply actions in a different sequence, you can move each applied step up or down.
Right-click a step to see its context menu.
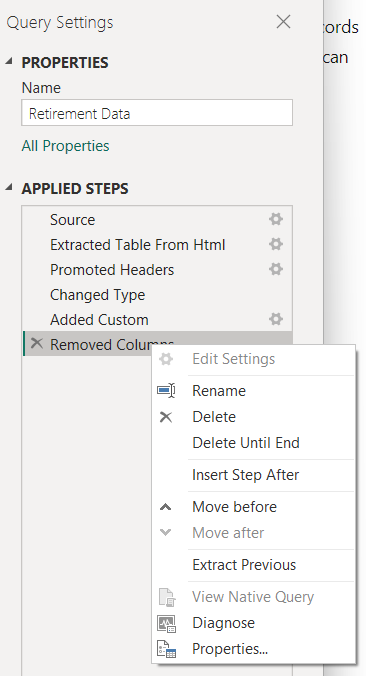
Select Move before from the context menu to move up the last step, Removed Columns, to just above the Added Custom step. You can also use the mouse to move a step to the desired position.
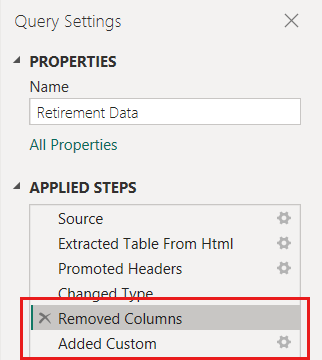
Select the Added Custom step.
Notice the New score column now shows Error rather than the calculated value.
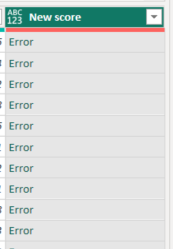
There are several ways to get more information about each error. If you select the cell without clicking on the word Error, Power Query Editor displays the error information.
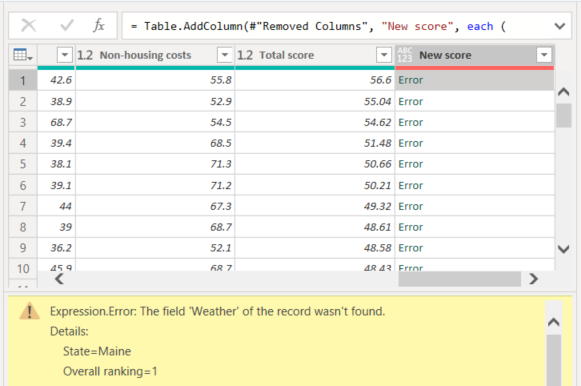
If you select the word Error directly, Power Query Editor creates an Applied Step in the Query Settings pane and displays information about the error. Because we don't need to display error information anywhere else, select Cancel.
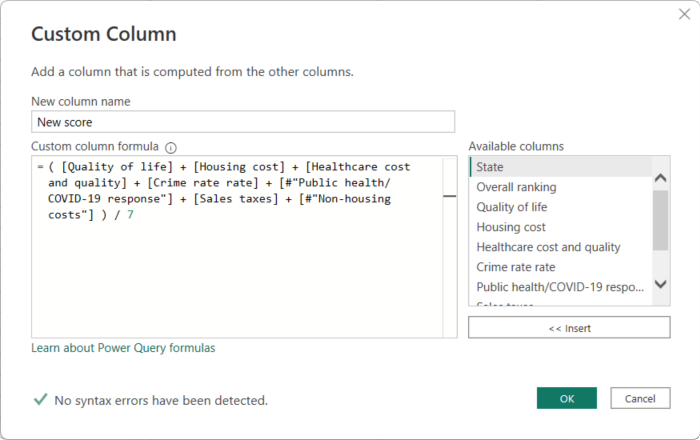
To fix the errors, there are two changes needed: removing the Weather column name and changing the divisor from 7 to 6. You can make these changes in two ways:
Right-click the Added Custom step and select Edit Settings, or click on the gear icon next to the name of the step to bring up the Custom Column dialog you used to create the New score column. Edit the formula as described previously, until it looks like this:
Select the New score column, then display the column's data formula by enabling the Formula Bar checkbox from the View tab.
Edit the formula as described previously, until it looks like this, then press Enter.
= Table.AddColumn(#"Removed Columns", "New score", each ( [Quality of life] + [Cost of housing] + [Public health] + [Crime] + [Taxes] + [#"Non-housing cost of living"] ) / 6)
Power Query Editor replaces the data with the revised values and the Added Custom step completes with no errors.
Note
You can also select Remove Errors, by using the ribbon or the right-click menu, which removes any rows that have errors. However, in this tutorial we want to preserve all the data in the table.
Sort the data based on the New score column. First, select the last applied step, Added Custom to display the most recent data. Then, select the dropdown located next to the New score column header and choose Sort Descending.
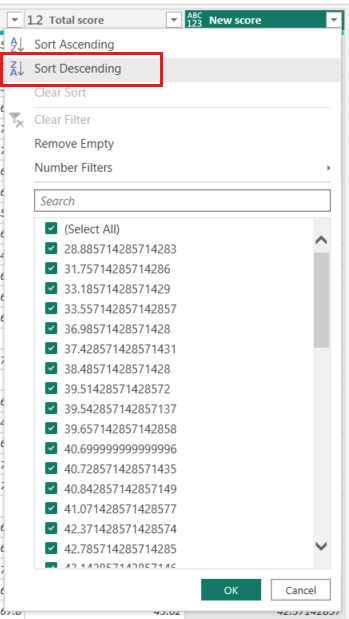
The data is now sorted according to New score. You can select an applied step anywhere in the list, and continue shaping the data at that point in the sequence. Power Query Editor automatically inserts a new step directly after the currently selected applied step.
In APPLIED STEPS, select the step preceding the custom column, which is the Removed Columns step. Here we'll replace the value of the Cost of housing ranking in Oregon. Right-click the appropriate cell that contains Oregon's Cost of housing value, and then select Replace Values. Note which Applied Step is currently selected.
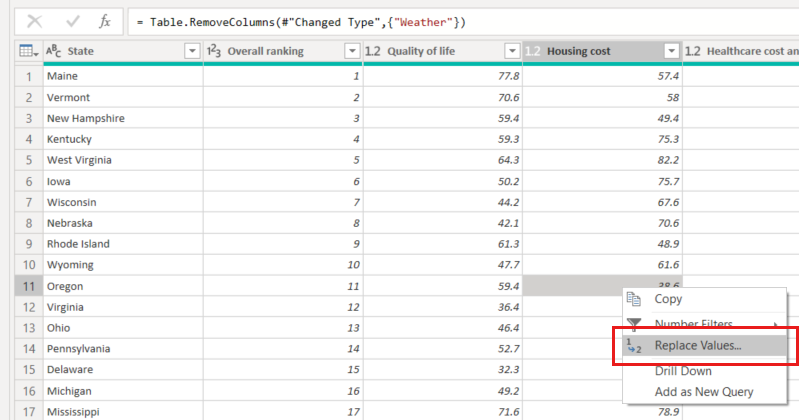
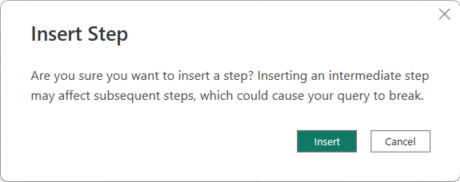
Select Insert.
Because we're inserting a step, Power Query Editor reminds us that subsequent steps could cause the query to break.
Change the data value to 100.0.
Power Query Editor replaces the data for Oregon. When you create a new applied step, Power Query Editor names it based on the action, in this case, Replaced Value. If you have more than one step with the same name in your query, Power Query Editor appends an increasing number to each subsequent applied step's name.
Select the last Applied Step, Sorted Rows.
Notice the data has changed regarding Oregon's new ranking. This change occurs because we inserted the Replaced Value step in the correct location, before the Added Custom step.
We’ve now shaped our data to the extent we need to. Next let’s connect to another data source, and combine data.
Combine data
The data about various states is interesting, and will be useful for building further analysis efforts and queries. However, most data about states uses a two-letter abbreviation for state codes, not the full name of the state. We need a way to associate state names with their abbreviations.
There's another public data source that provides that association, but it needs a fair amount of shaping before we can connect it to our retirement table. To shape the data, follow these steps:
From the Home ribbon in Power Query Editor, select New Source > Web.
Enter the address of the website for state abbreviations, https://en.wikipedia.org/wiki/List_of_U.S._state_and_territory_abbreviations, and then select OK.
The Navigator displays the content of the website.
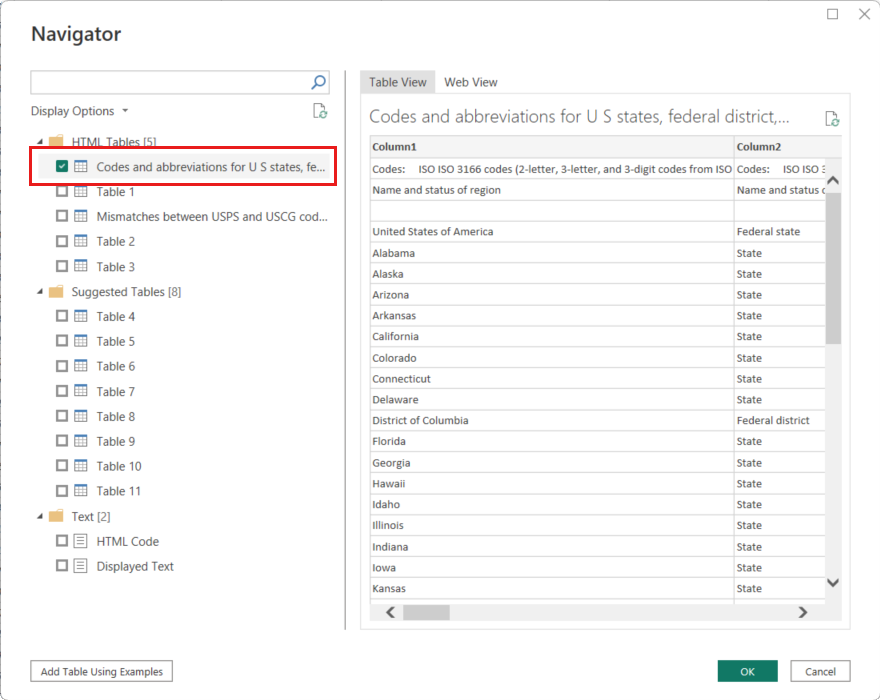
Select Codes and abbreviations for U.S. states, federal district, territories, and other regions.
Tip
It will take a bit of shaping to pare this table’s data down to what we want. Is there a faster or easier way to accomplish the following steps? Yes, we could create a relationship between the two tables, and shape the data based on that relationship. The following example steps are helpful to learn for working with tables. However, relationships can help you quickly use data from multiple tables.
To get the data into shape, follow these steps:
Remove the top row. Because it's a result of the way that the webpage’s table was created, we don’t need it. From the Home ribbon, select Remove Rows > Remove Top Rows.

The Remove Top Rows dialog appears. Specify 1 row to remove.
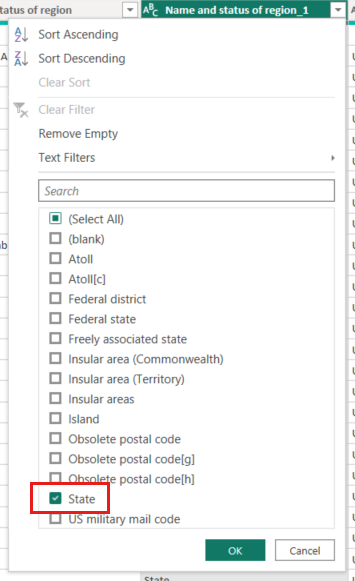
Because the Retirement Data table doesn't have information for Washington DC or territories, we need to filter them from our list. Select the Status of region column's dropdown, then clear all checkboxes except State and State (officially Commonwealth).
Remove all unneeded columns. Because we need only the mapping of each state to its official two-letter abbreviation (Name and ANSI columns), we can remove the other columns. First select the Name column, then hold down the CTRL key and select the ANSI column. From the Home tab on the ribbon, select Remove Columns > Remove Other Columns.

Note
The sequence of applied steps in Power Query Editor is important, and affects how the data is shaped. It’s also important to consider how one step might impact another subsequent step. For example, if you remove a step from the applied steps, subsequent steps might not behave as originally intended.
Note
When you resize the Power Query Editor window to make the width smaller, some ribbon items are condensed to make the best use of visible space. When you increase the width of the Power Query Editor window, the ribbon items expand to make the most use of the increased ribbon area.
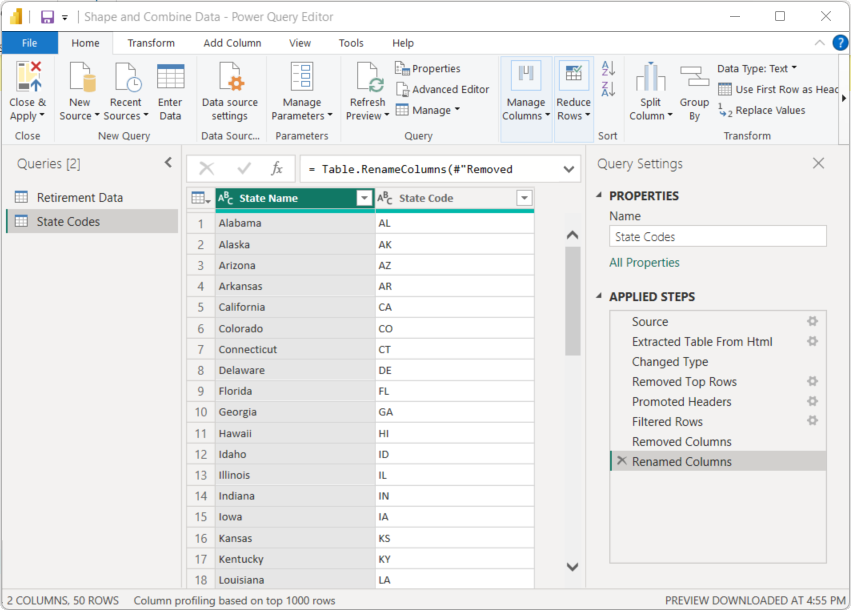
Rename the columns and the table. There are a few ways to rename a column: First select the column, then either select Rename from the Transform tab on the ribbon, or right-click and select Rename. The following image shows both options, but you only need to choose one.
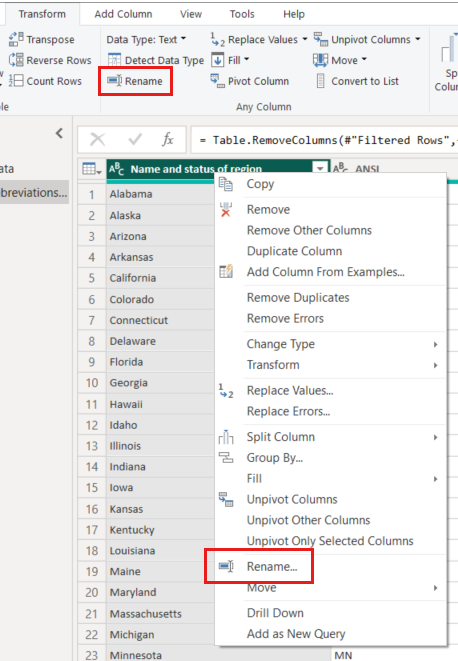
Rename the columns to State Name and State Code. To rename the table, enter State Codes in the Name field in the Query Settings pane.
Combine queries
Now that we’ve shaped the State Codes table the way we want, let’s combine these two tables, or queries, into one. Because the tables we now have are a result of the queries we applied to the data, they’re often referred to as queries.
There are two primary ways of combining queries: merging and appending.
- For one or more columns that you’d like to add to another query, you merge the queries.
- For one or more rows of data that you’d like to add to an existing query, you append the query.
In this case, we want to merge the queries:
From the left pane of Power Query Editor, select the query into which you want the other query to merge. In this case, it's Retirement Data.
Select Merge Queries > Merge Queries from the Home tab on the ribbon.

You might be prompted to set the privacy levels, to ensure the data is combined without including or transferring data you don't want transferred.
The Merge window appears. It prompts you to select which table you'd like merged into the selected table, and the matching columns to use for the merge.
Select State from the Retirement Data table, then select the State Codes query.
When you select a matching column, the OK button is enabled.
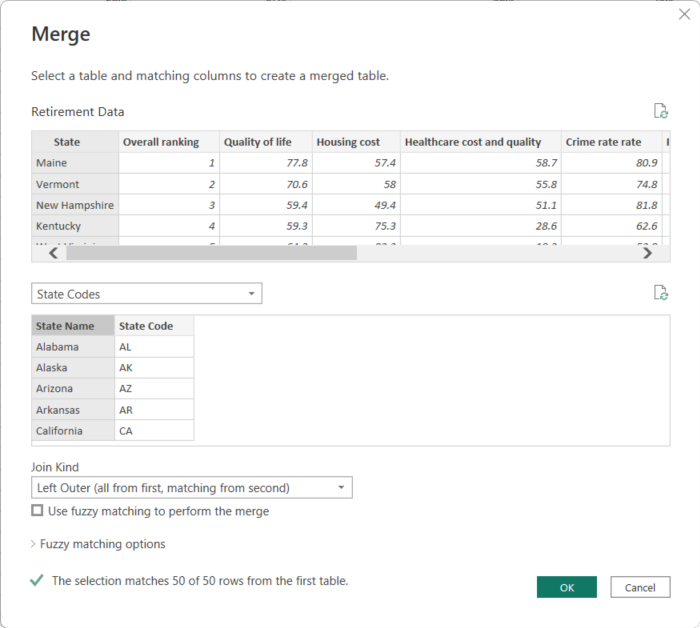
Select OK.
Power Query Editor creates a new column at the end of the query, which contains the contents of the table (query) that was merged with the existing query. All columns from the merged query are condensed into the column, but you can Expand the table and include whichever columns you want.
To expand the merged table, and select which columns to include, select the expand icon (
 ).
).The Expand window appears.
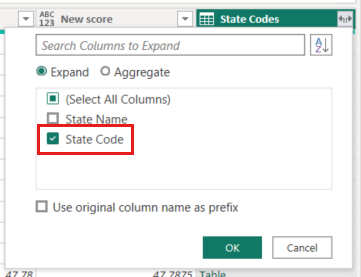
In this case, we want only the State Code column. Select that column, clear Use original column name as prefix, and then select OK.
If we had left the checkbox selected for Use original column name as prefix, the merged column would be named State Codes.State Codes.
Note
If you want to explore how to bring in the State Codes table, you can experiment a bit. If you don’t like the results, just delete that step from the APPLIED STEPS list in the Query Settings pane, and your query returns to the state prior to applying that Expand step. You can do this as many times as you like until the expand process looks the way you want it.
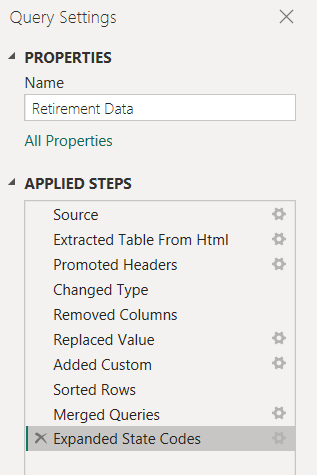
We now have a single query (table) that combines two data sources, each of which was shaped to meet our needs. This query can be a basis for interesting data connections, such as housing cost statistics, quality of life, or crime rate in any state.
To apply your changes and close Power Query Editor, select Close & Apply from the Home ribbon tab.
The transformed semantic model appears in Power BI Desktop, ready to be used for creating reports.
Related content
For more information on Power BI Desktop and its capabilities, see the following resources:
