Create a paginated report for Power BI Report Server
In this article, you create a paginated report for Power BI Report Server in a few simple steps.
Looking for help with creating paginated reports in Report Builder for the Power BI service? See Power BI Report Builder instead.
As the name suggests, paginated reports can run to many pages. They're laid out in a fixed format and offer precise customization. Paginated reports are .rdl files.
You can store and manage paginated reports in the Power BI Report Server web portal, just as you can in the SQL Server Reporting Services (SSRS) web portal. You create and edit them in Report Builder or Report Designer in SQL Server Data Tools (SSDT), then publish them to either web portal. Then report readers in your organization can view them in a browser or in a Power BI mobile app on their mobile device.
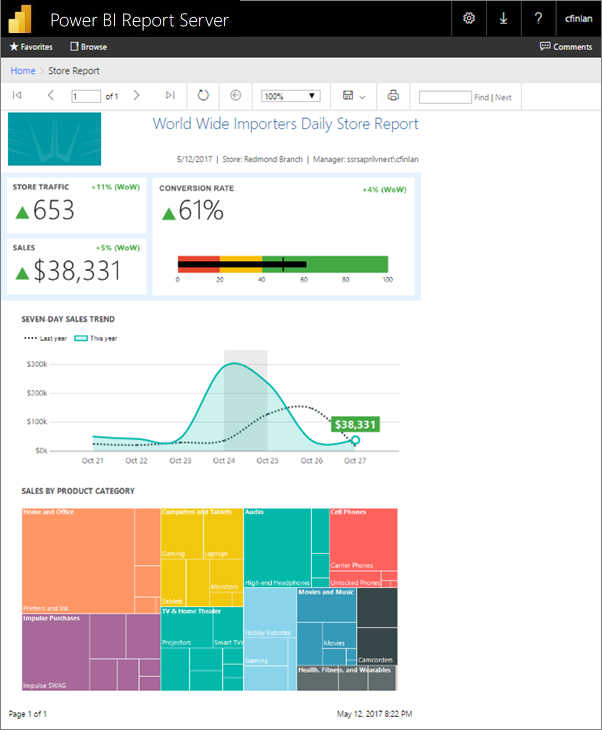
If you've already created paginated reports in Report Builder or Report Designer, then you're ready to create paginated reports for Power BI Report Server. If not, here are some quick steps to get you started.
Step 1: Start Report Builder
You may already have installed Report Builder to create reports for an SSRS server. You can use the same version or Report Builder to create reports for Power BI Report Server. If you haven't installed it, the process is easy.
In the Power BI Report Server web portal, select New > Paginated Report.
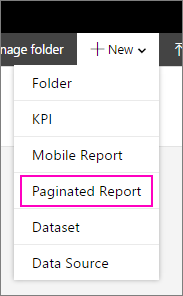
If you don't have Report Builder installed already, it leads you through the installation process now.
After it's installed, Report Builder opens to the New Report or Dataset screen.
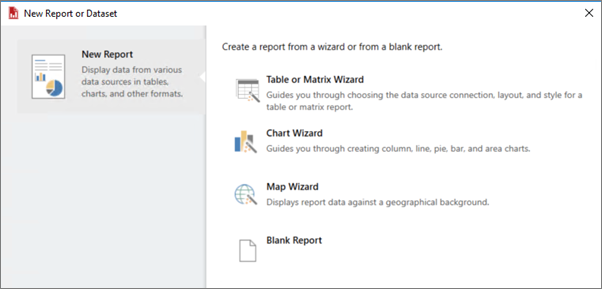
Select the wizard for the kind of report you want to create:
- Table or matrix
- Chart
- Map
- Blank
Let's start with the Chart wizard.
The Chart wizard walks you the steps of creating a basic chart in a report. From there, you can customize your report in almost unlimited ways.
Step 2: Go through the Chart wizard
The Chart wizard walks you through the basic steps of creating a visualization in a report.
Paginated reports can connect to a wide variety of data sources, from Microsoft SQL Server and Microsoft Azure SQL Database to Oracle, Hyperion, and many more. Read about data sources supported by paginated reports.
In the first page in the Chart wizard, Choose a dataset, you can create a dataset or choose a shared dataset on a server. Datasets return report data from a query on an external data source.
Select Browse > select a shared dataset on a server > Open > Next.
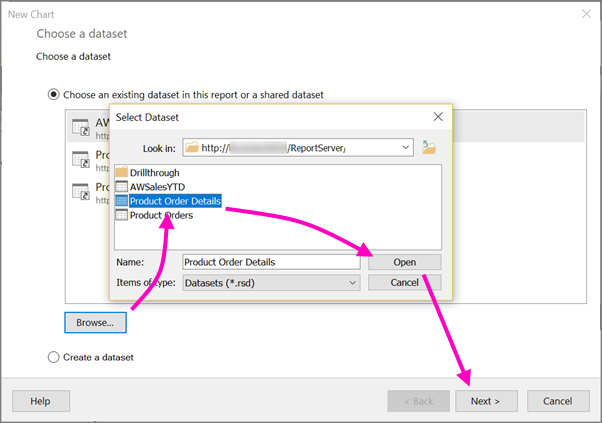
Need to create a dataset? See Create a shared or embedded dataset.
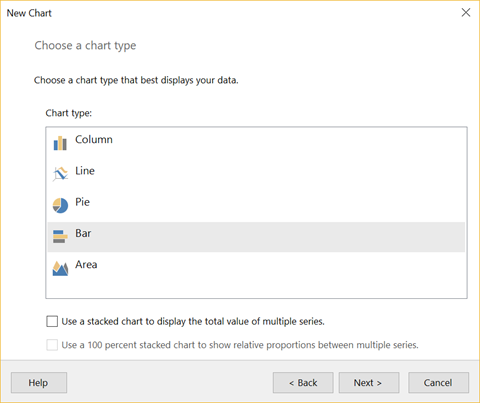
Choose a chart type -- in this case, a bar chart.
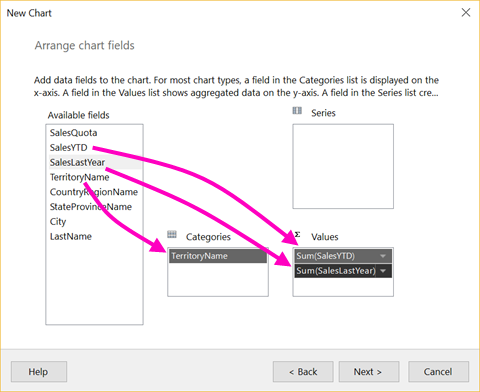
Arrange the fields by dragging them to the Categories, Series, and Values boxes.
Select Next > Finish.
Step 3: Design your report
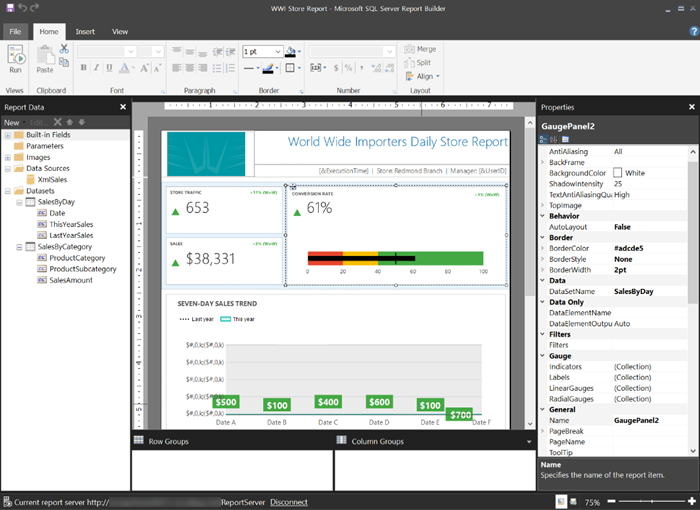
Now you're in Report Design view. Notice the data is placeholder data, not your data.
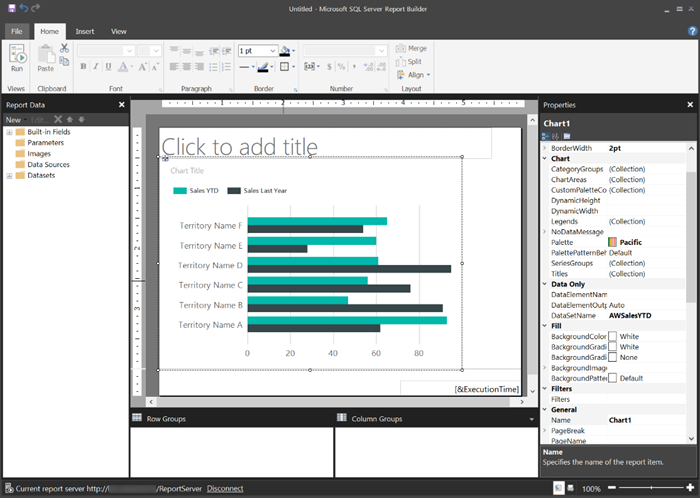
To view your data, select Run.
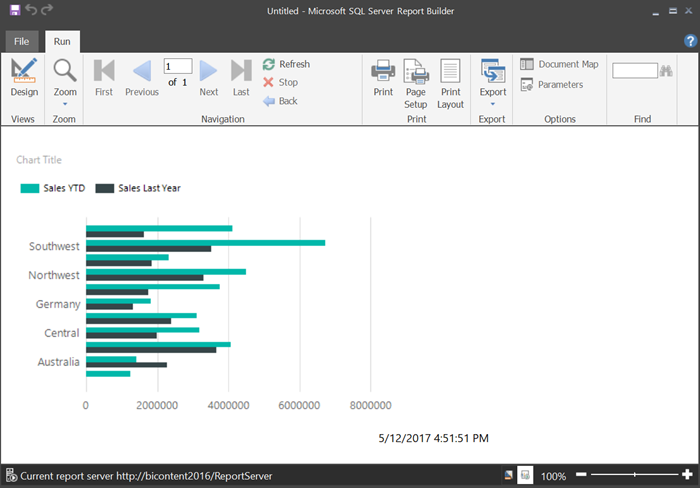
To go back to Design view, select Design.
You can modify the chart you just created, changing the layout, values, legend... really just about anything.
And you can add all sorts of other visualizations: gauges, tables, matrixes, tables, maps, and more. You can add headers and footers for multiple pages. See the Report Builder tutorials to try them for yourself.
Step 4: Save your report to the report server
When your report is ready, save it to Power BI Report Server. You can start in the report server and upload it, or you can start in Microsoft Report Builder, and save it.
However, you can't start in Power BI Report Builder and save it. Use the upload to the report server option instead.
Upload to the report server
In the report server, select Upload.
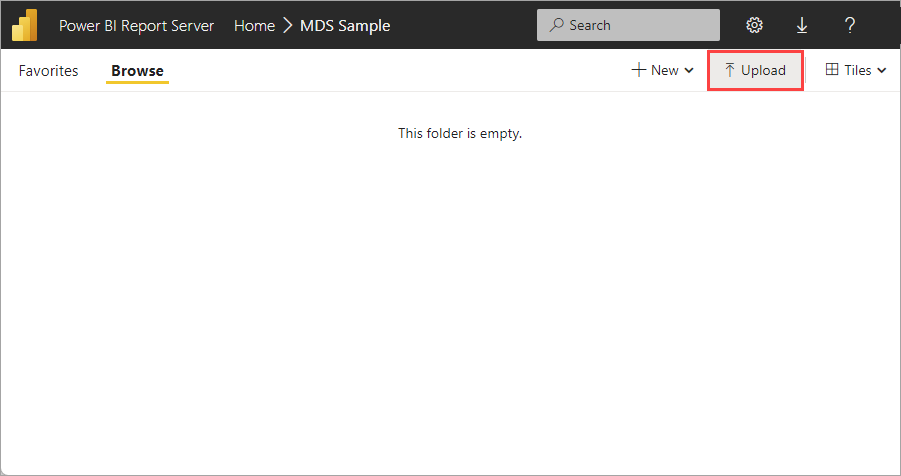
Browse to the paginated report and select Open.
Save As from Microsoft Report Builder
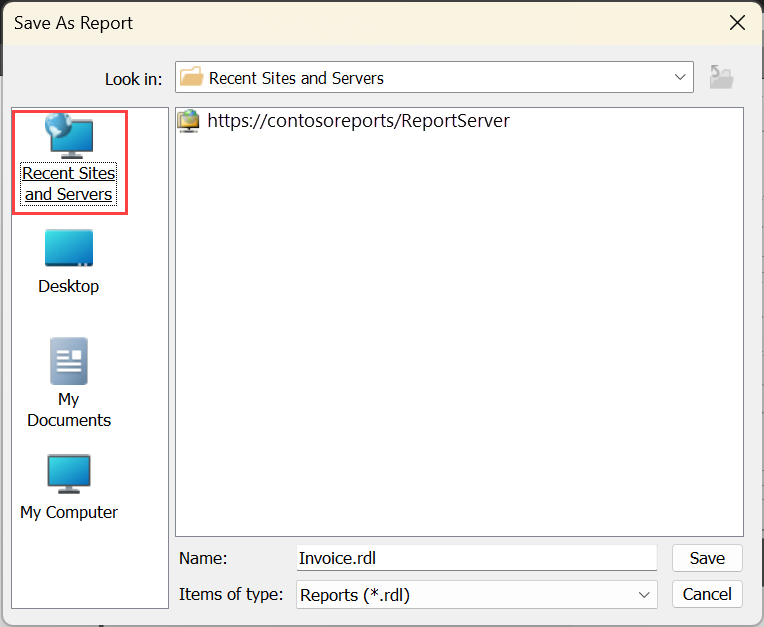
On the File menu in Microsoft Report Builder, select Save As.
Select Recent Sites and Servers, select the server, and select Save.
Whether you upload it or save it, now you can view it in the browser.

Related content
There are many great resources for designing reports in Report Builder and in Report Designer in SQL Server Data Tools. The Report Builder tutorials are a good place to start.
More questions? Try asking the Power BI Community