Isolate a performance issue (C#, Visual Basic, F#)
In this article, you'll learn how you can use profiling tools to investigate performance issues and isolate problem areas.
Rather than providing step-by-step instructions, the intent here is to show you how to use the profiling tools effectively and how to interpret the data. Like the CPU Usage tool, the .NET Counters tool is also a good starting point for a performance investigation. Once you identify interesting data, you can use other profiling tools to investigate more deeply. To compare tools, see Which tool should I choose?
About the example app
The screenshots in this article are based on an ASP.NET app that runs queries against a simulated database. The example is based on the Diagnostics Sample.
Start an investigation
- Start your investigation by watching .NET counter metrics while collecting performance data.
- Next, for additional insights to help isolate issues, consider collecting a trace using one of the other profiling tools, such as the CPU Usage tool, the Instrumentation tool, and others.
Data collection requires the following steps (not shown in this article):
- Set your app to a Release build.
- Select the .NET Counters tool from the Performance Profiler (Alt+F2). (Later steps involve the Instrumentation tool.)
- From the Performance Profiler, start the app.
Check performance counters
While running the app, view the counters in the .NET Counters tool. For initial investigations, a few key metrics to keep an eye on include:
CPU Usage. Watch this counter to see whether a performance issue occurs with high or low CPU usage. This can be a clue to specific types of performance issues. For example:- With high CPU usage, use the CPU Usage tool to identify areas where you may be able to optimize code. For a tutorial on this, see Beginner's guide to optimizing code.
- With low CPU usage, use the Instrumentation tool to identify call counts and average function time based on wall clock time. This may help you to identify issues such as contention or thread pool starvation.
Allocation Rate. For a web app serving requests, the rate should be fairly steady.GC Heap Size. Watch this counter to see if memory usage is growing continually and potentially leaking. If it seems high, you can use one of the memory usage tools.Threadpool Thread Count. For a web app serving requests, watch this counter to see if the thread count is holding steady or rising at a steady rate.
Here's an example showing how the CPU Usage is low, while the ThreadPool Thread Count is relatively high.

A steadily rising thread count with a low CPU usage can be an indicator of thread pool starvation. The thread pool is forced to keep spinning new threads. Thread pool starvation occurs when the pool has no available threads to process new work items and it often causes applications to respond slowly.
Based on the low CPU usage and the relatively high thread count, and working on the theory of a possible case of thread pool starvation, switch to using the Instrumentation tool.
Investigate call counts and timing data
Let's take a look at a trace from the Instrumentation tool to see if we can try to find out more about what is happening with the threads.
When the diagnostic data loads, first check the initial .diagsession report page that shows Top Insights and the Hot Path. In the Instrumentation trace, the Hot Path shows the code path with longest function times in your app. These sections may provide tips to help you quickly identify performance issues that you can improve.
In the collected trace, use the Open details link in the report and then select Flame Graph.
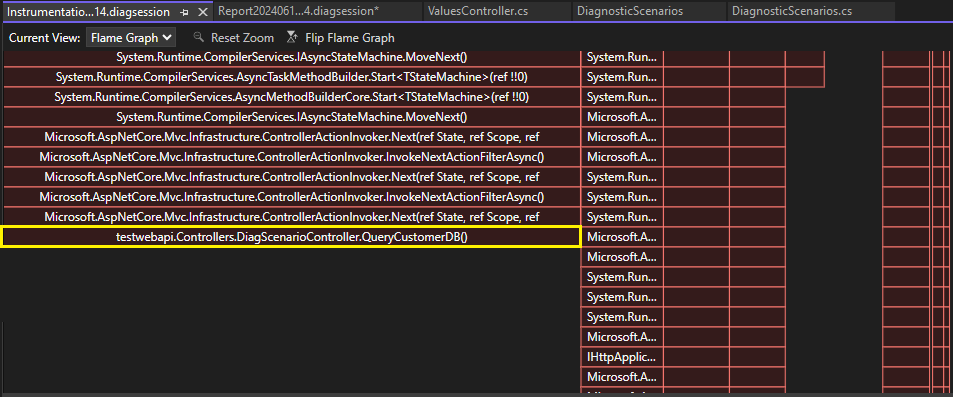
The Flame Graph visualization shows us that the QueryCustomerDB function is responsible for a significant portion of the app's running time.
Right-click the QueryCustomerDB function and choose View in Call Tree.

In the Call Tree view, you see that the Hot Path (flame icon) includes the QueryCustomerDB function, which points to a potential performance issue.
Relative to time spent in other functions, the Self and Avg Self values for the QueryCustomerDB function are very high. Unlike Total and Avg Total, the Self values exclude time spent in other functions, so this is a good place to look for the performance bottleneck.
Tip
If the Self values were relatively low instead of high, you would probably want to look at the actual queries called by the QueryCustomerDB function.
Double-click the QueryCustomerDB function to show the source code for the function.
public ActionResult<string> QueryCustomerDB()
{

    Task dbTask = QueryCustomerFromDbAsync("Dana");
    return "success:tasksleepwait";
}
With a little research, we discover that this code is calling an async API without using await. This is the sync-over-async code pattern, which is a common cause of threadpool starvation, and may block threads.
To resolve, use await.
public async Task<ActionResult<string>> TaskAsyncWait()
{
    Customer c = await PretendQueryCustomerFromDbAsync("Dana");
    return "success:taskasyncwait";
}
If you see performance issues related to database queries, you can use the Database tool to investigate whether certain calls are slower. This data might indicate an opportunity to optimize queries. For a tutorial that shows how to use the Database tool to investigate a performance issue, see Beginner's guide to optimizing code. The Database tool supports .NET Core with either ADO.NET or Entity Framework Core.
To get visualizations in Visual Studio for individual thread behavior, you can use the Parallel Stacks window while debugging. This window shows individual threads along with information about threads that are waiting, threads they're waiting on, and deadlocks.
For additional information on thread pool starvation, see Detecting threadpool starvation.
Next steps
The following articles and blog posts provide more information to help you learn to use the Visual Studio performance tools effectively.
- Beginner's guide to optimizing code
- Case Study: Double performance in under 30 minutes
- Improving Visual Studio performance with the new Instrumentation Tool
Related content
प्रतिक्रिया
जल्द आ रहा है: 2024 के दौरान हम सामग्री के लिए फीडबैक तंत्र के रूप में GitHub मुद्दों को चरणबद्ध तरीके से समाप्त कर देंगे और इसे एक नई फीडबैक प्रणाली से बदल देंगे. अधिक जानकारी के लिए, देखें: https://aka.ms/ContentUserFeedback.
के लिए प्रतिक्रिया सबमिट करें और देखें