Note
Access to this page requires authorization. You can try signing in or changing directories.
Access to this page requires authorization. You can try changing directories.
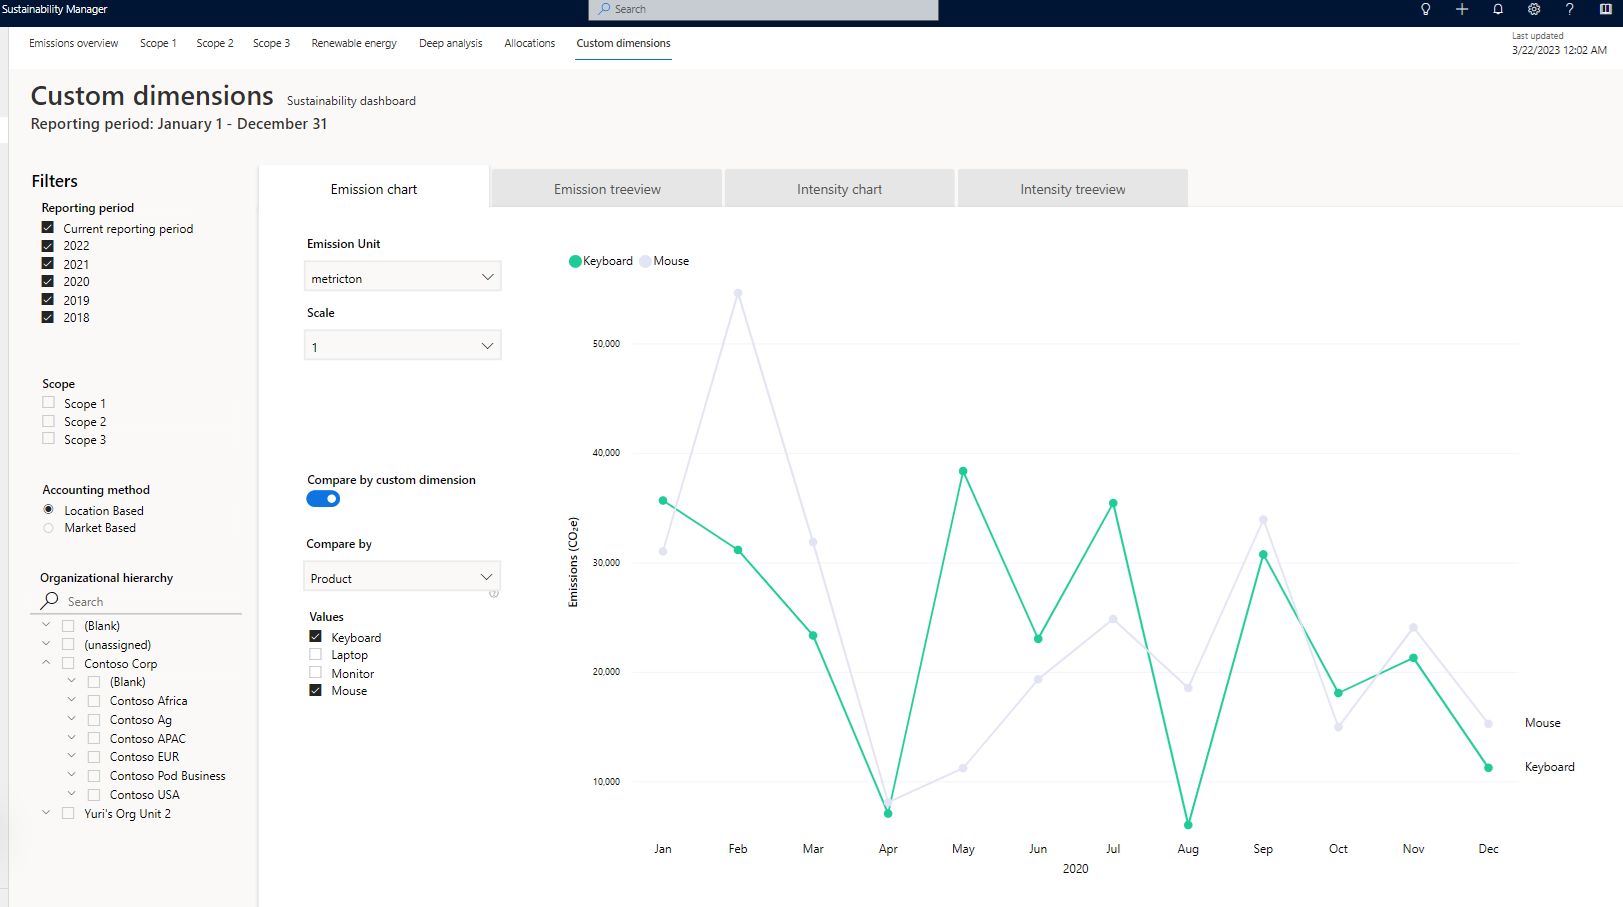
Microsoft Sustainability Manager emission analytics offers a dedicated Custom dimensions report tab that provides the following capabilities:
View a time chart of CO2E emissions broken out by custom dimension strings. For example, compare emissions by Product type, where Product type is a custom dimension with string values.
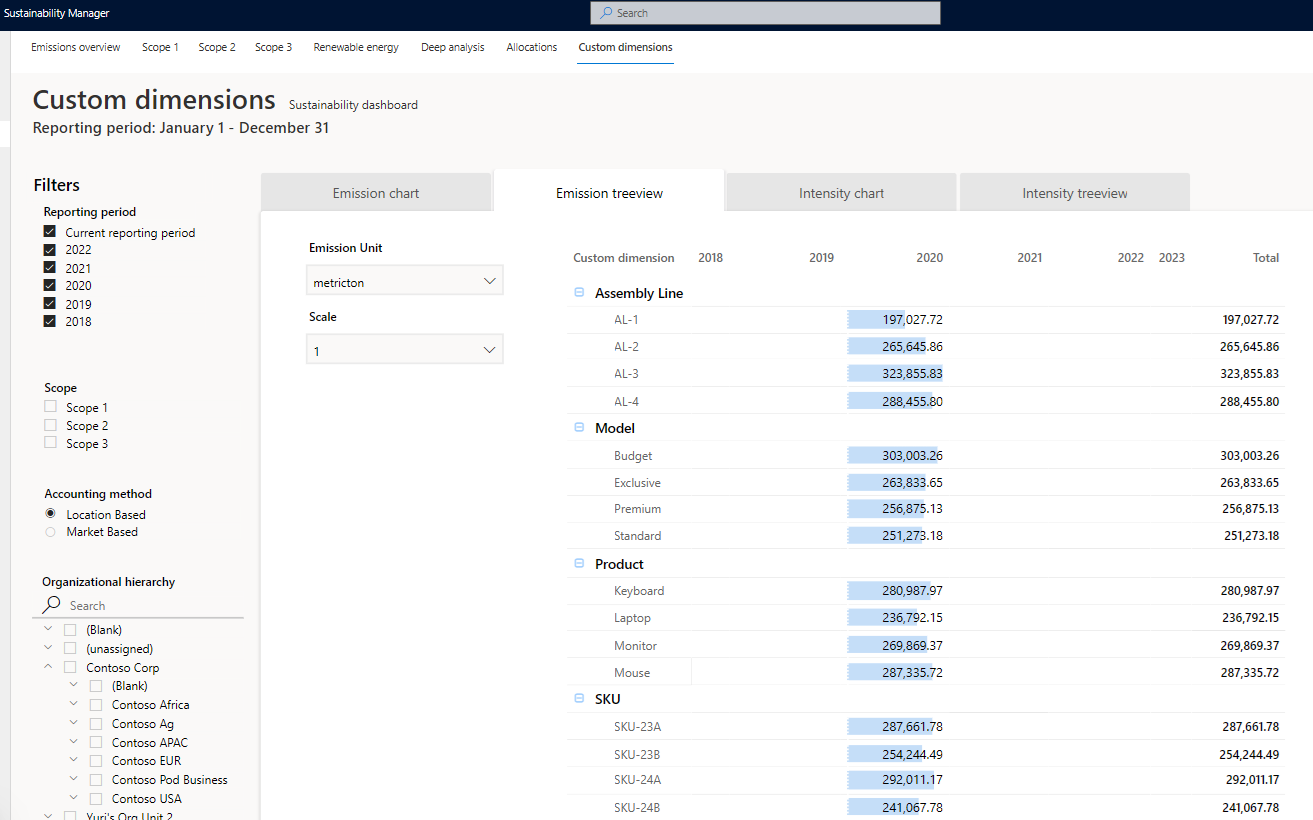
View a tree view of total CO2E emissions, where you can drill into each string custom dimension present in the data and view CO2E emissions by value.
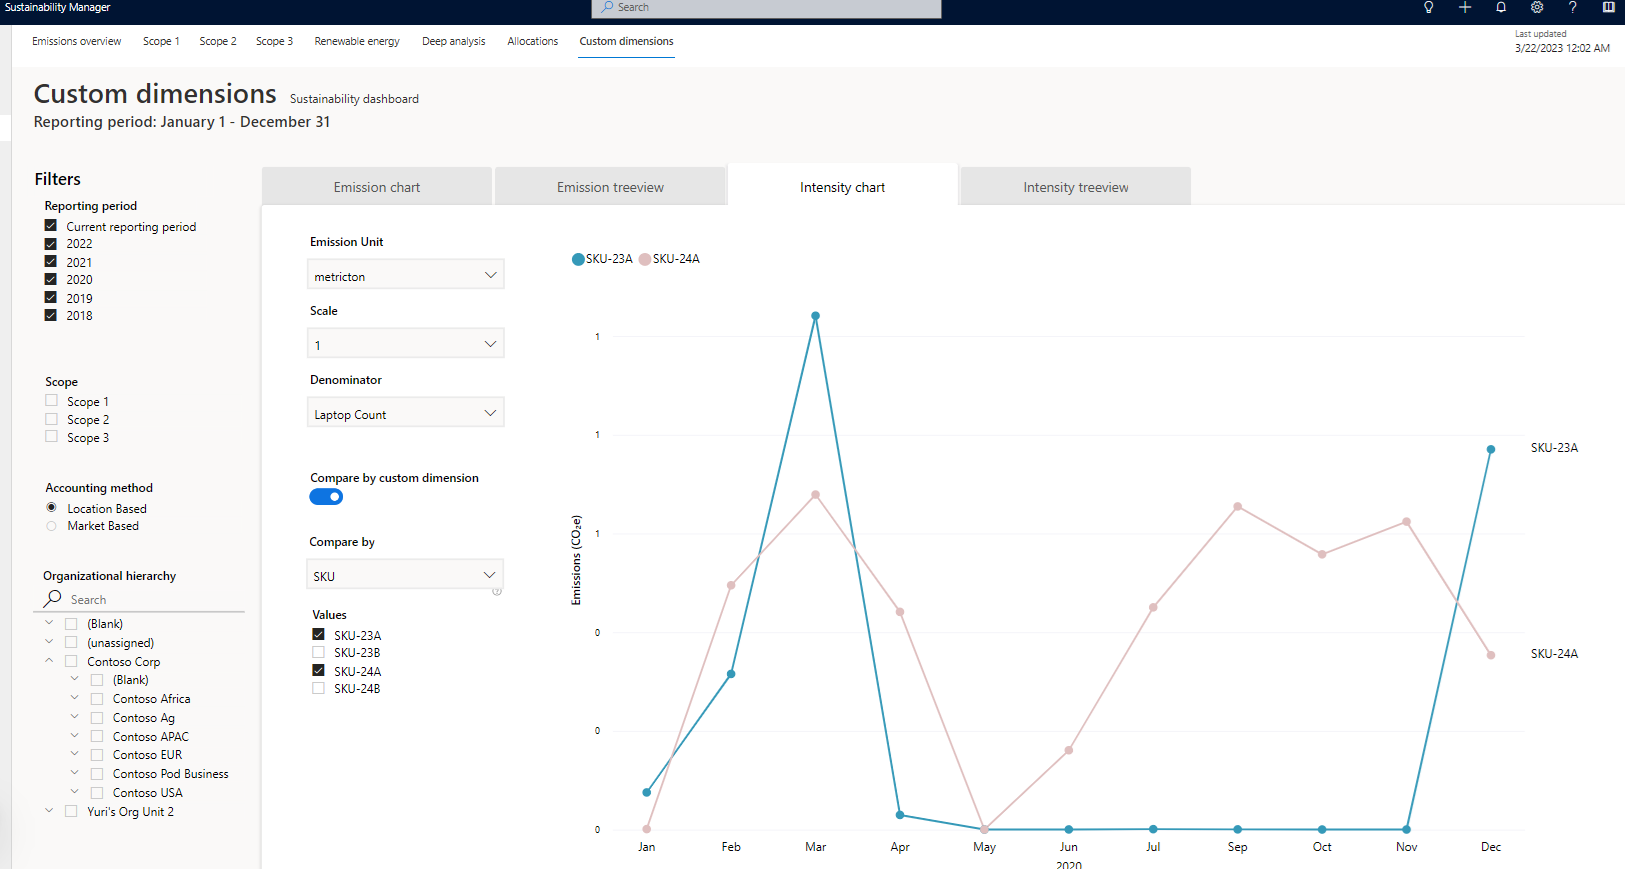
View a time chart of CO2E emissions intensity broken out by custom dimension strings, where the intensity denominator is a numeric custom dimension you select. For example, compare intensity of CO2e emissions per Product quantity by Product type, where Product quantity is a numeric custom dimension and Product type is a custom dimension with string values.
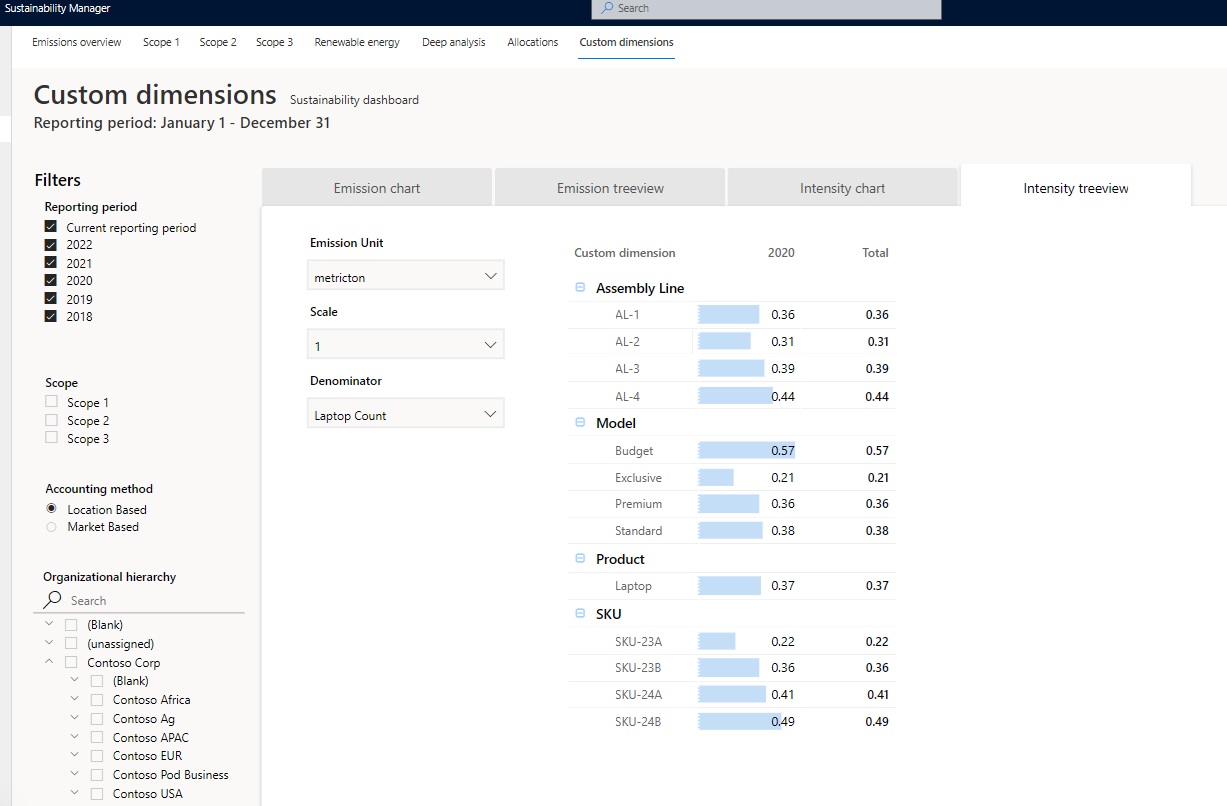
View a tree view of total CO2E emission intensity, where the intensity denominator is a numeric custom dimension you select. You can drill into each string custom dimension present in the data and view CO2E emission intensity associated with each unique string value.
Related information
- Extend the Cloud for Sustainability data model with custom dimensions
- Use custom dimensions in calculations
- Analytics
