Nota
L'accesso a questa pagina richiede l'autorizzazione. È possibile provare ad accedere o modificare le directory.
L'accesso a questa pagina richiede l'autorizzazione. È possibile provare a modificare le directory.
Wait statistics are information that might help you understand why the query duration is long and identify the queries that are waiting for something in database engine. In this post, I will show to you how to identify why the workload is waiting and what are the queries that are waiting on some resources.
Azure SQL Managed Instance enables you to find why the queries are waiting for some resources using the following views:
- sys.dm_os_wait_stats that returns instance level wait statistics
- sys.query_store_wait_stats that returns query-plan wait statistics per database.
These information can be found using DMO/Query store. However, to make the the analysis easier, I'm using free/open-source QPI library. This library is not a prerequisite, but it makes analysis easier because it has pre-defined views that join all necessary Query Store views to fetch the information. Since this library is open-source you can copy-paste the query examples from the views and use them even without installing the whole library.
In addition, it takes the snapshots of the wait stats and enables you to see wait statistics in the past.
To install QPI library go to the installation section and download the SQL script for your version of SQL Server (it supports Azure SQL/SQL Server 2016+ because it depends on Query Store views).
Analyze wait statistics
First thing that you need to do is to take a snapshot of the wait statistics or at least reset them because sys.dm_os_wait_stats collects wait statistics since the instance start or the last time you reset the stats. In QPI, you can use the following procedure to reset the wait statistics:
exec qpi.snapshot_wait_stats
This procedure will reset wait statistics on your instance and the Managed Instance will start collecting new wait statistics.
While your workload is running, you can read the wait statistics values from the qpi.wait_stats view:
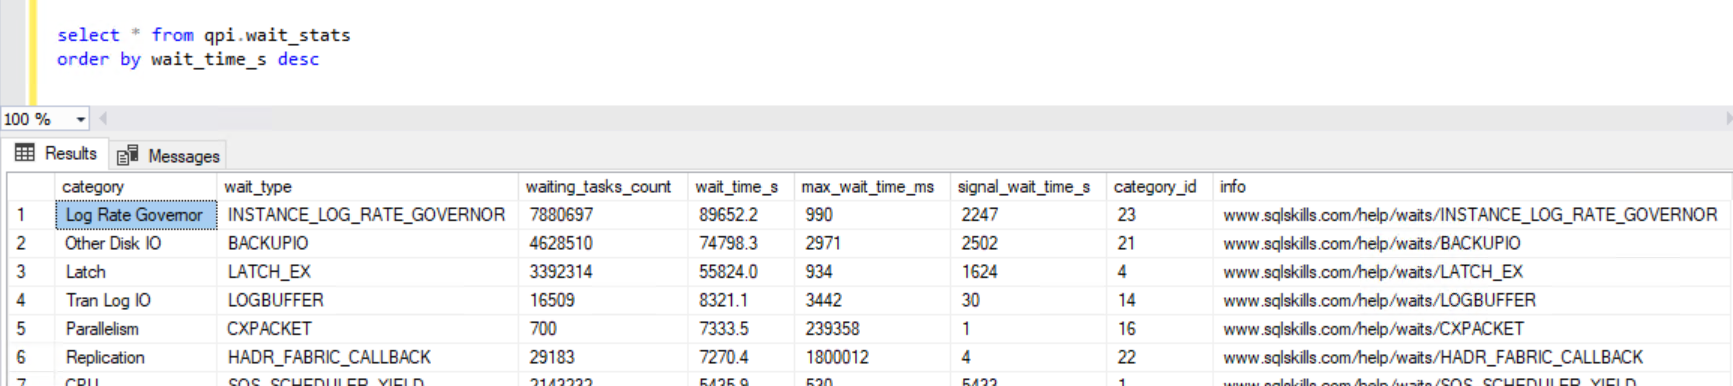
This view returns wait statistics and also their categories. Here you can see that the main wait statistic on my instance is INSTANCE_LOG_RATE_GOVERNOR categorized as Log Rate Governor. If you don't know what is some wait statistic, you can follow the URL in info column and go to sqlskills site to find more details.
The category is important because if you want to find the queries affected by the wait type you need to use category in Query Store and not actual wait type name. Wait statistics in query store are not recorded per wait type.
There is a mapping logic between wait types and wait categories that is documented on SQL Server documentation and these rules are added in this library. This is important because this is the only link between global wait statistics and query store wait statistics.
If you want to see top queries affected by this wait category, you can use qpi.db_query_wait_stats view and filter the wait statistics per category:
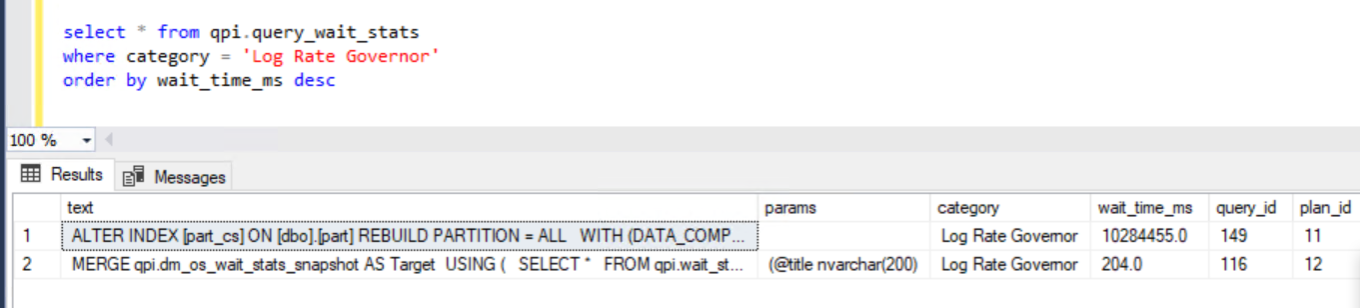
In this case you can see that I'm hitting log rate limit on the Managed Instance and that this is probably caused by rebuild index statement. If you have multiple databases, you need to run this query in each of them because Query Store is configured per database.
These views can enable you to easily troubleshoot the issues on your instance and drill down to the queries that might cause problems or the queries that are affected by some wait type.
QPI is open-source library that is not official part of SQL Server/Azure SQL Db scripts. If you find any issue in this library you can file a bug or submit the PR with the change.