Core utilization: idle time
Use this topic to identify underutilized CPU cores or threads. If all CPU cores aren't performing useful work 100 percent of the time, there's room for improvement. If you can identify sections of idle time, fill them with work, and then ensure that independent tasks are running parallel, it can result in significant performance gains for your title. Luckily, it's easy to find idle time on a core. Identifying these locations helps determine if the title is needlessly blocking or has spare cycles to handle other work.
Performance Investigator for Xbox (PIX)
The timeline view in Performance Investigator for Xbox (PIX) shows how the CPU cores are being used, and the occupancy of individual threads on those cores. Use the following steps to investigate threads.
Follow the steps in the Common steps topic to create a Timing Capture.
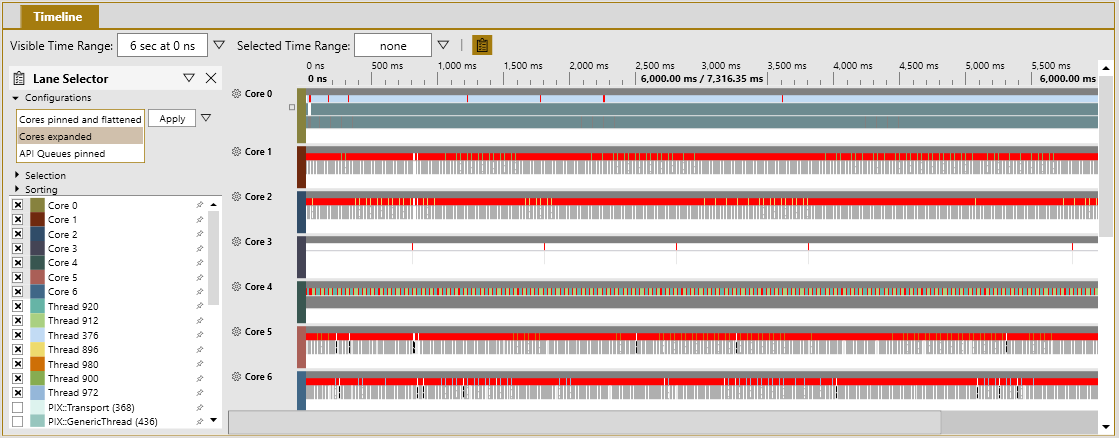
Starting with a zoomed-out view, review sections where a CPU core timeline is mostly empty, indicating that it isn't executing code. As shown in figure 1, core three isn't performing any work.
Figure 1. Shows a PIX Timing Capture displaying the CPU timelines with CPU 3 idle
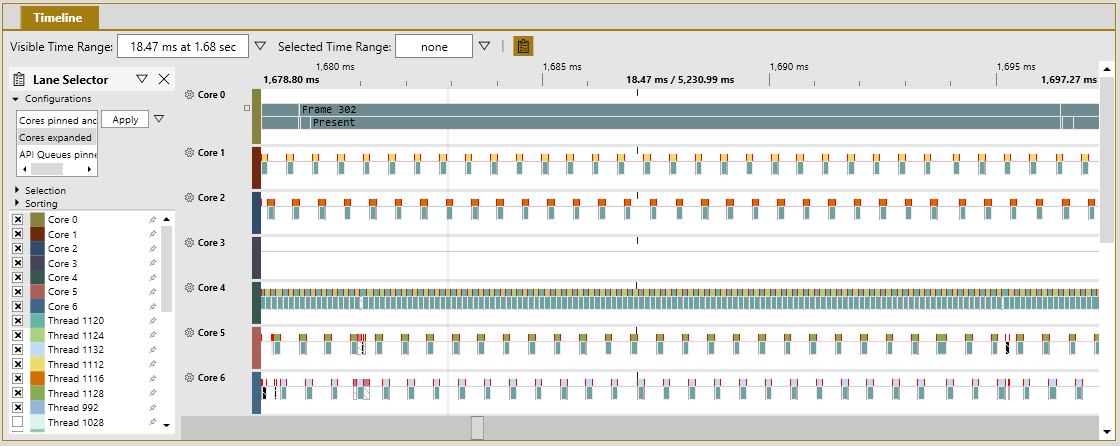
Zoom in until you get to a frame that you want to investigate. Pix is zoomed into a single frame of an example that's running at 60 frames per second (FPS) as shown in figure 2.
Figure 2. Shows a PIX Timing Capture that's zoomed to a single frame that shows an idle core and low-utilization cores
Note
Double-clicking on an element in the PIX timeline automatically zooms the view to the duration of that element, such as the Frame 302 marker in figure 2.
In figure 2, cores zero and four have their timelines filled, which means that they're running close to 100 percent. Cores one, two, five, and six have empty spaces and are running at approximately 25 percent.
Review individual thread behaviors in the thread timelines. You can focus on a thread that you think should be running close to 100 percent, as shown in figure 3.
Figure 3. Shows zooming into 4 ms of the thread timelines and the stalls that are on each thread, except 992
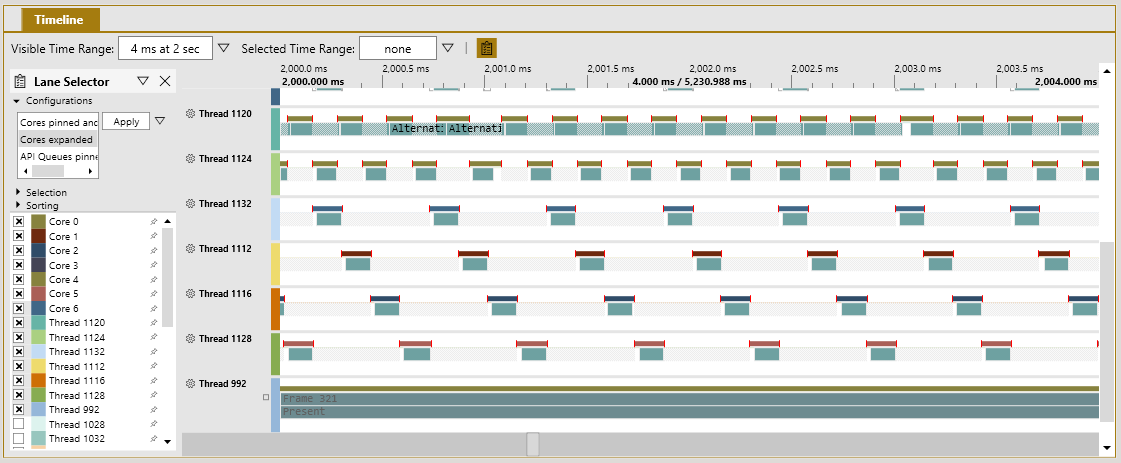
The different colored bars on the top of each portion of thread execution represent the core that the thread is running on. The top two threads have the same dark gold bar which means they're both running on the same core. Hover over the top bar to display the core number. Threads 1120 and 1124 are alternating on core four as shown in figure 2.
At this point, you can use the steps that are described in the Threads locking topic to narrow down the lines of code that are causing the threads to stop executing. If the threads are simply waiting for new work, and the CPU core is idle, adjust the thread affinities of other threads to schedule time on this core, or prepare additional work to process on this core.
Windows Performance Analyzer (WPA)
Windows Performance Analyzer (WPA) has two main views for threads in a title that are called CPU Usage (Precise) Utilization by CPU and CPU Usage (Precise) Utilization by Process.
CPU Usage (Precise) Utilization by CPU shows data that's relative to the core. This can quickly show where there's extra room for a thread to run. CPU Usage (Precise) Utilization by Process, Thread shows which threads are mostly idle or hogging the cores. Use the following steps to review
Follow the steps in the Common steps topic to generate an Event Tracing Log (ETL) file.
Apply the ThreadUtilization.wpaProfile WPA profile as described in the topic Common steps. After applying the profile, the new analysis tab appears as shown in figure 5.
Figure 5. Shows the default view of the ThreadUtilization profile in WPA
Steps to focus on a CPU core that isn't properly used
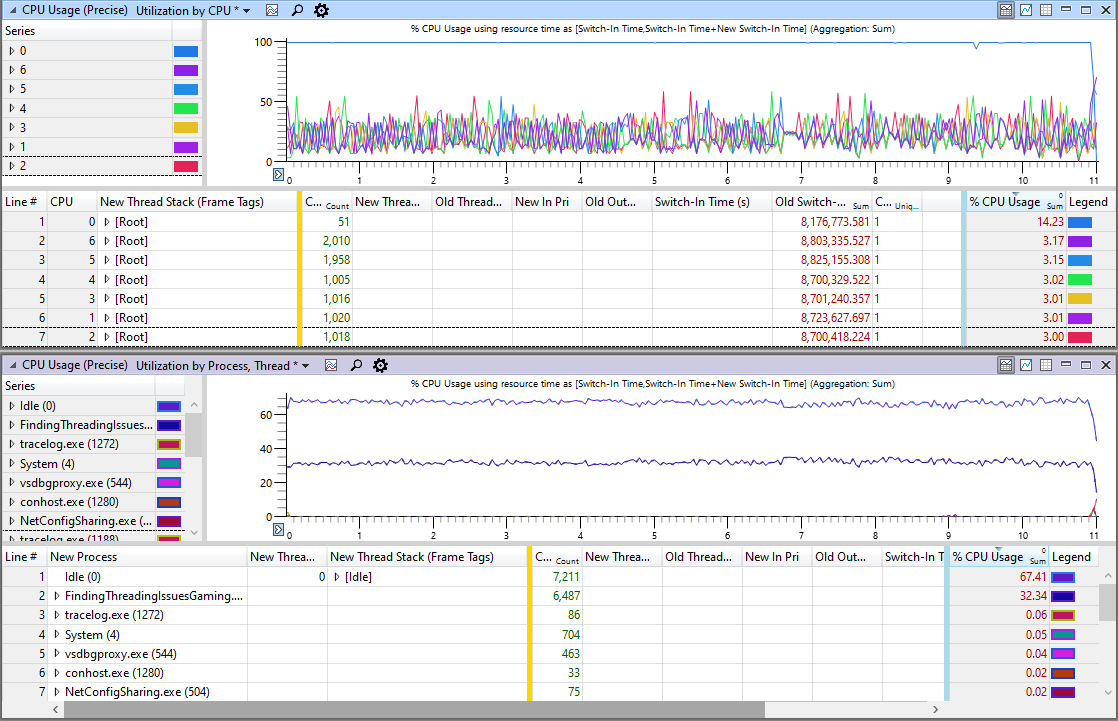
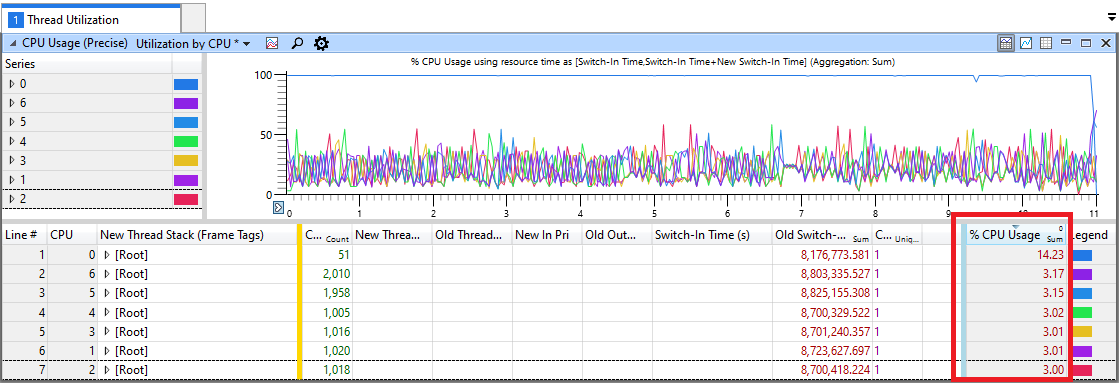
In the CPU Usage (Precise) Utilization by CPU view, use the % CPU Usage column to find CPU cores that have a lower usage than expected as shown in figure 6. The percentage is based on 100 percent of the entire CPU, not per-core. Therefore, 14.28 percent, for a single core, represents that core running at 100 percent because there are seven CPU cores that are available (100% / 7 CPU cores = 14.28%).
Figure 6. Shows the utilization by CPU where only core zero is running at 100 percent
Zoom in to areas on the graph where a CPU core is idle or very busy.
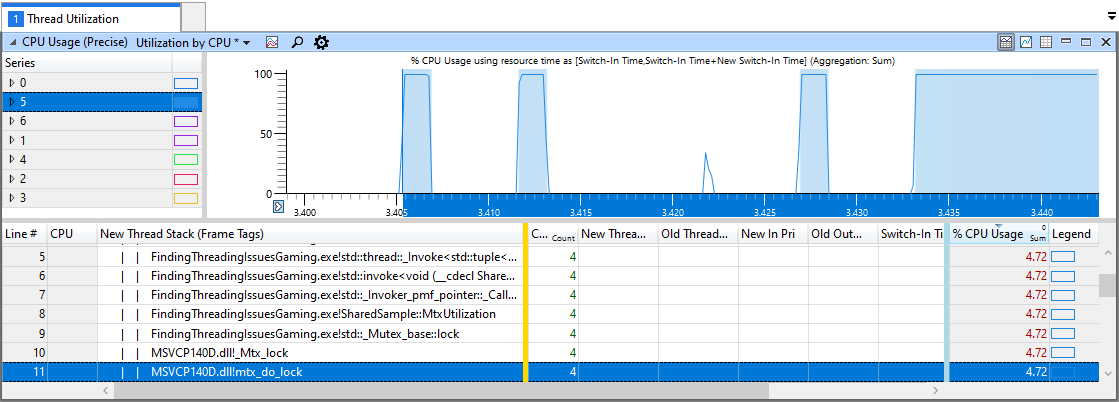
Expand the New Thread Stack (Frame Tags) entries that are in the data table to show the locations where the title is gaining control of the CPU as shown in figure 7. The % CPU Usage column shows the overall percentage of time spent that's relative to 100 percent being the entire CPU, not per-core.
Figure 7. Shows a zoomed in block of time that covers the ramp-up to full CPU usage where
std::mutexkept CPU utilization low
Use the steps that are described in the topic Threads locking to narrow down the lines of code that are causing your threads to stop executing on these cores. If the threads are simply waiting for new work, and the CPU core is idle, adjust the thread affinities of other threads to schedule time on this core, or prepare additional work to process on this core.
Steps to focus on a thread that isn't running as expected
Use the CPU Usage (precise) Utilization by Process, Thread window to narrow down the issue by thread.
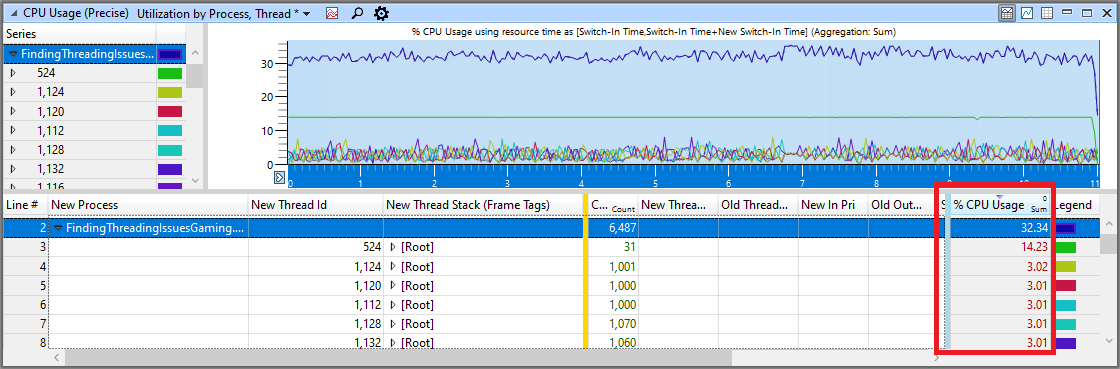
Review threads that are running at a lower than expected percentage of CPU usage, found in the % CPU Usage column as shown in figure 8. For example, a thread that's affinitized to a single core that you expect to run most of the time. The percentage is based on 100 percent of the entire CPU, not per-core.
Figure 8. Shows the Utilization by Process, Thread window to view CPU usage percentage for threads that are in the title
Zoom in until you get to a section that you want to investigate. This limits the amount of data to sort through the data table.
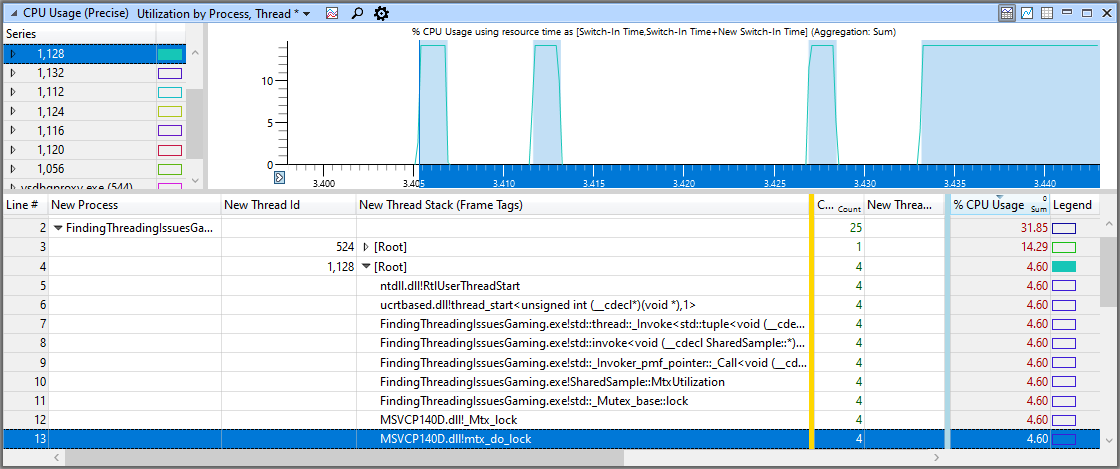
Expand the New Thread Stack (Frame Tags) entries that are in the data table to show the locations where the title is gaining control of the CPU as shown in figure 9. The % CPU Usage column shows the overall percentage of time spent that's relative to 100 percent being the entire CPU, not per-core.
Figure 9. Shows the point in the thread where the usage ramps up where
std::mutexkept thread utilization low
Use the steps described in the topic Threads locking to narrow down the lines of code that are causing the threads to stop executing.