Nota
L'accesso a questa pagina richiede l'autorizzazione. È possibile provare ad accedere o modificare le directory.
L'accesso a questa pagina richiede l'autorizzazione. È possibile provare a modificare le directory.
Si applica a: ✅Microsoft Fabric✅Azure Esplora dati
La funzione è una funzione series_fit_lowess_fl() definita dall'utente che applica una regressione LOWESS in una serie. Questa funzione accetta una tabella con più serie (matrici numeriche dinamiche) e genera una curva LOWESS, che è una versione smussata della serie originale.
Prerequisiti
- Il plug-in Python deve essere abilitato nel cluster. Questa operazione è necessaria per Python inline usato nella funzione .
- Il plug-in Python deve essere abilitato nel database. Questa operazione è necessaria per Python inline usato nella funzione .
Sintassi
T | invoke series_fit_lowess_fl(, y_series y_fit_series, [ fit_size ], [ x_series ], [ x_istime ])
Altre informazioni sulle convenzioni di sintassi.
Parametri
| Nome | Digita | Obbligatorio | Descrizione |
|---|---|---|---|
| y_series | string |
✔️ | Nome della colonna della tabella di input contenente la variabile dipendente. Questa colonna è la serie da adattare. |
| y_fit_series | string |
✔️ | Nome della colonna in cui archiviare la serie montata. |
| fit_size | int |
Per ogni punto, la regressione locale viene applicata ai rispettivi punti fit_size più vicini. L'impostazione predefinita è 5. | |
| x_series | string |
Nome della colonna contenente la variabile indipendente, ovvero l'asse x o l'ora. Questo parametro è facoltativo ed è necessario solo per le serie con spaziatura non uniforme. Il valore predefinito è una stringa vuota, perché x è ridondante per la regressione di una serie con spaziatura uniforme. | |
| x_istime | bool |
Questo parametro booleano è necessario solo se viene specificato x_series ed è un vettore di datetime. Il valore predefinito è false. |
Definizione di funzione
È possibile definire la funzione incorporando il codice come funzione definita da query o creandola come funzione archiviata nel database, come indicato di seguito:
Definire la funzione usando l'istruzione let seguente. Non sono necessarie autorizzazioni.
Importante
Un'istruzione let non può essere eseguita autonomamente. Deve essere seguita da un'istruzione di espressione tabulare. Per eseguire un esempio funzionante di series_fit_lowess_fl(), vedere Esempi.
let series_fit_lowess_fl=(tbl:(*), y_series:string, y_fit_series:string, fit_size:int=5, x_series:string='', x_istime:bool=False)
{
    let kwargs = bag_pack('y_series', y_series, 'y_fit_series', y_fit_series, 'fit_size', fit_size, 'x_series', x_series, 'x_istime', x_istime);
    let code = ```if 1:
        y_series = kargs["y_series"]
        y_fit_series = kargs["y_fit_series"]
        fit_size = kargs["fit_size"]
        x_series = kargs["x_series"]
        x_istime = kargs["x_istime"]
        import statsmodels.api as sm
        def lowess_fit(ts_row, x_col, y_col, fsize):
            y = ts_row[y_col]
            fraction = fsize/len(y)
            if x_col == "": # If there is no x column creates sequential range [1, len(y)]
               x = np.arange(len(y)) + 1
            else: # if x column exists check whether its a time column. If so, normalize it to the [1, len(y)] range, else take it as is.
               if x_istime:
                   x = pd.to_numeric(pd.to_datetime(ts_row[x_col]))
                   x = x - x.min()
                   x = x / x.max()
                   x = x * (len(x) - 1) + 1
               else:
                   x = ts_row[x_col]
            lowess = sm.nonparametric.lowess
            z = lowess(y, x, return_sorted=False, frac=fraction)
            return list(z)
        result = df
        result[y_fit_series] = df.apply(lowess_fit, axis=1, args=(x_series, y_series, fit_size))
    ```;
    tbl
     | evaluate python(typeof(*), code, kwargs)
};
// Write your query to use the function here.
Esempi
Negli esempi seguenti viene usato l'operatore invoke per eseguire la funzione .
Regressione LOWESS in serie temporali regolari
Per usare una funzione definita da query, richiamarla dopo la definizione della funzione incorporata.
let series_fit_lowess_fl=(tbl:(*), y_series:string, y_fit_series:string, fit_size:int=5, x_series:string='', x_istime:bool=False)
{
let kwargs = bag_pack('y_series', y_series, 'y_fit_series', y_fit_series, 'fit_size', fit_size, 'x_series', x_series, 'x_istime', x_istime);
let code = ```if 1:
y_series = kargs["y_series"]
y_fit_series = kargs["y_fit_series"]
fit_size = kargs["fit_size"]
x_series = kargs["x_series"]
x_istime = kargs["x_istime"]
import statsmodels.api as sm
def lowess_fit(ts_row, x_col, y_col, fsize):
y = ts_row[y_col]
fraction = fsize/len(y)
if x_col == "": # If there is no x column creates sequential range [1, len(y)]
x = np.arange(len(y)) + 1
else: # if x column exists check whether its a time column. If so, normalize it to the [1, len(y)] range, else take it as is.
if x_istime:
x = pd.to_numeric(pd.to_datetime(ts_row[x_col]))
x = x - x.min()
x = x / x.max()
x = x * (len(x) - 1) + 1
else:
x = ts_row[x_col]
lowess = sm.nonparametric.lowess
z = lowess(y, x, return_sorted=False, frac=fraction)
return list(z)
result = df
result[y_fit_series] = df.apply(lowess_fit, axis=1, args=(x_series, y_series, fit_size))
```;
tbl
| evaluate python(typeof(*), code, kwargs)
};
//
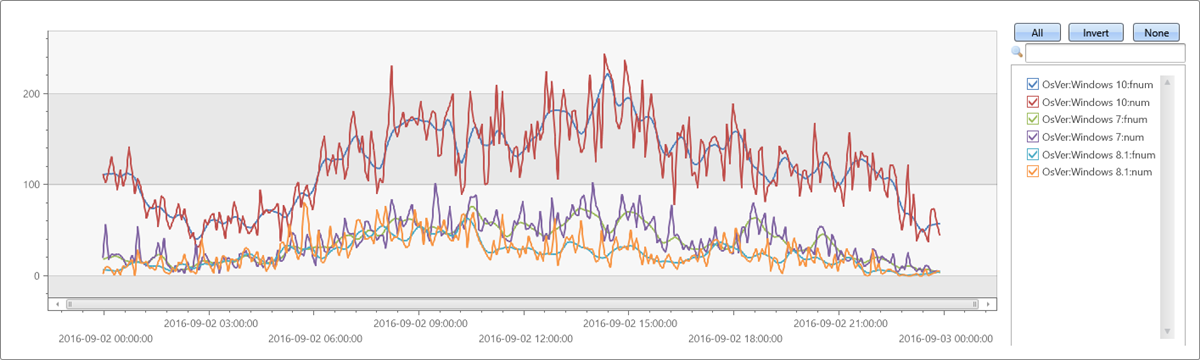
// Apply 9 points LOWESS regression on regular time series
//
let max_t = datetime(2016-09-03);
demo_make_series1
| make-series num=count() on TimeStamp from max_t-1d to max_t step 5m by OsVer
| extend fnum = dynamic(null)
| invoke series_fit_lowess_fl('num', 'fnum', 9)
| render timechart
Output
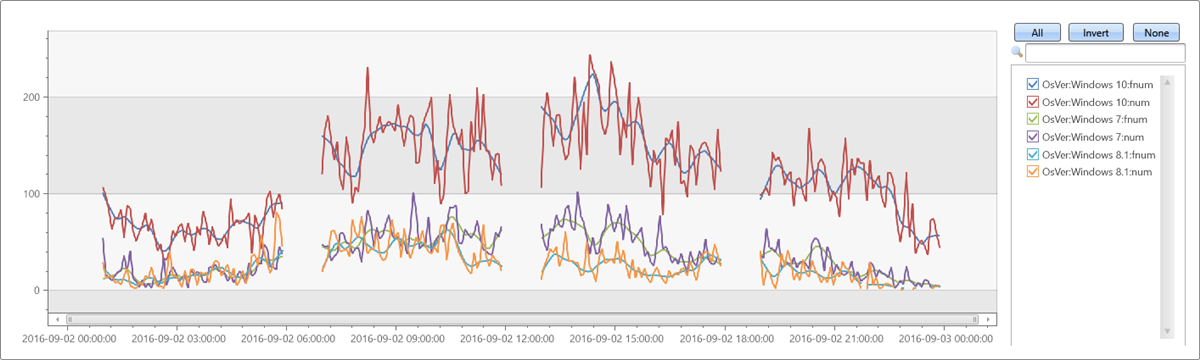
Testare serie temporali irregolari
Per usare una funzione definita da query, richiamarla dopo la definizione della funzione incorporata.
let series_fit_lowess_fl=(tbl:(*), y_series:string, y_fit_series:string, fit_size:int=5, x_series:string='', x_istime:bool=False)
{
    let kwargs = bag_pack('y_series', y_series, 'y_fit_series', y_fit_series, 'fit_size', fit_size, 'x_series', x_series, 'x_istime', x_istime);
    let code = ```if 1:
        y_series = kargs["y_series"]
        y_fit_series = kargs["y_fit_series"]
        fit_size = kargs["fit_size"]
        x_series = kargs["x_series"]
        x_istime = kargs["x_istime"]
        import statsmodels.api as sm
        def lowess_fit(ts_row, x_col, y_col, fsize):
            y = ts_row[y_col]
            fraction = fsize/len(y)
            if x_col == "": # If there is no x column creates sequential range [1, len(y)]
               x = np.arange(len(y)) + 1
            else: # if x column exists check whether its a time column. If so, normalize it to the [1, len(y)] range, else take it as is.
               if x_istime:
                   x = pd.to_numeric(pd.to_datetime(ts_row[x_col]))
                   x = x - x.min()
                   x = x / x.max()
                   x = x * (len(x) - 1) + 1
               else:
                   x = ts_row[x_col]
            lowess = sm.nonparametric.lowess
            z = lowess(y, x, return_sorted=False, frac=fraction)
            return list(z)
        result = df
        result[y_fit_series] = df.apply(lowess_fit, axis=1, args=(x_series, y_series, fit_size))
    ```;
    tbl
     | evaluate python(typeof(*), code, kwargs)
};
let max_t = datetime(2016-09-03);
demo_make_series1
| where TimeStamp between ((max_t-1d)..max_t)
| summarize num=count() by bin(TimeStamp, 5m), OsVer
| order by TimeStamp asc
| where hourofday(TimeStamp) % 6 != 0   //  delete every 6th hour to create irregular time series
| summarize TimeStamp=make_list(TimeStamp), num=make_list(num) by OsVer
| extend fnum = dynamic(null)
| invoke series_fit_lowess_fl('num', 'fnum', 9, 'TimeStamp', True)
| render timechart
Output
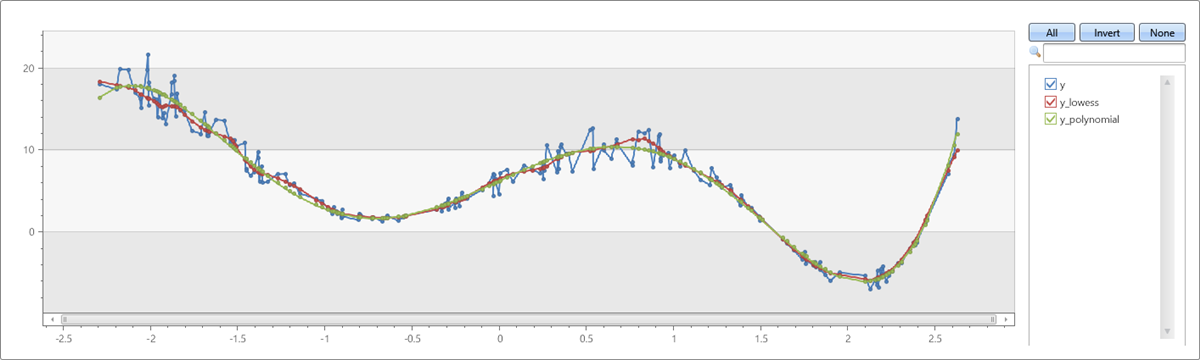
Confrontare LOWESS rispetto alla forma polinomiale
Per usare una funzione definita da query, richiamarla dopo la definizione della funzione incorporata.
let series_fit_lowess_fl=(tbl:(*), y_series:string, y_fit_series:string, fit_size:int=5, x_series:string='', x_istime:bool=False)
{
    let kwargs = bag_pack('y_series', y_series, 'y_fit_series', y_fit_series, 'fit_size', fit_size, 'x_series', x_series, 'x_istime', x_istime);
    let code = ```if 1:
        y_series = kargs["y_series"]
        y_fit_series = kargs["y_fit_series"]
        fit_size = kargs["fit_size"]
        x_series = kargs["x_series"]
        x_istime = kargs["x_istime"]
        import statsmodels.api as sm
        def lowess_fit(ts_row, x_col, y_col, fsize):
            y = ts_row[y_col]
            fraction = fsize/len(y)
            if x_col == "": # If there is no x column creates sequential range [1, len(y)]
               x = np.arange(len(y)) + 1
            else: # if x column exists check whether its a time column. If so, normalize it to the [1, len(y)] range, else take it as is.
               if x_istime:
                   x = pd.to_numeric(pd.to_datetime(ts_row[x_col]))
                   x = x - x.min()
                   x = x / x.max()
                   x = x * (len(x) - 1) + 1
               else:
                   x = ts_row[x_col]
            lowess = sm.nonparametric.lowess
            z = lowess(y, x, return_sorted=False, frac=fraction)
            return list(z)
        result = df
        result[y_fit_series] = df.apply(lowess_fit, axis=1, args=(x_series, y_series, fit_size))
    ```;
    tbl
     | evaluate python(typeof(*), code, kwargs)
};
range x from 1 to 200 step 1
| project x = rand()*5 - 2.3
| extend y = pow(x, 5)-8*pow(x, 3)+10*x+6
| extend y = y + (rand() - 0.5)*0.5*y
| summarize x=make_list(x), y=make_list(y)
| extend y_lowess = dynamic(null)
| invoke series_fit_lowess_fl('y', 'y_lowess', 15, 'x')
| extend series_fit_poly(y, x, 5)
| project x, y, y_lowess, y_polynomial=series_fit_poly_y_poly_fit
| render linechart
Output