Test dashboard (Agile and CMMI)
TFS 2017 | TFS 2015 | TFS 2013
By using the test dashboard, you can monitor test activities, report on progress, find gaps in test coverage, and identify test areas that might require additional investigation. This dashboard displays five reports that provide information about testing that has occurred in the most recent four weeks.
You can use this dashboard to answer the following questions:
- Is test case authoring on track?
- Has the team defined test cases for all user stories or requirements?
- What are the proportions of test cases that are passing, failing, and blocked?
- Do test failure metrics indicate a problem that requires further investigation?
- What is the status of last night's build?
- What are the most recent check-ins?
Requirements
The Test Plan Progress, Test Case Readiness, User Story Test Status, Requirement Test Status, and Test Activity reports are available only when the team creates test plans and runs tests as described in Plan your tests.
Burndown, progress, trend charts, and reports
 through
  do not appear when the server that hosts Analysis Services for the team project is not available.
Plus requirements listed in Project portal dashboards.
Data displayed in the dashboard
You can use the test dashboard to understand how well the team is progressing in testing the user stories (Agile) or requirements (CMMI). The test dashboard, displays the following web parts.
Agile process template version

CMMI process template version

| Web Part | Data displayed | Related topic |
|---|---|---|
 |
Stacked area graph of the test results of all test cases grouped into their most recent recorded outcome during the past four weeks. Outcomes include Never Run, Blocked, Failed, and Passed. |
Test Plan Progress |
 |
Stacked area graph that shows how many test cases have been in the Design or Ready state for the most recent four weeks. |
Test Case Readiness |
 |
Horizontal bar chart that shows the count of test results for each combination of test case and test configuration that is defined for each user story or requirement. The chart groups the test results according to their most recent test run, where the options are Passed (green), Failed (red), Blocked (purple), or Not Run (gray). |
User Story Test Status Requirement Test Status |
 |
Line chart that shows the cumulative count of all results run for all manual test cases during the most recent four weeks. |
Test Activity |
 |
Stacked area graph that shows the cumulative count of all failed outcome results for test cases, sorted by failure type, during the most recent four weeks. Failure types include Regression, New Issue, and Known Issue. |
Failure Analysis |
 |
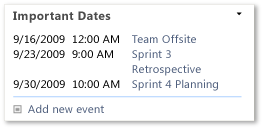
List of upcoming events. This list is derived from a SharePoint Web Part. |
Not applicable |
 |
Count of active, resolved, and closed work items. You can open the list of work items by choosing each number. This list is derived from a Team Web Access Web Part. |
Not applicable |
 |
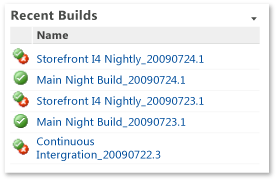
List of recent builds and their build status. You can view more details by choosing a specific build. This list is derived from a Team Web Access Web Part. Legend: |
Run, monitor, and manage |
 |
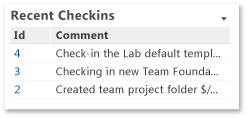
List of the most recent check-ins. You can view more details by choosing a specific check-in. This list is derived from a Team Web Access Web Part. |
Manage pending changes |
Required activities to monitor test efforts
For the reports in the test dashboard to be useful and accurate, the team must perform the following activities:
Define test cases and user stories or requirements, and create Tested By links from test cases to user stories or requirements.
For manual tests, mark the results of each validation step in the test case as passed or failed.
Important
Testers must mark a test step with a status if it is a validation test step. The overall result for a test case reflects the status of all the test steps that the tester marked. Therefore, the test case will have a status of failed if the tester marked any test step as failed or did not mark it.
For automated tests, each test case is automatically marked as passed or failed.
(Optional) To support filtering, assign Iteration and Area paths to each test case.
Monitor test progress
You can use the first three reports in the Test Dashboard to monitor test progress and answer the questions in the following table.
| Report | Questions answered | Notes |
|---|---|---|
| Test Case Readiness | - How many test cases has the test team defined? - How many test cases are ready to run today? - How many test cases must the team still write and review? - Does the overall number of test cases appear to be sufficient for the number of User stories that the team is implementing? - What percentage of test cases can the test team run today? - Will the team be able to prepare all the test cases by the end of the iteration? |
- Healthy progress shows a steady increase in the number of test cases that the team is designing and moving to the ready state. - Unhealthy progress shows that no or few test cases are ready to be run. When all test cases remain in a design state for a long time, an issue may block progress. You might want to investigate the cause of the blockage. - A gap in testing may develop if the number of test cases does not appear sufficient. The number of test cases that are defined for a project should be equal to or larger than the number of User stories that the team is implementing. The number of test cases does not appear sufficient. |
| Test Plan Progress | - How many test cases are passing? - How many test cases are failing? - How many test cases are blocked? - How many test cases have never run? - What percentage of test cases are passing across all Test Plans? - How much testing has the team completed? - Is the team likely to finish the testing on time? |
- As the development cycle progresses, the more test cases should pass, and fewer test cases should stay in other states. - Unhealthy progress occurs when too many test cases fail. Depending on where you are in the product cycle, you might investigate why so many test cases are failing. - If the number of test cases that are failing or never run is flat, you might want to investigate the specific causes that affect each area. |
| User Story Test Status Requirement Test Status |
- Are test cases being run for each user story or requirement? - If test cases are blocked or not being run, does the team understand the blocking issues and are they being addressed? |
- Healthy progress shows most test cases for each user story or requirement are passing. - Unhealthy progress is indicated too many test cases for a specific user story or requirement, which are in a Never Run, Blocked, or Failed state. You might want to investigate the causes that keep the test cases that are defined for a user story or requirement from passing. |
Determine gaps in testing
You can use the User Story Test Status or Requirement Test Status report to determine whether tests are covering all the code and to answer the following questions:
Which user stories or requirements have a low overall count of test cases?
Which user stories or requirements have a high overall count of test cases that are blocked or have never been run?
Does the test case coverage for each user story or requirement meet expectations?
Which user stories or requirements have a high rate of test failures?
What is the average number of test cases that are defined for each user story or requirement?
Monitor test failures and regressions
By monitoring test failures, you can identify and address problems in the code early. You can use the last two reports in the Test Dashboard to gain better insight into the number of tests that are failing.
| Report | Questions answered | Notes |
|---|---|---|
| Manual Test Activity | - Is the number of tests that the team has never run decreasing? - Is the team minimizing the overall number of blocked tests? - Are fewer tests failing over time? - Are more tests passing? - Does the test activity contain spikes that you cannot account for? |
The Manual Test Activity report indicates the results for each test case run for each test configuration and for all test plans. Spikes that might occur may be early indicators of problems in either the test activity or the quality of code that the team is checking in. You might want to check the metrics for recent builds, bug status, and code churn to determine whether any of them can help explain the changes. |
| Test Failure Analysis | - How many tests are regressing? - Is the team keeping the overall number of regressions or test failures within expected ranges or team goals? - Is the team addressing issues as they are identified and known issues in a timely manner? |
A healthy Test Failure Analysis report shows moderate numbers of new issues, known issues, and regressions. If any spikes occur in these areas, the team might need to investigate further. Spikes may indicate problems in either the test activity or the quality of code that the team is checking in. Also, you might want to check the metrics for recent builds, bug status, and code churn to determine whether any of them can help explain the changes. |