How to use Website Benchmarks - Beta?
With the Clarity Website Benchmarks - Beta, you can get a clear picture of user behavior and trends across the web. Slice it by site category and see how your website stacks up comparatively.
This interactive report aggregates data from billions of anonymous user sessions worldwide for sites in the English and Japanese, with plans to expand the coverage globally. You can view trends from 14 site categories.
There are two ways to use the benchmarking report:
Visualize metrics for a certain site category
Use the following steps to visualize the metrics for a certain site category:
- Scroll to the Site categories section and select a category from the drop-down.
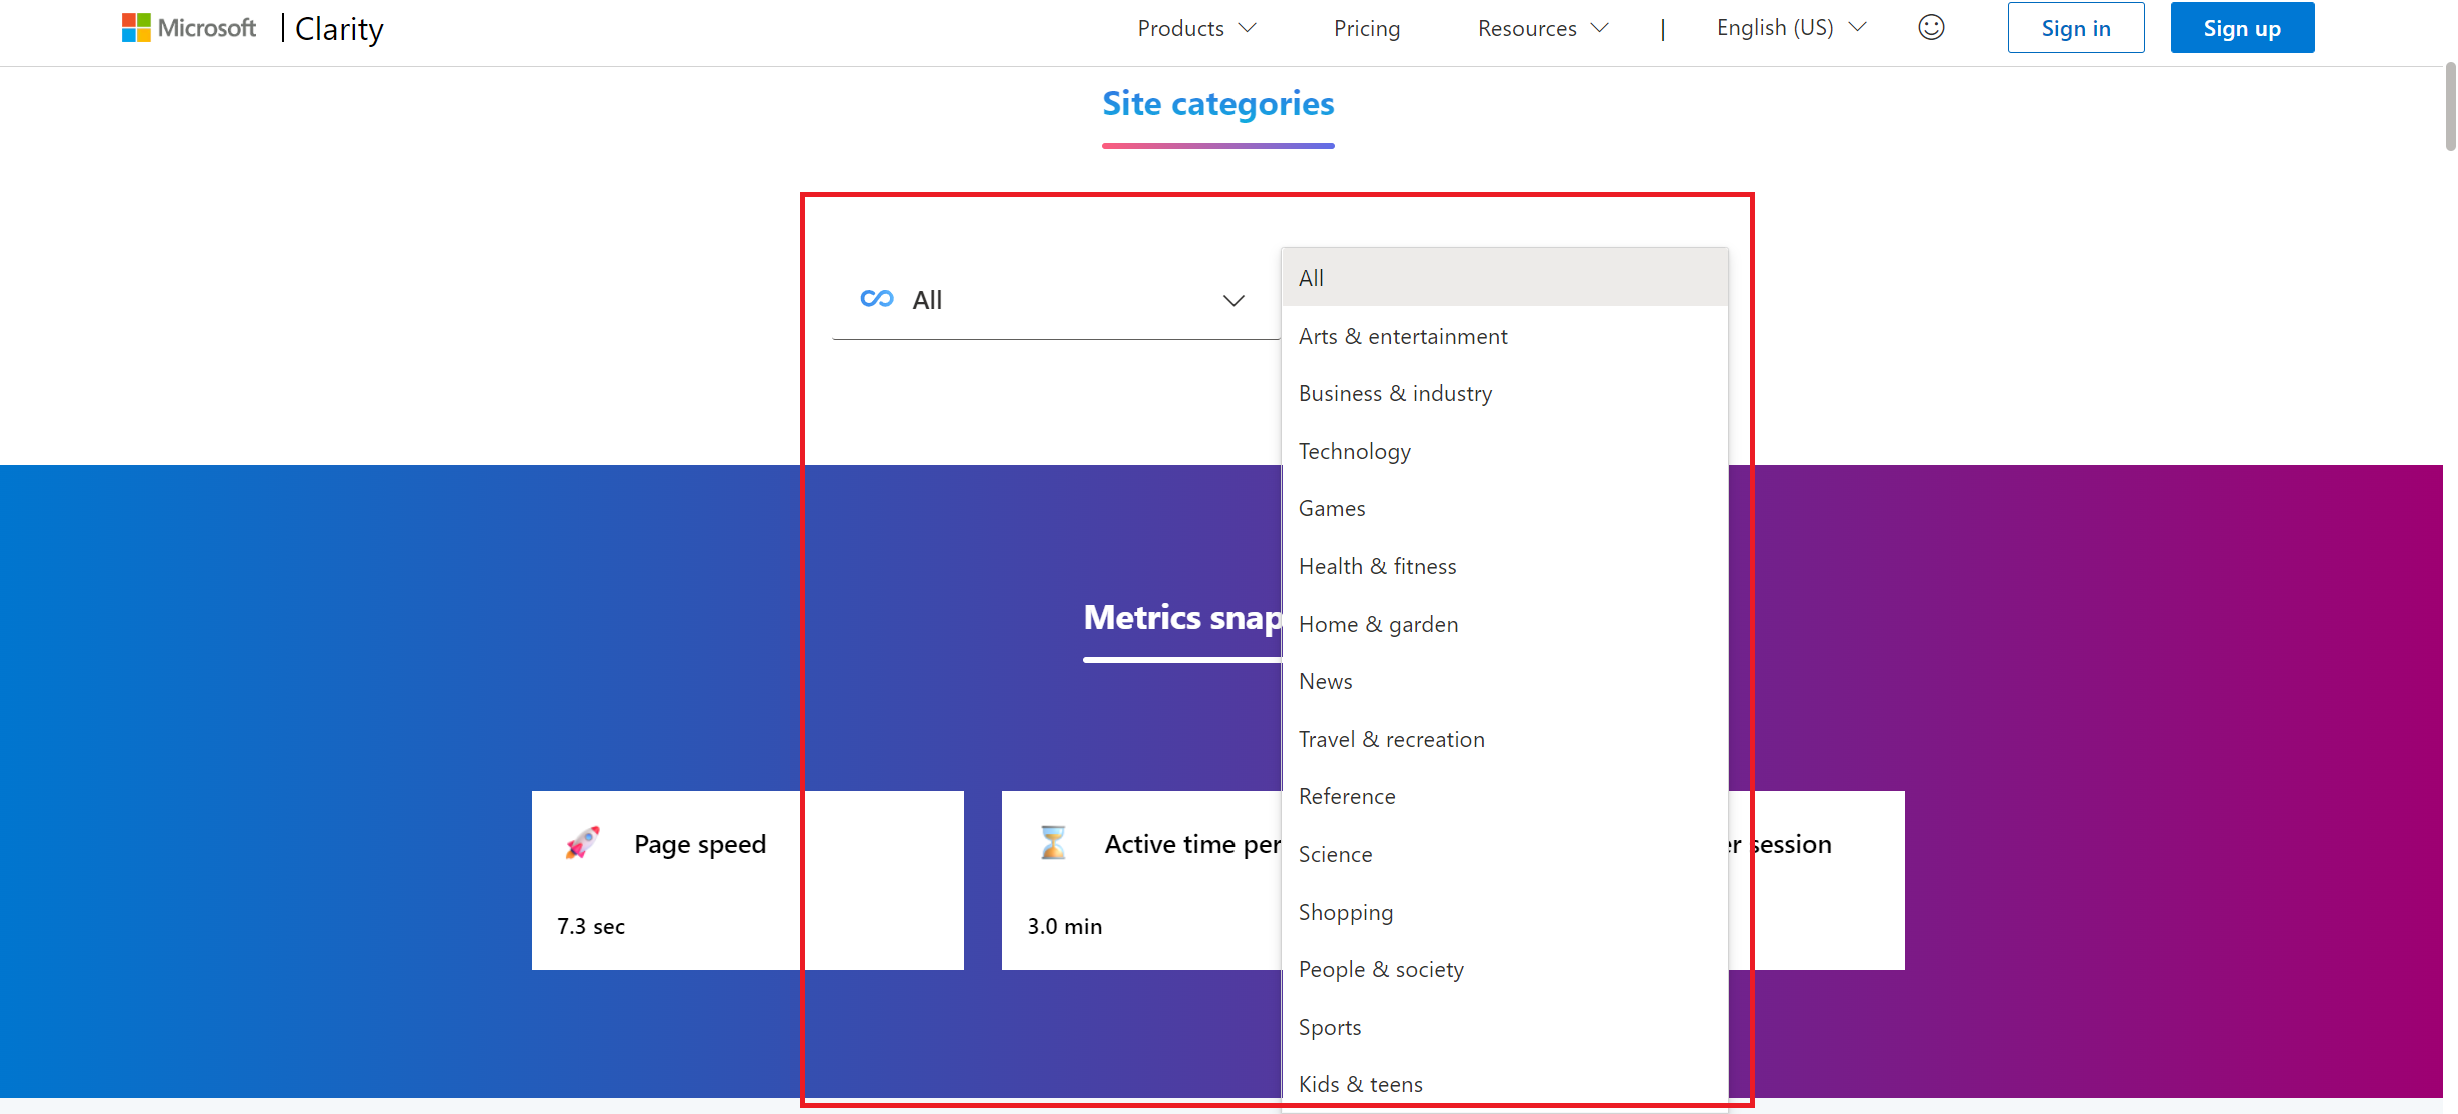
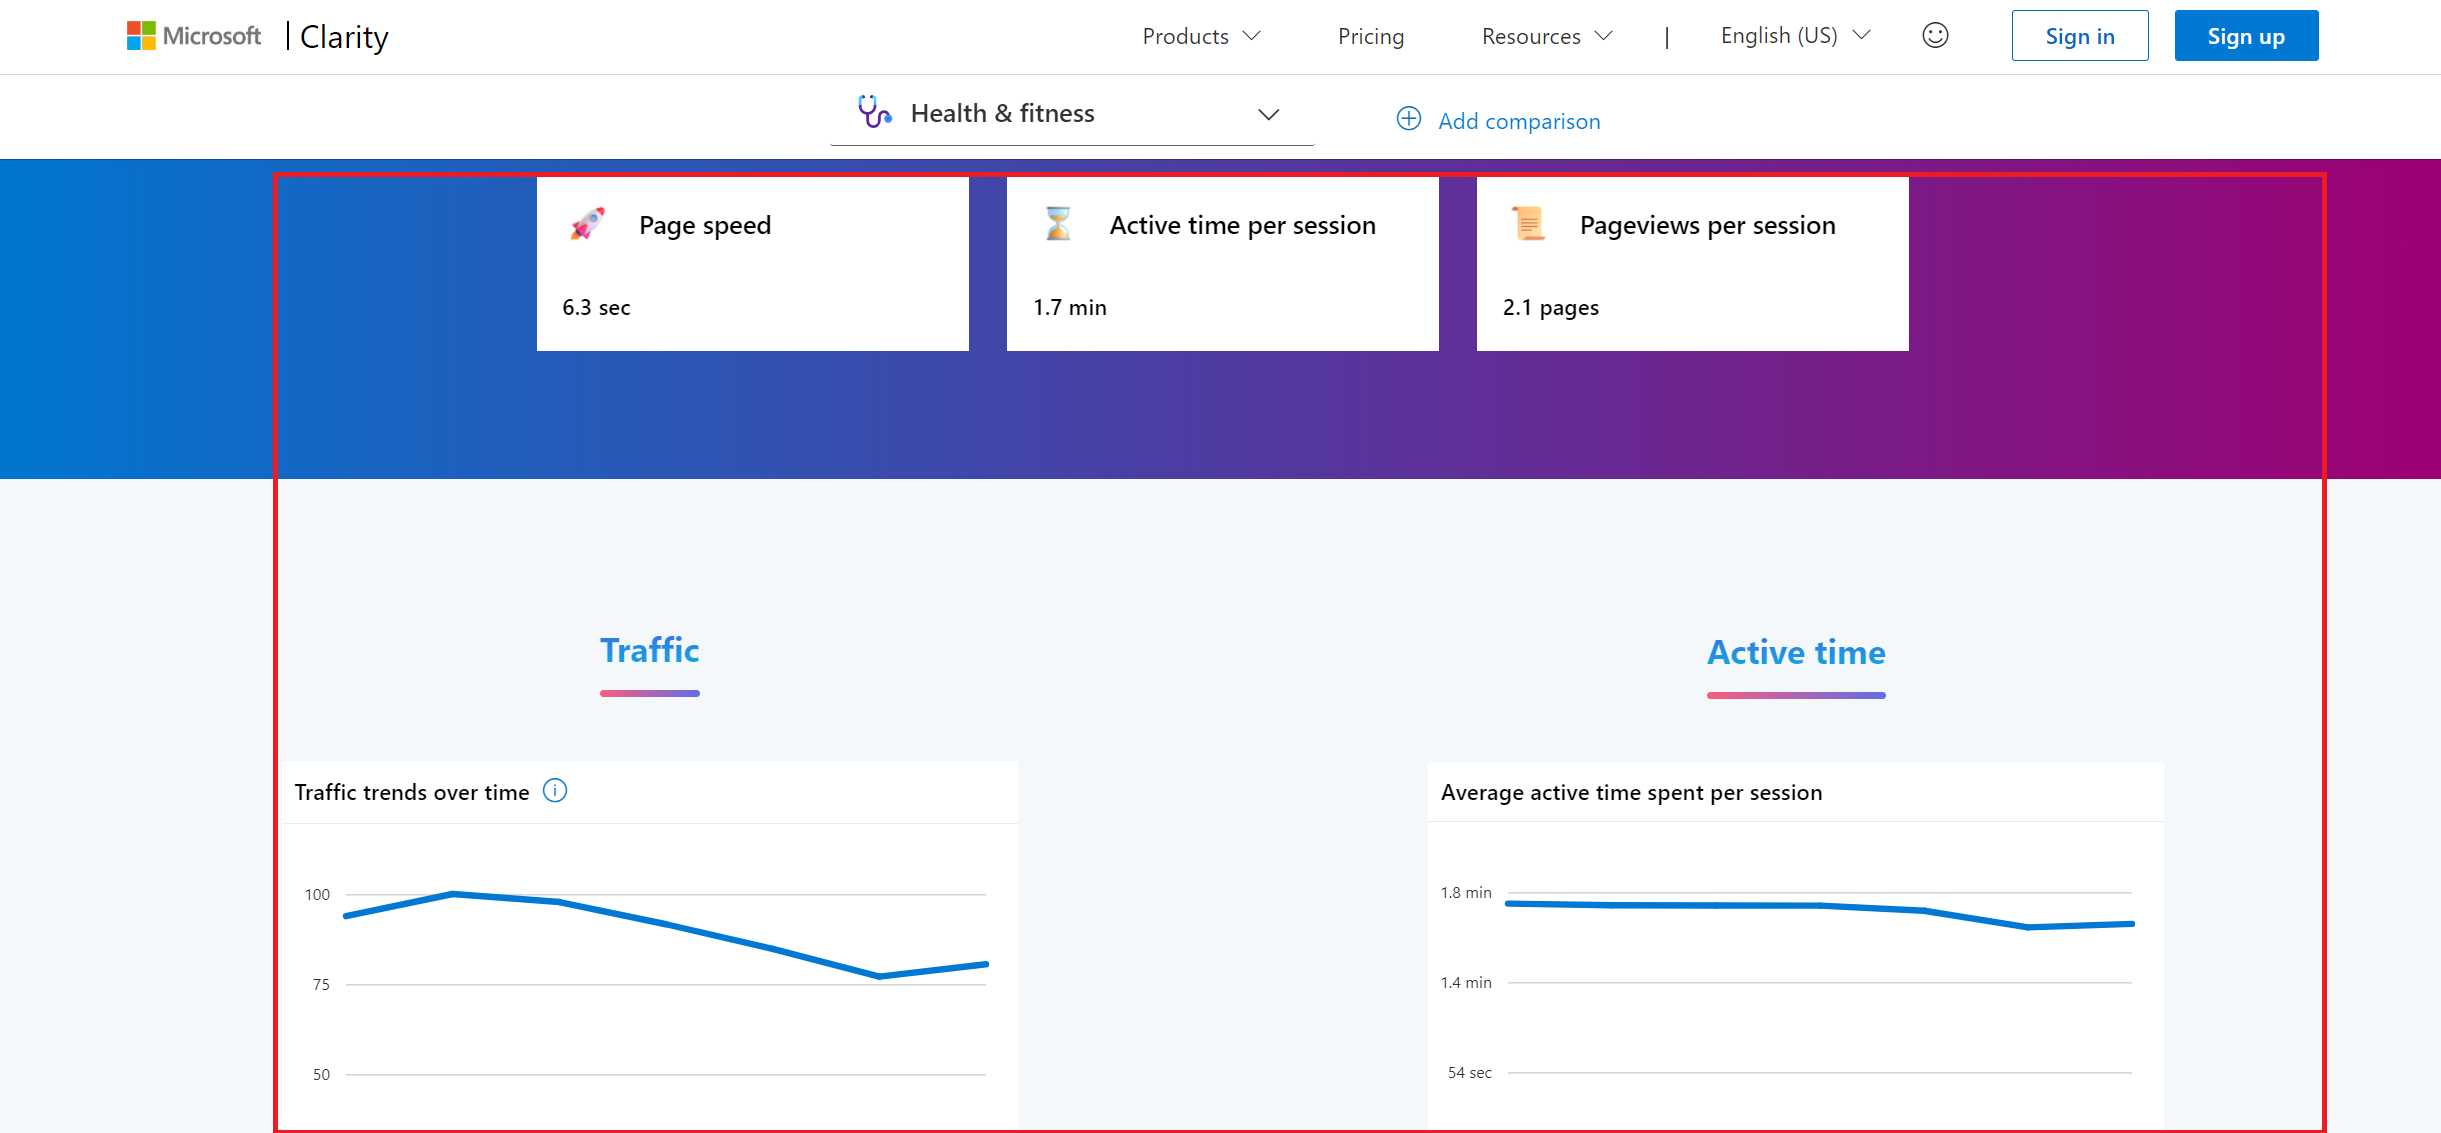
- All visualizations appearing after the selection are filtered for this site category.
Compare two site category metrics
Follow the steps to compare the metrics of two site categories side by side:
Scroll to the Site categories section. Select the first category.

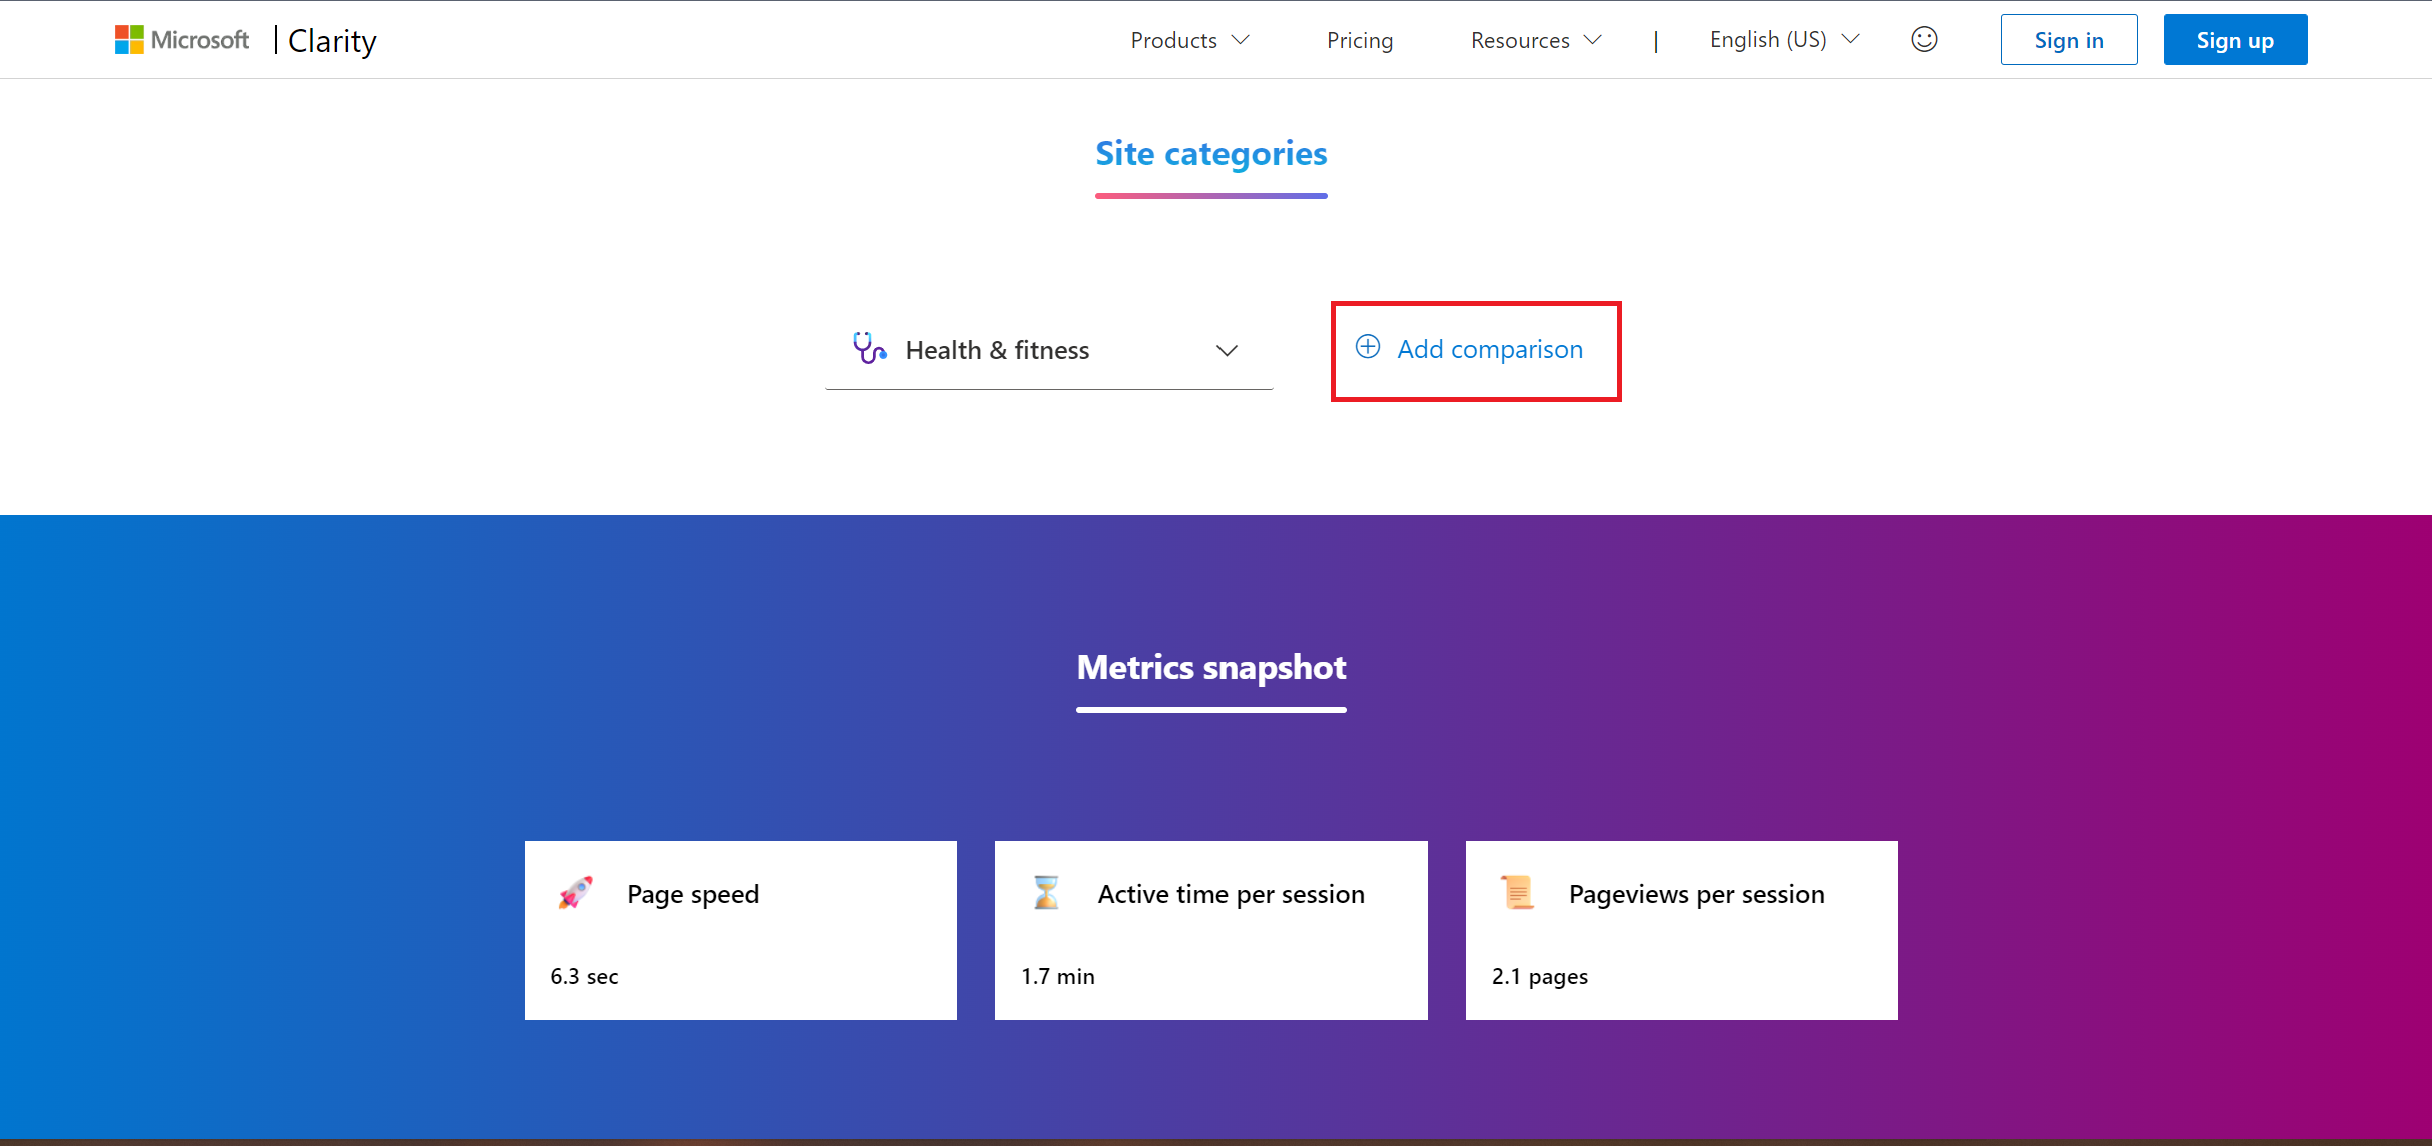
Select Add comparison button next to the categories drop down.
Select a second category from the drop-down.
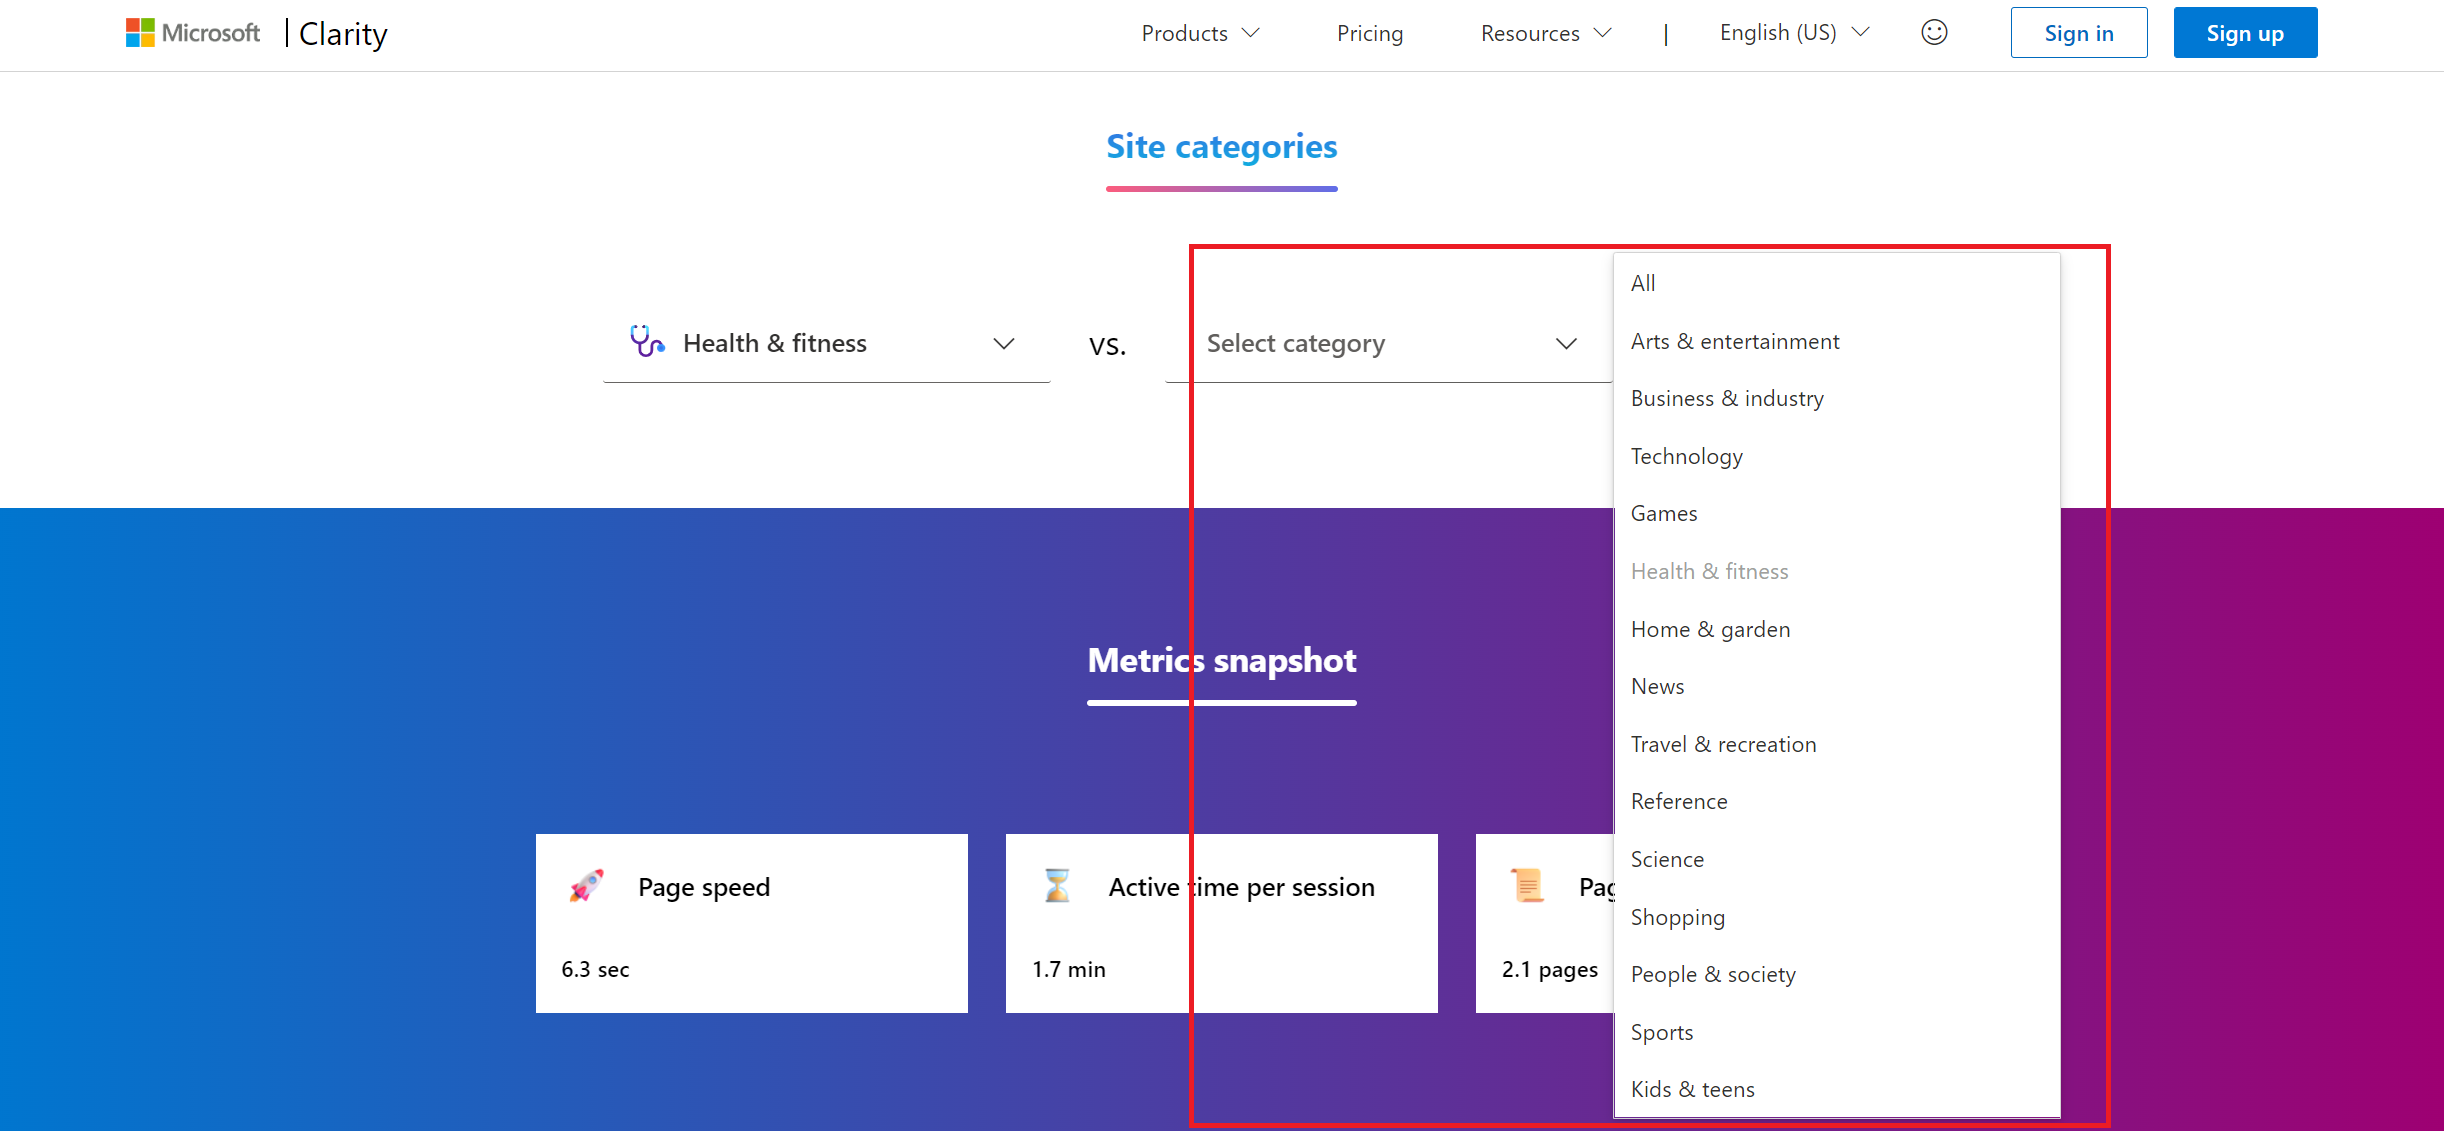
All visualizations appearing after the selection are filtered for the first and the second category.
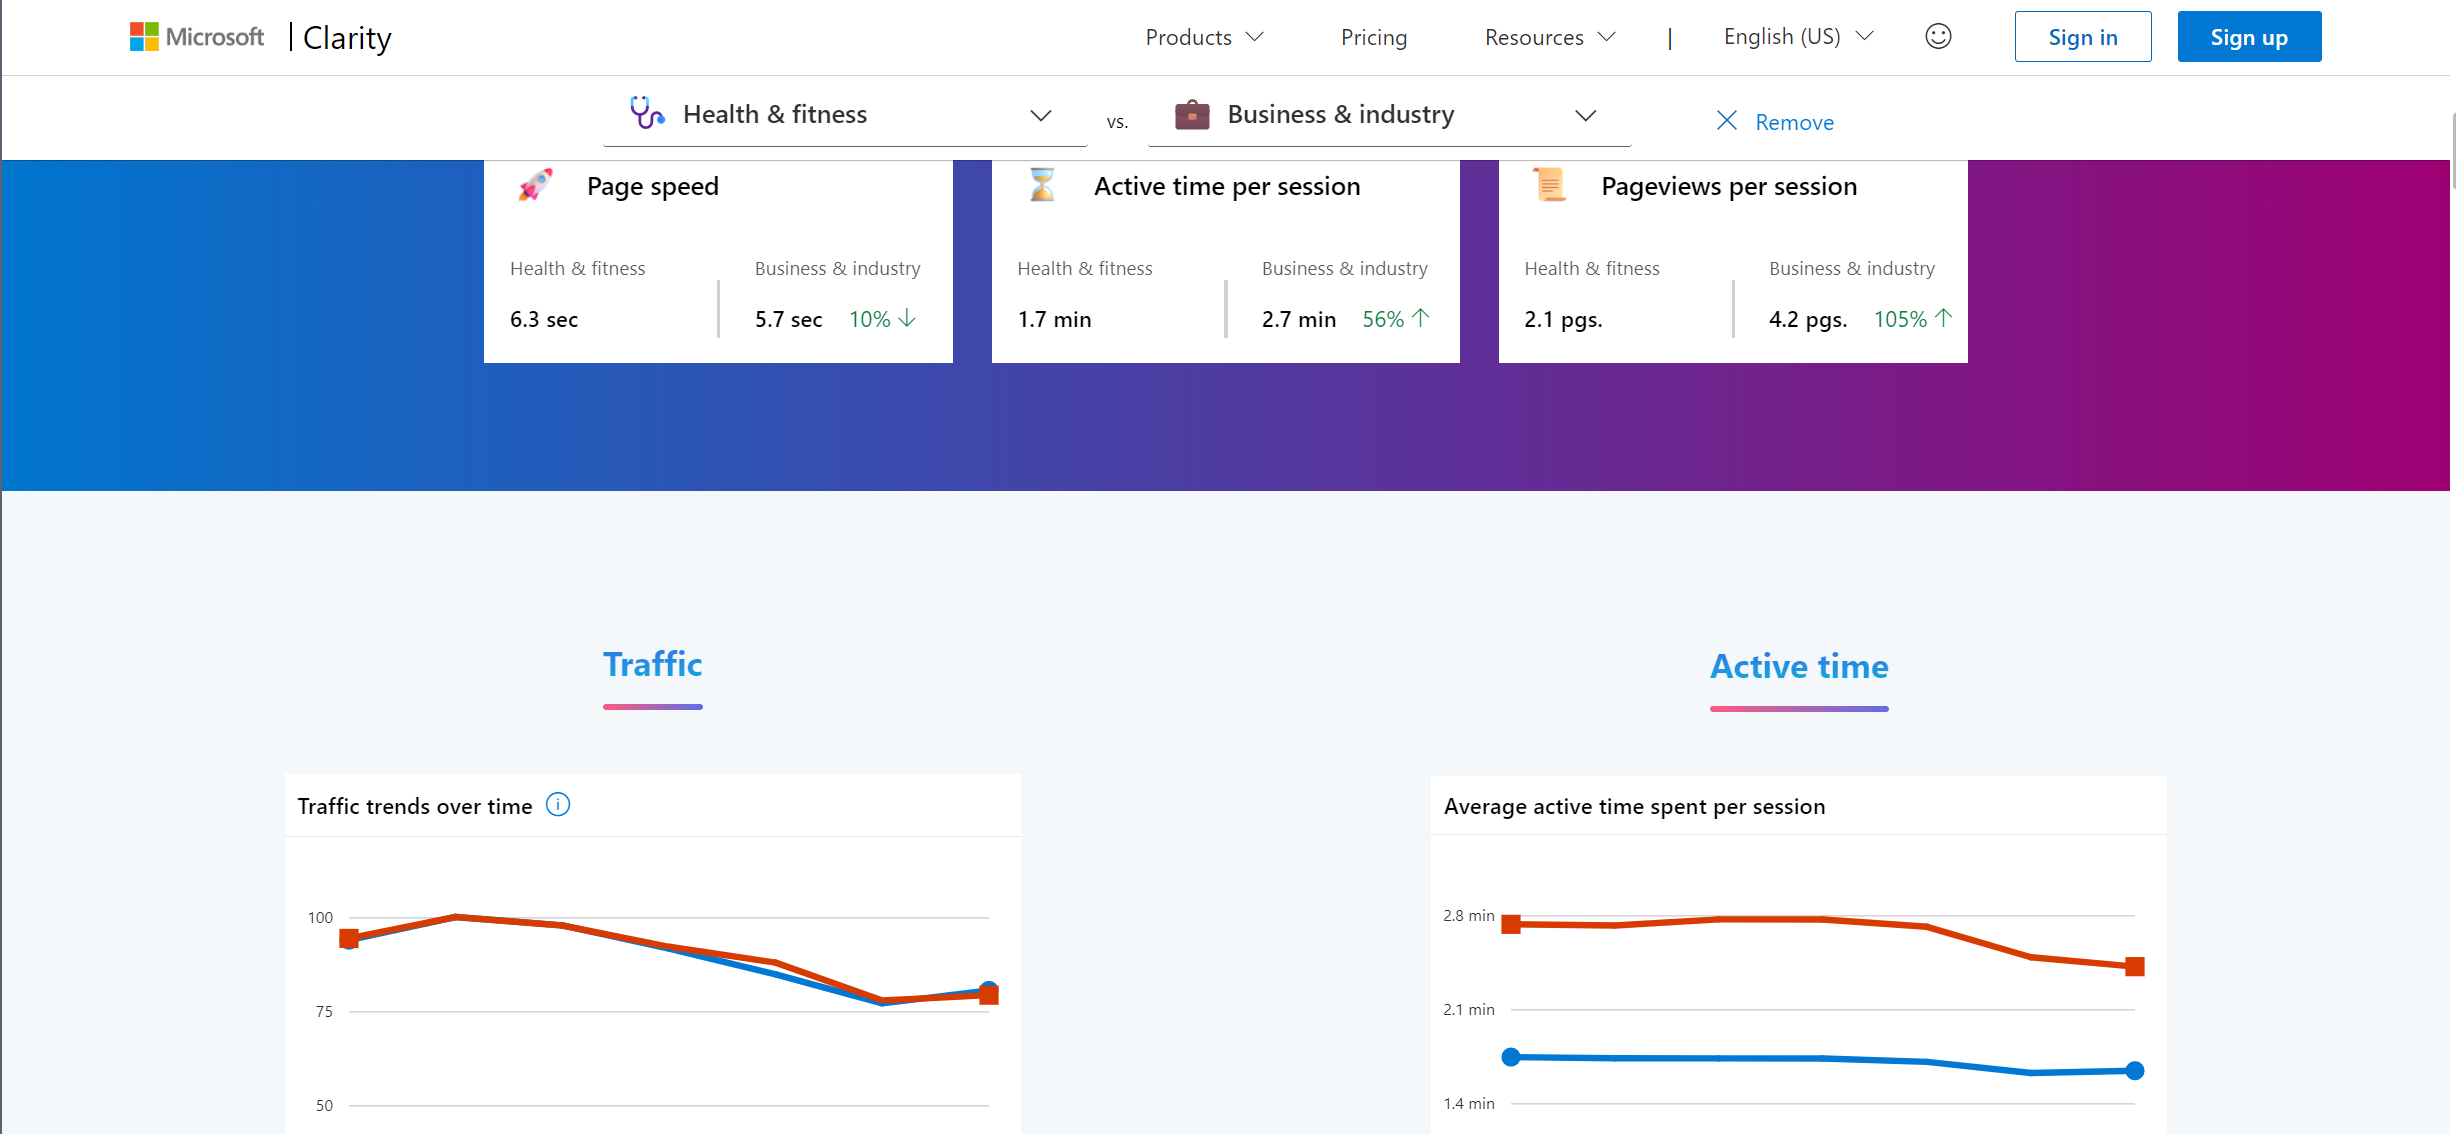
Remove Comparison
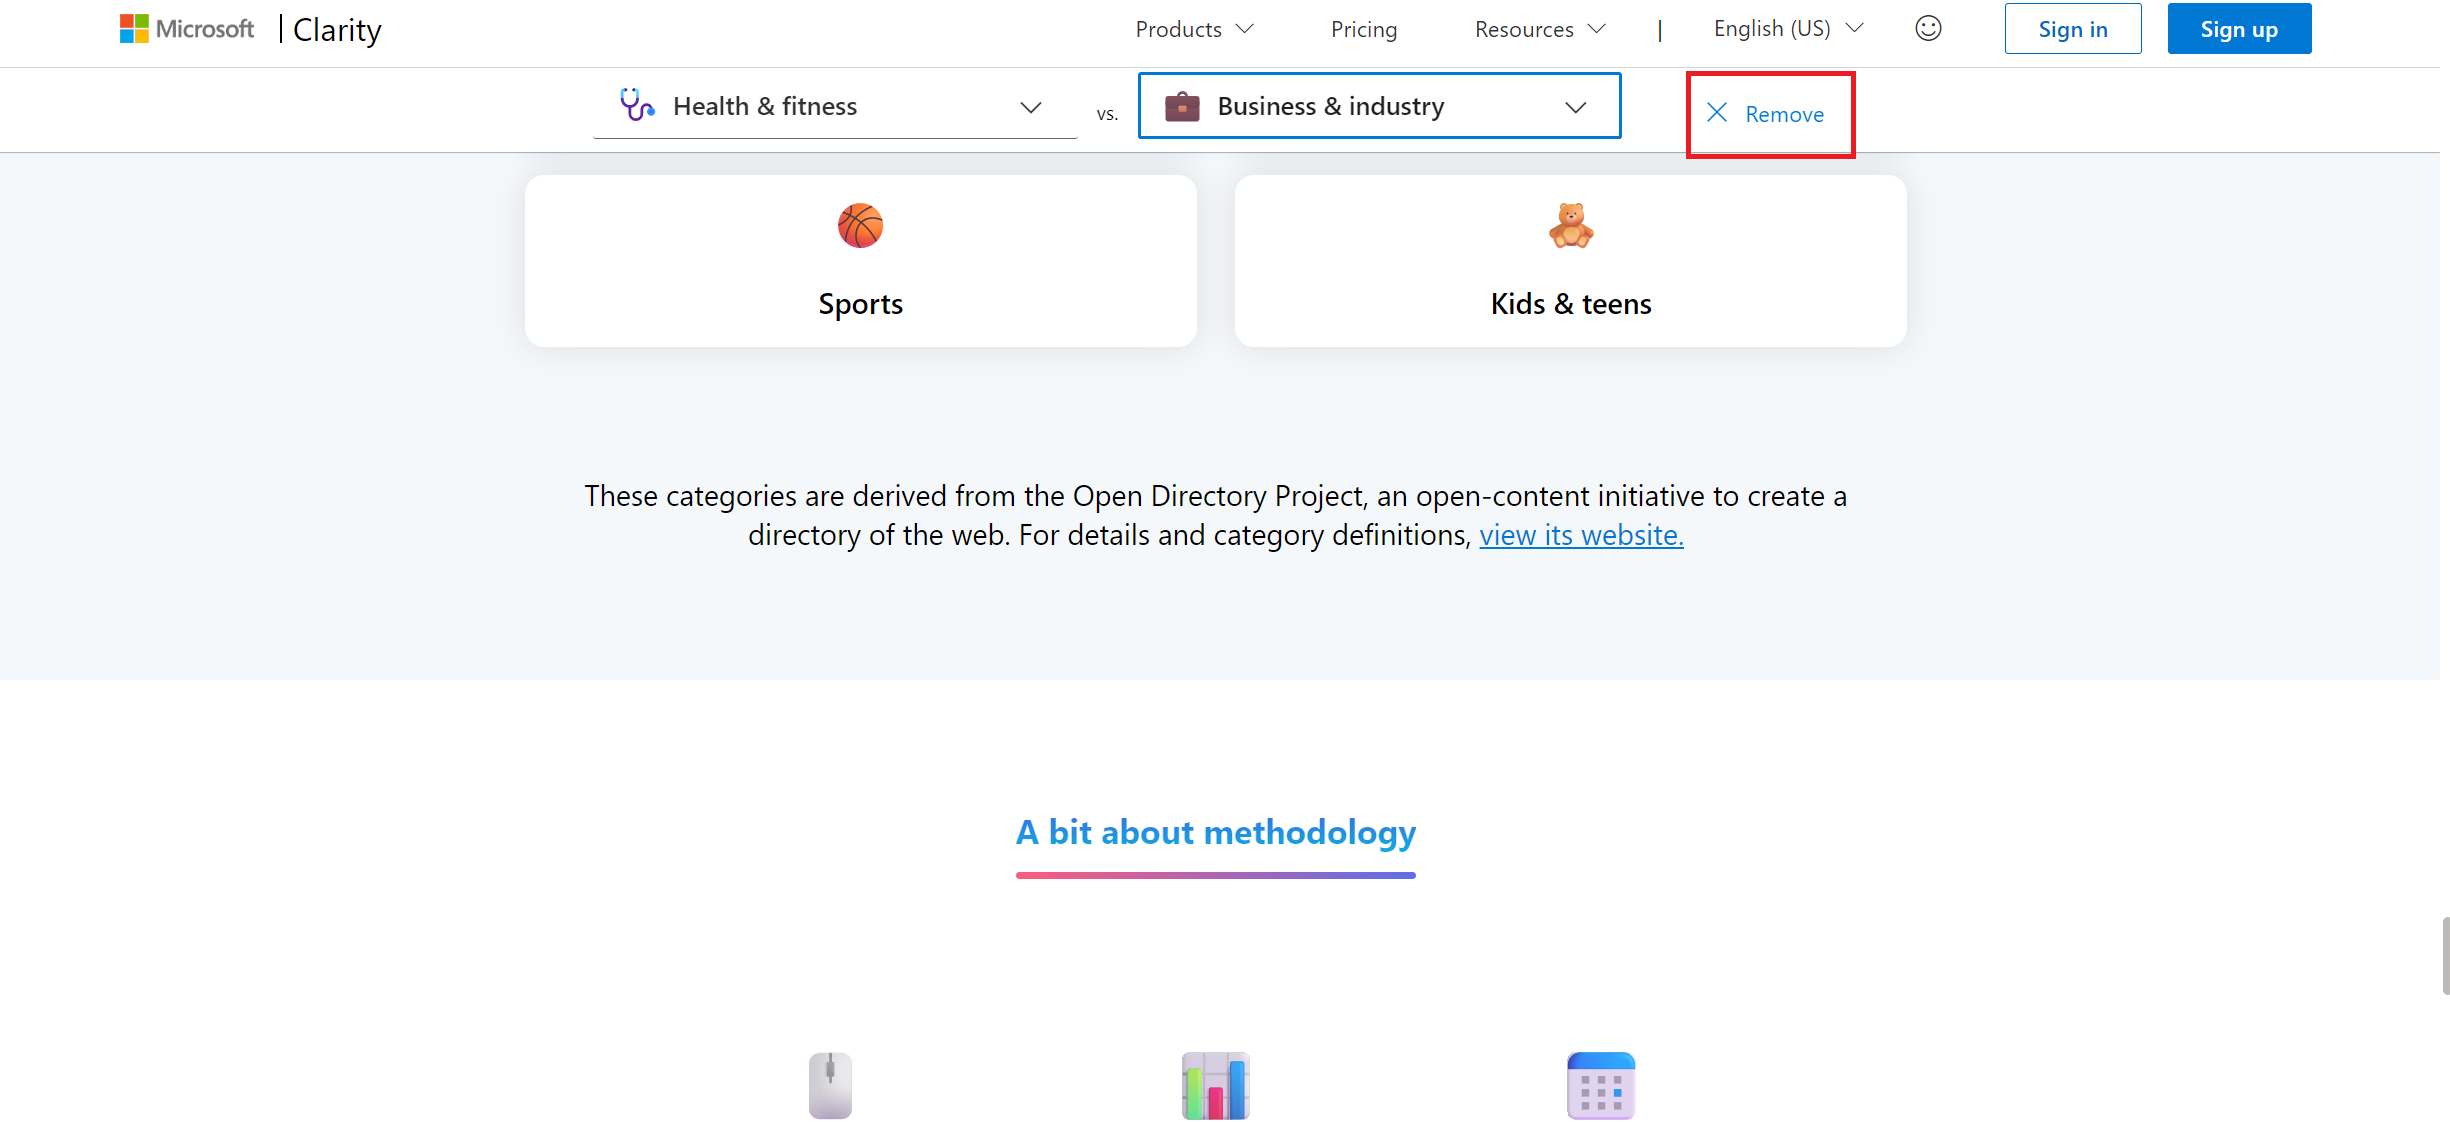
Select Remove next to the categories to remove the comparison and view only one site category.
FAQ
For more answers, refer to the Benchmarks FAQ.