Office スクリプトのサンプル シナリオ: NOAA から水位データをフェッチしてグラフ化する
このシナリオでは、 米国海洋大気局のシアトル駅で水位をプロットする必要があります。 外部データを使用してスプレッドシートを設定し、グラフを作成します。
このコマンドを使用 fetch して NOAA Tides および Currents データベースのクエリを実行するスクリプトを開発します。 これは、特定の期間にわたって記録された水位を取得します。 情報は JSON として返されるため、スクリプトの一部によって範囲の値に変換されます。 データがスプレッドシートに含まれると、グラフの作成に使用されます。
JSON の操作の詳細については、「JSON を 使用して Office スクリプトとの間でデータを渡す」を参照してください。
対象となるスクリプティング スキル
- 外部 API 呼び出し (
fetch) - JSON 解析
- グラフ
セットアップ手順
Excel でブックを開きます。
[ 自動化 ] タブの [ 新しいスクリプト ] を選択し、次のスクリプトをエディターに貼り付けます。
/**
 * Gets data from the National Oceanic and Atmospheric Administration's Tides and Currents database.
 * That data is used to make a chart.
 */
async function main(workbook: ExcelScript.Workbook) {
  // Get the current sheet.
  let currentSheet = workbook.getActiveWorksheet();

  // Create selection of parameters for the fetch URL.
  // More information on the NOAA APIs is found here:
  // https://api.tidesandcurrents.noaa.gov/api/prod/
  const option = "water_level";
  const startDate = "20201225"; /* yyyymmdd date format */
  const endDate = "20201227";
  const station = "9447130"; /* Seattle */

  // Construct the URL for the fetch call.
  const strQuery = `https://api.tidesandcurrents.noaa.gov/api/prod/datagetter?product=${option}&begin_date=${startDate}&end_date=${endDate}&datum=MLLW&station=${station}&units=english&time_zone=gmt&application=NOS.COOPS.TAC.WL&format=json`;

  console.log(strQuery);

  // Resolve the Promises returned by the fetch operation.
  const response = await fetch(strQuery);
  const rawJson: string = await response.json();

  // Translate the raw JSON into a usable state.
  const stringifiedJson = JSON.stringify(rawJson);

  // Note that we're only taking the data part of the JSON and excluding the metadata.
  const noaaData: NOAAData[] = JSON.parse(stringifiedJson).data;

  // Create table headers and format them to stand out.
  let headers = [["Time", "Level"]];
  let headerRange = currentSheet.getRange("A1:B1");
  headerRange.setValues(headers);
  headerRange.getFormat().getFill().setColor("#4472C4");
  headerRange.getFormat().getFont().setColor("white");

  // Insert all the data in rows from JSON.
  let noaaDataCount = noaaData.length;
  let dataToEnter = [[], []]
  for (let i = 0; i < noaaDataCount; i++) {
    let currentDataPiece = noaaData[i];
    dataToEnter[i] = [currentDataPiece.t, currentDataPiece.v];
  }

  let dataRange = currentSheet.getRange("A2:B" + String(noaaDataCount + 1)); /* +1 to account for the title row */
  dataRange.setValues(dataToEnter);

  // Format the "Time" column for timestamps.
  dataRange.getColumn(0).setNumberFormatLocal("[$-en-US]mm/dd/yyyy hh:mm AM/PM;@");

  // Create and format a chart with the level data.
  let chart = currentSheet.addChart(ExcelScript.ChartType.xyscatterSmooth, dataRange);
  chart.getTitle().setText("Water Level - Seattle");
  chart.setTop(0);
  chart.setLeft(300);
  chart.setWidth(500);
  chart.setHeight(300);
  chart.getAxes().getValueAxis().setShowDisplayUnitLabel(false);
  chart.getAxes().getCategoryAxis().setTextOrientation(60);
  chart.getLegend().setVisible(false);

  // Add a comment with the data attribution.
  currentSheet.addComment(
    "A1",
    `This data was taken from the National Oceanic and Atmospheric Administration's Tides and Currents database on ${new Date(Date.now())}.`
  );

  /**
   * An interface to wrap the parts of the JSON we need.
   * These properties must match the names used in the JSON.
   */
  interface NOAAData {
    t: string; // Time
    v: number; // Level
  }
}
スクリプトの名前を NOAA 水位グラフ に変更し、保存します。
スクリプトを実行する
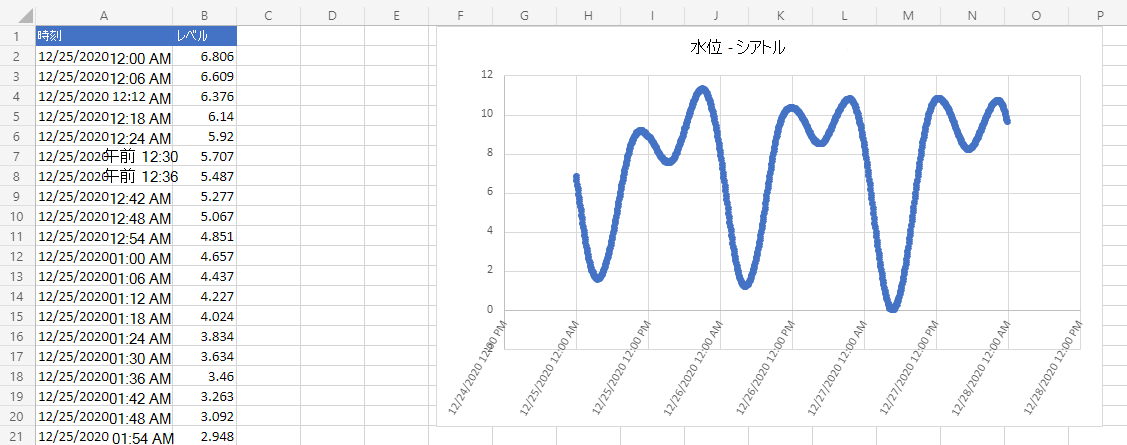
任意のワークシートで、 NOAA 水位グラフ スクリプトを実行します。 スクリプトは、2020 年 12 月 25 日から 2020 年 12 月 27 日までの水位データをフェッチします。 スクリプトの先頭にある変数は const 、異なる日付を使用するか、別のステーション情報を取得するように変更できます。 データ取得用の CO-OPS API では、このすべてのデータを取得する方法について説明します。
スクリプトを実行した後
Office Scripts
フィードバック
以下は間もなく提供いたします。2024 年を通じて、コンテンツのフィードバック メカニズムとして GitHub の issue を段階的に廃止し、新しいフィードバック システムに置き換えます。 詳細については、「https://aka.ms/ContentUserFeedback」を参照してください。
フィードバックの送信と表示