マップに多角形レイヤーを追加する (Android SDK)
この記事では、多角形レイヤーを使用してマップ上に Polygon および MultiPolygon フィーチャー ジオメトリの領域をレンダリングする方法を示します。
Note
Azure Maps Android SDK の廃止
Android 用 Azure Maps Native SDK は非推奨となり、2025 年 3 月 31 日に廃止されます。 サービスの中断を回避するには、2025 年 3 月 31 日までに Azure Maps Web SDK に移行します。 詳細については、「Azure Maps Android SDK 移行ガイド」を参照してください。
前提条件
クイックスタート: Android アプリの作成に関する記事の手順を必ず完了してください。 この記事のコード ブロックは、マップ onReady イベント ハンドラーに挿入できます。
多角形レイヤーを使用する
多角形レイヤーがデータ ソースに接続されていると、マップに読み込まれるときに、Polygon および MultiPolygon フィーチャーを含む領域がレンダリングされます。 多角形を作成し、データ ソースに追加し、PolygonLayer クラスを使用して多角形レイヤーでレンダリングします。
//Create a data source and add it to the map.
DataSource source = new DataSource();
map.sources.add(source);

//Create a rectangular polygon.
source.add(Polygon.fromLngLats(
    Arrays.asList(
        Arrays.asList(
            Point.fromLngLat(-73.98235, 40.76799),
            Point.fromLngLat(-73.95785, 40.80044),
            Point.fromLngLat(-73.94928, 40.79680),
            Point.fromLngLat(-73.97317, 40.76437),
            Point.fromLngLat(-73.98235, 40.76799)
        )
    )
));

//Create and add a polygon layer to render the polygon on the map, below the label layer.
map.layers.add(new PolygonLayer(source,
    fillColor("red"),
    fillOpacity(0.7f)
), "labels");
//Create a data source and add it to the map.
val source = DataSource()
map.sources.add(source)

//Create a rectangular polygon.
source.add(
    Polygon.fromLngLats(
        Arrays.asList(
            Arrays.asList(
                Point.fromLngLat(-73.98235, 40.76799),
                Point.fromLngLat(-73.95785, 40.80044),
                Point.fromLngLat(-73.94928, 40.79680),
                Point.fromLngLat(-73.97317, 40.76437),
                Point.fromLngLat(-73.98235, 40.76799)
            )
        )
    )
)

//Create and add a polygon layer to render the polygon on the map, below the label layer.
map.layers.add(
    PolygonLayer(
        source,
        fillColor("red"),
        fillOpacity(0.7f)
    ), "labels"
)
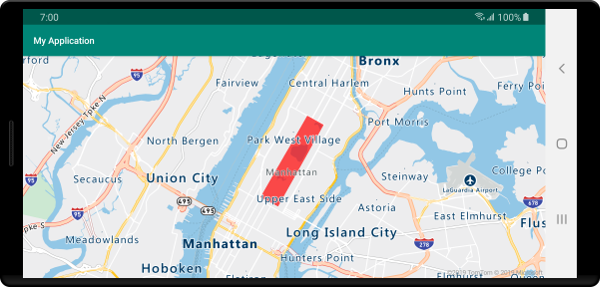
次のスクリーンショットは、上記のコードによって、多角形レイヤーを使用して多角形の領域がレンダリングされている状態を示しています。

多角形と線レイヤーを同時に使用する
線レイヤーを使用して、多角形のアウトラインをレンダリングします。 次のコード サンプルでは、前の例のように多角形がレンダリングされますが、今度は線レイヤーが追加されます。 この線レイヤーは、データ ソースに接続される 2 番目のレイヤーです。
//Create a data source and add it to the map.
DataSource source = new DataSource();
map.sources.add(source);

//Create a rectangular polygon.
source.add(Polygon.fromLngLats(
    Arrays.asList(
        Arrays.asList(
            Point.fromLngLat(-73.98235, 40.76799),
            Point.fromLngLat(-73.95785, 40.80044),
            Point.fromLngLat(-73.94928, 40.79680),
            Point.fromLngLat(-73.97317, 40.76437),
            Point.fromLngLat(-73.98235, 40.76799)
        )
    )
));

//Create and add a polygon layer to render the polygon on the map, below the label layer.
map.layers.add(new PolygonLayer(source,
    fillColor("rgba(0, 200, 200, 0.5)")
), "labels");

//Create and add a line layer to render the outline of the polygon.
map.layers.add(new LineLayer(source,
    strokeColor("red"),
    strokeWidth(2f)
));
//Create a data source and add it to the map.
val source = DataSource()
map.sources.add(source)

//Create a rectangular polygon.
source.add(
    Polygon.fromLngLats(
        Arrays.asList(
            Arrays.asList(
                Point.fromLngLat(-73.98235, 40.76799),
                Point.fromLngLat(-73.95785, 40.80044),
                Point.fromLngLat(-73.94928, 40.79680),
                Point.fromLngLat(-73.97317, 40.76437),
                Point.fromLngLat(-73.98235, 40.76799)
            )
        )
    )
)

//Create and add a polygon layer to render the polygon on the map, below the label layer.
map.layers.add(
    PolygonLayer(
        source,
        fillColor("rgba(0, 200, 200, 0.5)")
    ), "labels"
)

//Create and add a line layer to render the outline of the polygon.
map.layers.add(
    LineLayer(
        source,
        strokeColor("red"),
        strokeWidth(2f)
    )
)
次のスクリーンショットは、アウトラインが線レイヤーを使用してレンダリングされた多角形が、上記のコードによってレンダリングされている状態を示しています。

ヒント
線レイヤーを使用して多角形のアウトラインを設定する場合は、ポイントの各配列の起点および終点が同じになるように、必ず多角形のすべてのリングを閉じてください。 このように行わないと、線レイヤーは多角形の最後の点を最初の点に接続できなくなる可能性があります。
多角形をパターンで塗りつぶす
多角形を色で塗りつぶすだけでなく、イメージのパターンを使用して多角形を塗りつぶすこともできます。 画像パターンをマップ画像スプライト リソースに読み込んでから、このイメージを多角形レイヤーの fillPattern オプションで参照します。
//Load an image pattern into the map image sprite.
map.images.add("fill-checker-red", R.drawable.fill_checker_red);

//Create a data source and add it to the map.
DataSource source = new DataSource();
map.sources.add(source);

//Create a polygon.
source.add(Polygon.fromLngLats(
    Arrays.asList(
        Arrays.asList(
            Point.fromLngLat(-50, -20),
            Point.fromLngLat(0, 40),
            Point.fromLngLat(50, -20),
            Point.fromLngLat(-50, -20)
        )
    )
));

//Create and add a polygon layer to render the polygon on the map, below the label layer.
map.layers.add(new PolygonLayer(source,
        fillPattern("fill-checker-red"),
        fillOpacity(0.5f)
), "labels");
//Load an image pattern into the map image sprite.
map.images.add("fill-checker-red", R.drawable.fill_checker_red)

//Create a data source and add it to the map.
val source = DataSource()
map.sources.add(source)

//Create a polygon.
source.add(
    Polygon.fromLngLats(
        Arrays.asList(
            Arrays.asList(
                Point.fromLngLat(-50, -20),
                Point.fromLngLat(0, 40),
                Point.fromLngLat(50, -20),
                Point.fromLngLat(-50, -20)
            )
        )
    )
)

//Create and add a polygon layer to render the polygon on the map, below the label layer.
map.layers.add(
    PolygonLayer(
        source,
        fillPattern("fill-checker-red"),
        fillOpacity(0.5f)
    ), "labels"
)
このサンプルでは、次の画像がアプリのドローアブル フォルダーに読み込まれています。
 |
|---|
| fill-checker-red.png |
次の画像は、上のコードによって、塗りつぶしパターンを使用してマップ上に多角形をレンダリングしているスクリーンショットです。

次のステップ
マップに追加できる他のコード サンプルについては、次の記事をご覧ください。