How correlate Perfmon logs to ULS logs
Have you ever had the situation where all of a sudden, you're seeing high CPU on your SharePoint environment and you don't have know how to read a memory dump? I'm going to show in this article that you can get surface information on how extract details out of the logging system that is already in place. To do so we'll need to correlate 2 log types, Performance Monitor (Perfmon) logs and SharePoint ULS logs. If we follow the steps below, we can create a 1:1 relationship on the data and then use that data back track into why or a general area to focus on to determine why high CPU is occurring. For clarity this does method does not solve all types of high CPU situations, but it does cover a significant amount of them.
I've created a lab environment and we will be walking through how to setup and read the information we've collected.
Setup:
Before we can start we must first configure Perfmon to log additional data in the Perfmon data file.
- Enable ProcessName and ThreadName format in the registry: Computer\HKEY_LOCAL_MACHINE\SYSTEM\CurrentControlSet\Services\PerfProc\Performance
- Create DWORDs below and set value to 2:
- ProcessNameFormat
- ThreadNameFormat
- A reboot is not required for changes to take effect.
- To revert to original operation of Perfmon remove the DWORDs
- Create DWORDs below and set value to 2:
- Start the Desired Perfmon counter set, make sure it has at least the Process counter and all of its items.
From the SharePoint side we would get the most benefit of logging level set to verbose.
To quickly set it to verbose mode run: Set-SPLogLevel -TraceSeverity verboseEX
To return it back to normal run: Clear-SPLogLevel
Reproduce the issue:
Reproduce the issue you are seeing and then stop the logging for Perfmon and ULS.
Now that we have two datapoints, open both up.
In Perfmon when we open the Process counter we should see this each process name with original PID value.
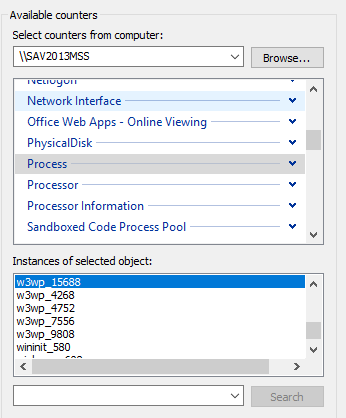
The PID values here are in DEC format.
In ULS, the PID is stored in HEX format.
So we will have to convert these to get our direct mapping to ULS.
The most common scenario of doing is during high CPU situations and we want to take a quick look at could be causing the problem.
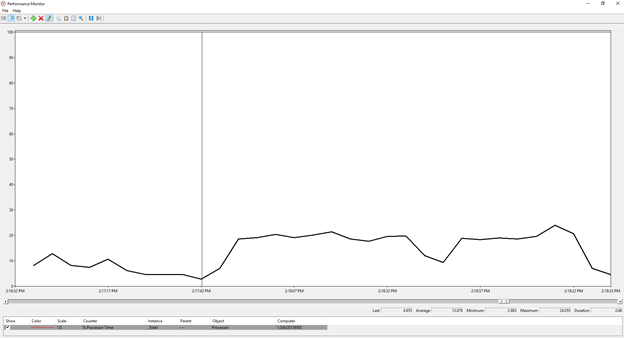
Here is a quick example of CPU going when it shouldn't be:
Total CPU time:
We know the site resides in W3WP PID 4752 and we confirmed in Perfmon that this process is using the most CPU time.
Process break down, we can clearly see that PID 4752 using up most of the CPU time.
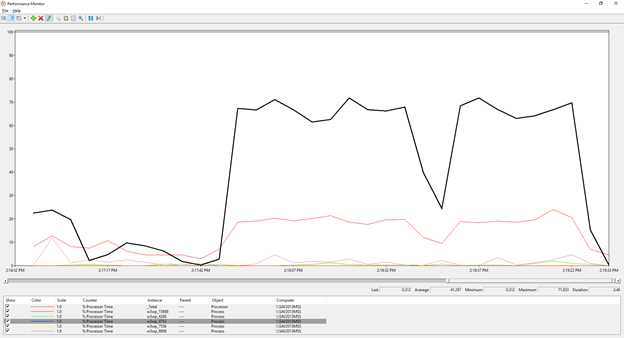
So we take DEC value 4752 and convert that to HEX and we get 1290. Now we can go to ULS and set our filters.
We know the approximate time frame and we know the PID from the Perfmon data.
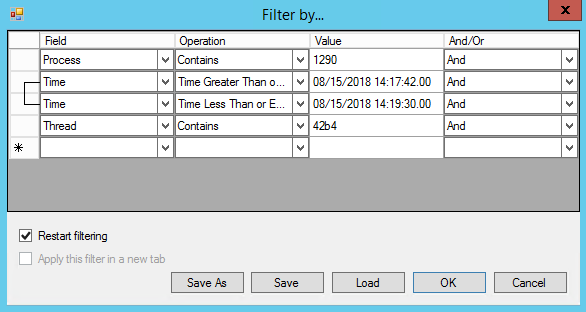
So the filter would look like this:
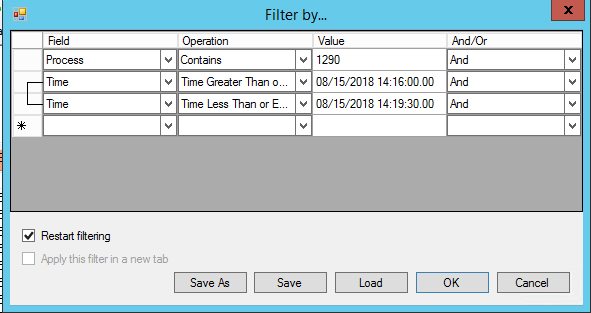
This brings us ULS entries that pertains to just this time frame for this PID.
Now we need to narrow down further.
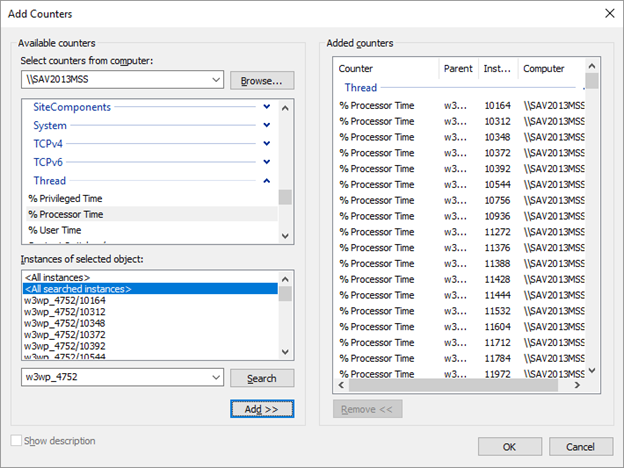
In Perfmon, clear out the graph and then Add Thread Counter. But do not add it all to the graph yet.
You'll notice that Thread takes a long time to expand. Once expanded you'll see % Processor Time.
In the Search box enter: W3wp_4752 and press Search and select "All Searched instances". Then finally add this to the graph. It should look like this:
Now we should get thread processor usage time graph along with closer times.
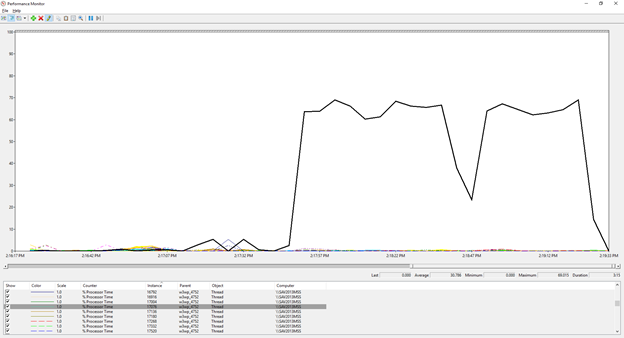
Notice that most of the other threads are barely any CPU time, but we have a single lone thread consuming almost 70% CPU time by itself. Technically it is not 70% CPU time. This value is derived from total CPU time per CPU core. In the case of this lab machine, it has 8 CPU cores. So what we are seeing is we have a single thread operation consuming the time of a single core's worth of CPU.
Now we will need to take the Thread Instance value and convert this to HEX.
17076 in DEC is 42b4 in HEX.
After that we just need to update our Filter to include this:
Now we can start to investigate closer in ULS.
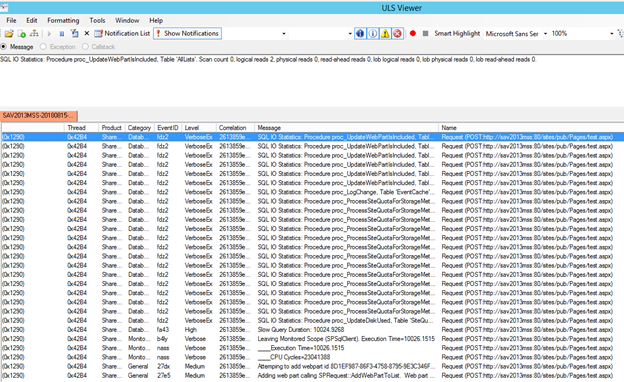
We then see that this thread request was for a site on /sites/pub/test.aspx and it was trying to do an Add web part operation.
So already at a high level we know someone made a change on the site to a particular page and this change was very expensive as the symptom we see was abnormal CPU usage.
If we inspect this call further for other abnormalities in this case, we see:
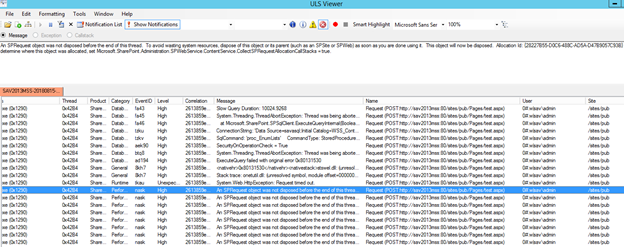
An abnormal amount of NASK and NASQ event ID's which are objects not disposed messages.
To expand these out we need to enable Microsoft.SharePoint.Administration.SPWebService.ContentService.CollectSPRequestAllocationCallStacks = true
This can be done via:
[System.Reflection.Assembly]::LoadWithPartialName("Microsoft.SharePoint") > $null $contentSvc = [Microsoft.SharePoint.Administration.SPWebService]::ContentService $contentSvc.CollectSPRequestAllocationCallStacks = $true $contentSvc.Update()
Once this is enabled we can surface the problem area quickly in ULS.
When we expand this out further:
08/15/2018 14:17:50.78 w3wp.exe (0x1290) 0x42B4 SharePoint Foundation Performance naqx Verbose Potentially excessive number of SPRequest objects (117) currently unreleased on thread 161. Ensure that this object or its parent (such as an SPWeb or SPSite) is being properly disposed. Allocation Id for this object: {639655BE-E30E-4F81-B63B-BB97ADA2D83A} Stack trace of current allocation: at Microsoft.SharePoint.SPGlobal.CreateSPRequestAndSetIdentity(SPSite site, String name, Boolean bNotGlobalAdminCode, String strUrl, Boolean bNotAddToContext, Byte[] UserToken, SPAppPrincipalToken appPrincipalToken, String userName, Boolean bIgnoreTokenTimeout, Boolean bAsAnonymous) at Microsoft.SharePoint.SPWeb.InitializeSPRequest() at Microsoft.SharePoint.SPWeb.EnsureSPRequest() at Microsoft.SharePoint.SPWeb.get_Request() at Microsoft.SharePoint.SPListCollection.EnsureListsData(Guid webId, String strListName) at Microsoft.SharePoint.SPListCollection.EnsureListsData(String strListName) at Microsoft.SharePoint.SPBaseCollection.GetEnumerator() at highmem926_3.VisualWebPart1.VisualWebPart1UserControl.eatmem() at highmem926_3.VisualWebPart1.VisualWebPart1UserControl.Page_Load(Object sender, EventArgs e) at System.Web.UI.Control.OnLoad(EventArgs e) at System.Web.UI.Control.LoadRecursive() at System.Web.UI.Control.AddedControl(Control control, Int32 index) at highmem926_3.VisualWebPart1.VisualWebPart1.CreateChildControls() at System.Web.UI.Control.EnsureChildControls() at System.Web.UI.Control.PreRenderRecursiveInternal() at System.Web.UI.Control.PreRenderRecursiveInternal() at System.Web.UI.Control.PreRenderRecursiveInternal() at System.Web.UI.Control.PreRenderRecursiveInternal() at System.Web.UI.Control.PreRenderRecursiveInternal() at System.Web.UI.Control.PreRenderRecursiveInternal() at System.Web.UI.Control.PreRenderRecursiveInternal() at System.Web.UI.Page.ProcessRequestMain(Boolean includeStagesBeforeAsyncPoint, Boolean includeStagesAfterAsyncPoint) at System.Web.UI.Page.ProcessRequest(Boolean includeStagesBeforeAsyncPoint, Boolean includeStagesAfterAsyncPoint) at System.Web.UI.Page.ProcessRequest() at System.Web.UI.Page.ProcessRequest(HttpContext context) at Microsoft.SharePoint.Publishing.TemplateRedirectionPage.ProcessRequest(HttpContext context) at System.Web.HttpApplication.CallHandlerExecutionStep.System.Web.HttpApplication.IExecutionStep.Execute() at System.Web.HttpApplication.ExecuteStep(IExecutionStep step, Boolean& completedSynchronously) at System.Web.HttpApplication.PipelineStepManager.ResumeSteps(Exception error) at System.Web.HttpApplication.BeginProcessRequestNotification(HttpContext context, AsyncCallback cb) at System.Web.HttpRuntime.ProcessRequestNotificationPrivate(IIS7WorkerRequest wr, HttpContext context) at System.Web.Hosting.PipelineRuntime.ProcessRequestNotificationHelper(IntPtr rootedObjectsPointer, IntPtr nativeRequestContext, IntPtr moduleData, Int32 flags) at System.Web.Hosting.PipelineRuntime.ProcessRequestNotification(IntPtr rootedObjectsPointer, IntPtr nativeRequestContext, IntPtr moduleData, Int32 flags) at System.Web.Hosting.UnsafeIISMethods.MgdIndicateCompletion(IntPtr pHandler, RequestNotificationStatus& notificationStatus) at System.Web.Hosting.UnsafeIISMethods.MgdIndicateCompletion(IntPtr pHandler, RequestNotificationStatus& notificationStatus) at System.Web.Hosting.PipelineRuntime.ProcessRequestNotificationHelper(IntPtr rootedObjectsPointer, IntPtr nativeRequestContext, IntPtr moduleData, Int32 flags) at System.Web.Hosting.PipelineRuntime.ProcessRequestNotification(IntPtr rootedObjectsPointer, IntPtr nativeRequestContext, IntPtr moduleData, Int32 flags) 2613859e-0a13-90f4-54b9-4fcf37c9e131
Cleaned up this reads:
Potentially excessive number of SPRequest objects (117) currently unreleased on thread 161. Ensure that this object or its parent (such as an SPWeb or SPSite) is being properly disposed. Allocation Id for this object: {639655BE-E30E-4F81-B63B-BB97ADA2D83A} Stack trace of current allocation:
at Microsoft.SharePoint.SPGlobal.CreateSPRequestAndSetIdentity(SPSite site, String name, Boolean bNotGlobalAdminCode, String strUrl, Boolean bNotAddToContext, Byte[] UserToken, SPAppPrincipalToken appPrincipalToken, String userName, Boolean bIgnoreTokenTimeout, Boolean bAsAnonymous)
at Microsoft.SharePoint.SPWeb.InitializeSPRequest()
at Microsoft.SharePoint.SPWeb.EnsureSPRequest()
at Microsoft.SharePoint.SPWeb.get_Request()
at Microsoft.SharePoint.SPListCollection.EnsureListsData(Guid webId, String strListName)
at Microsoft.SharePoint.SPListCollection.EnsureListsData(String strListName)
at Microsoft.SharePoint.SPBaseCollection.GetEnumerator()
at highmem926_3.VisualWebPart1.VisualWebPart1UserControl.eatmem()
at highmem926_3.VisualWebPart1.VisualWebPart1UserControl.Page_Load(Object sender, EventArgs e)
at System.Web.UI.Control.OnLoad(EventArgs e)
at System.Web.UI.Control.LoadRecursive()
at System.Web.UI.Control.AddedControl(Control control, Int32 index)
at highmem926_3.VisualWebPart1.VisualWebPart1.CreateChildControls()
at System.Web.UI.Control.EnsureChildControls()
at System.Web.UI.Control.PreRenderRecursiveInternal()
at System.Web.UI.Control.PreRenderRecursiveInternal()
at System.Web.UI.Control.PreRenderRecursiveInternal()
at System.Web.UI.Control.PreRenderRecursiveInternal()
at System.Web.UI.Control.PreRenderRecursiveInternal()
at System.Web.UI.Control.PreRenderRecursiveInternal()
at System.Web.UI.Control.PreRenderRecursiveInternal()
at System.Web.UI.Page.ProcessRequestMain(Boolean includeStagesBeforeAsyncPoint, Boolean includeStagesAfterAsyncPoint)
at System.Web.UI.Page.ProcessRequest(Boolean includeStagesBeforeAsyncPoint, Boolean includeStagesAfterAsyncPoint)
at System.Web.UI.Page.ProcessRequest()
at System.Web.UI.Page.ProcessRequest(HttpContext context)
at Microsoft.SharePoint.Publishing.TemplateRedirectionPage.ProcessRequest(HttpContext context)
at System.Web.HttpApplication.CallHandlerExecutionStep.System.Web.HttpApplication.IExecutionStep.Execute()
at System.Web.HttpApplication.ExecuteStep(IExecutionStep step, Boolean& completedSynchronously)
at System.Web.HttpApplication.PipelineStepManager.ResumeSteps(Exception error)
at System.Web.HttpApplication.BeginProcessRequestNotification(HttpContext context, AsyncCallback cb)
at System.Web.HttpRuntime.ProcessRequestNotificationPrivate(IIS7WorkerRequest wr, HttpContext context)
at System.Web.Hosting.PipelineRuntime.ProcessRequestNotificationHelper(IntPtr rootedObjectsPointer, IntPtr nativeRequestContext, IntPtr moduleData, Int32 flags)
at System.Web.Hosting.PipelineRuntime.ProcessRequestNotification(IntPtr rootedObjectsPointer, IntPtr nativeRequestContext, IntPtr moduleData, Int32 flags)
at System.Web.Hosting.UnsafeIISMethods.MgdIndicateCompletion(IntPtr pHandler, RequestNotificationStatus& notificationStatus)
at System.Web.Hosting.UnsafeIISMethods.MgdIndicateCompletion(IntPtr pHandler, RequestNotificationStatus& notificationStatus)
at System.Web.Hosting.PipelineRuntime.ProcessRequestNotificationHelper(IntPtr rootedObjectsPointer, IntPtr nativeRequestContext, IntPtr moduleData, Int32 flags)
at System.Web.Hosting.PipelineRuntime.ProcessRequestNotification(IntPtr rootedObjectsPointer, IntPtr nativeRequestContext, IntPtr moduleData, Int32 flags)
In this call stack for the operation, we see custom code: highmem926_3.VisualWebPart1.VisualWebPart1.CreateChildControls() which was trying to run: highmem926_3.VisualWebPart1.VisualWebPart1UserControl.eatmem()
So clearly, someone was trying to add this highmem926 webpart on the page and one of its functions was not written properly.
We didn't really need to go as deep as figuring it out what component on the page was causing this, but with this method shown we can use it to help determine or narrow down the root cause at this level. We could have stopped at page that was found which was for sites/pub/test.aspx as something abnormal was going on with that page.
This method applies to all versions of SharePoint. It also works if you apply for other process.exe as well.