DevTools in the Windows 10 Fall Creators Update (EdgeHTML 16)
With this release we started a major DevTools refactoring effort for improved robustness and performance, and also added a bunch of new features you can start using today!
Here are the Microsoft Edge DevTools features that shipped with the Windows 10 Fall Creators Update (EdgeHTML 16).
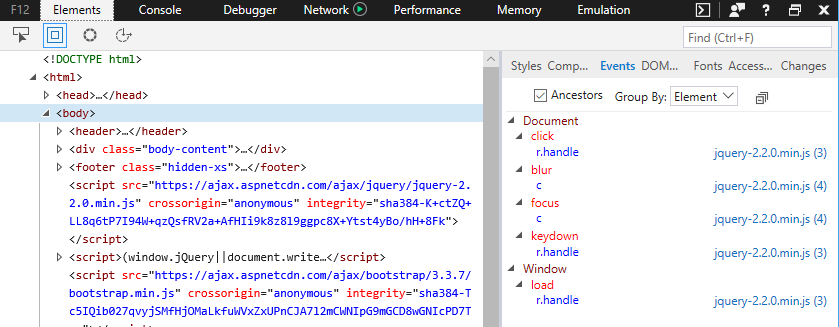
Ancestor event listeners
The Events pane now adds the option to view event listeners registered on any ancestor of the currently selected element (in the Elements panel), in addition to those on the element itself. Additionally, you can now group the event listener display by either Event or Element.
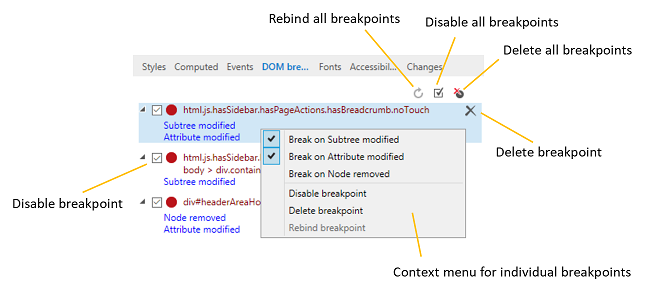
DOM mutation breakpoints
You can now set DOM mutation breakpoints to break into the Debugger whenever a selected element node changes. From the Elements panel, rt-click on any element in the DOM tree view and select one or more of the following:
- Break on Node removed
- Break on Subtree modified
- Break on Attribute modified
You can manage your mutation breakpoints from the DOM breakpoints pane in the Elements or Debugger panels.
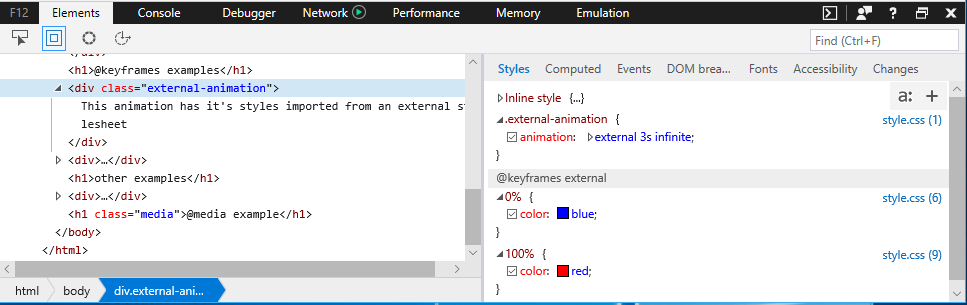
CSS at-rule support
CSS "at" (@) rules are now represented among other CSS rule declarations on the Styles pane, including animation @keyframes rules (currently limited to read-only), @supports feature queries, and @media queries.
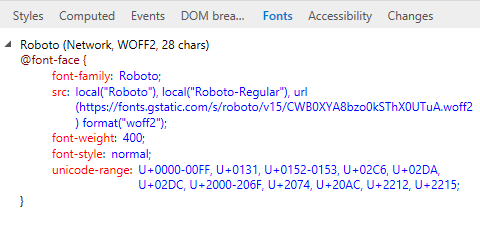
CSS fonts pane
CSS @font-face rules now have their own dedicated Fonts pane that displays where the font is loaded from (Local or Network) and how many characters are using it. If a font is loaded from the network, DevTools will display the rule that imported it along with its alias and font type.
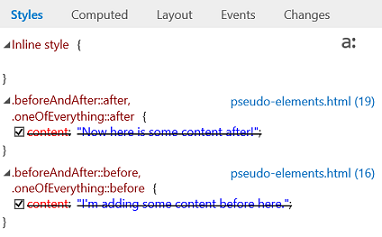
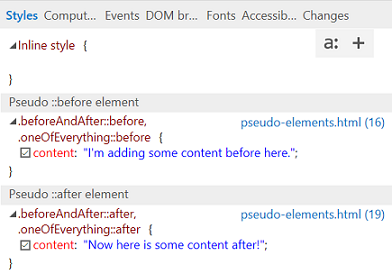
CSS pseudo-element support
The Styles pane now groups pseudo-elements under their own headings and no longer displays their content as crossed out.
Before:
After:
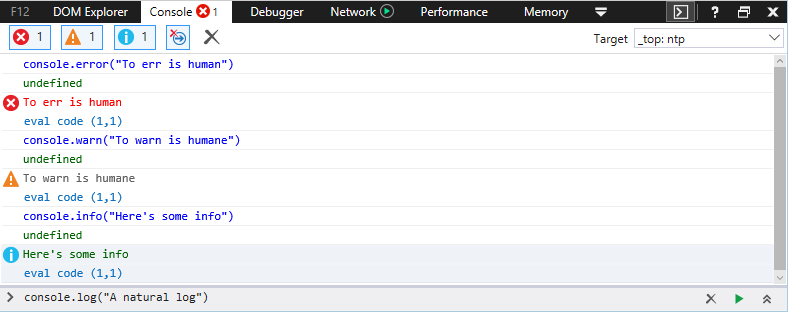
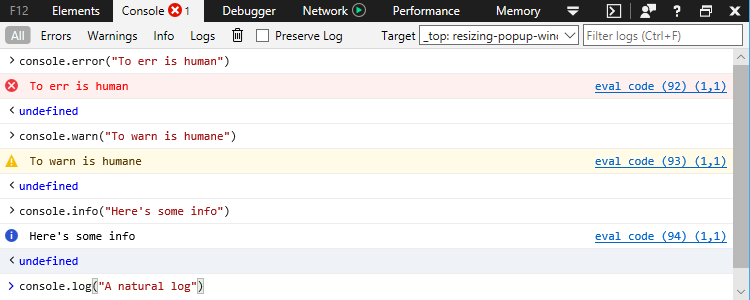
Console improvements
The Console panel got a UX overhaul for improved usability and a faster, richer Intellisense experience.
Before:
After:
We also added these improvements:
Use
Shift + Enterto add an additional line to a command before executing it withEnter. (Formerly there was a Switch to multiline/single-line mode toggle button.)The following new APIs are supported:
- console.table(object) method
- getEventListeners(object) command
- keys(object) command
- values(object) command
- $x(xpath expression) selector
The %c() formatting parameter is now supported
Debugging improvements
In addition to a suite of new features for debugging your PWA service workers and cache, the Debugger added these features:
Consolidated debugging for shared resources
Even when a resource, such as a file loaded from CDN, is referenced multiple times throughout your code, DevTools will now provide a single debugging instance for that file where you can then set common breakpoints which will be hit regardless of where that file is referenced. (Previously each script reference was considered a unique resource would map to a separate set of breakpoints.)
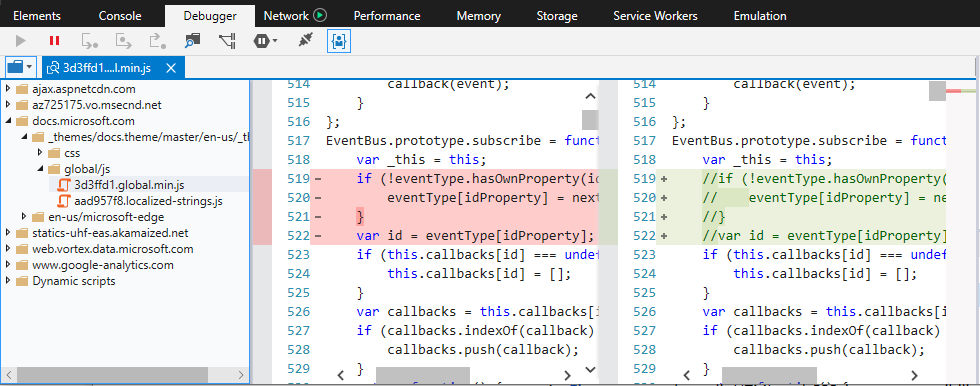
Live edit JavaScript with Edit-on-idle
You can now edit your JavaScript live during a debugging session. This feature was experimentally available (behind a flag) in the previous (Windows 10 Creators Update) release and now its a permanent feature. Simply select any script file from the Debugger panel, edit, then click Save (or Ctrl+S) to test your changes next time that section of code runs.
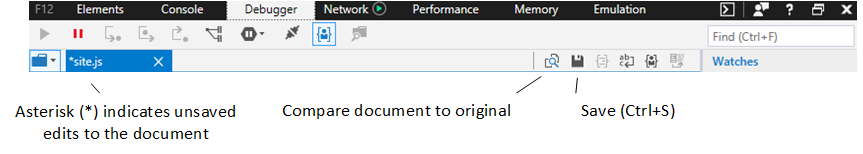
Click the Compare document to original button to view the diff of what you changed.
Please be aware of the following constraints:
- Script editing only works in external .js files (and not embedded
<script>within .html) - Edits are saved in memory and flushed when the document is reloaded, thus you won’t be able to run edits inside a
DOMContentLoadedhandler, for example - Currently there’s no way (such as a Save As option) to save your edits to disk from DevTools
Shortcuts
You can now launch DevTools to the last viewed panel (Ctrl+Shift+I) or directly to the Console (Ctrl+Shift+J) just like you would on other major browsers.
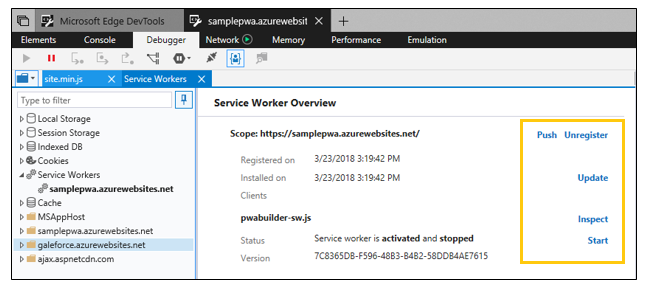
Progressive Web App debugging
Test out the experimental support for Progressive Web Apps (PWAs) in Microsoft Edge and DevTools by selecting the Enable service workers option from about:flags (and restarting Microsoft Edge). If a site makes use of Service Workers and/or the Cache API, will populate entries in the Debugger panel for each origin, similar to how web storage and cookie inspection work.
Clicking on a specific service worker entry will open up the Service Worker Overview, where you can manage the service worker registration for the given scope and force a test push notification. You can also Stop/Start individual service workers and Inspect them from a separate debugger window:
Please note the following about service worker debugging:
- Debugging a service worker will launch a new instance of the DevTools separate from the page's tools because service workers can be shared across multiple tabs.
- The Elements and Emulation panels are absent from the service worker debugger, given that service workers run in the background and do not directly control the front-end of your app.
- Currently network traffic for a service worker is only reported from the DevTools debugging instance for that worker, and not from the central instance for the page itself.
Clicking on a specific cache entry will open up the Cache manager, where you can inspect and optionally delete cache entries (Request and Response key/value pairs).