R エコシステムには、さまざまな機能が収められた複数のグラフ作成ライブラリが用意されています。 既定では、Microsoft Fabric のすべての Apache Spark プールに、厳選された人気の高いオープンソース ライブラリのセットが含まれています。 Microsoft Fabric ライブラリ管理機能を使用して、ライブラリまたはバージョンをさらに追加したり、管理したりします。
前提条件
Microsoft Fabric サブスクリプションを取得します。 または、無料の Microsoft Fabric 試用版にサインアップします。
Microsoft Fabric にサインインします。
ホーム ページの左下にあるエクスペリエンス スイッチャーを使用して Fabric に切り替えます。
ノートブックを開くか作成します。 方法については、「Microsoft Fabric ノートブックの使用方法」をご覧ください。
言語オプションを [SparkR (R)] に設定することで、主要言語を変更します。
ノートブックをレイクハウスにアタッチします。 左側にある [追加] を選択して、既存のレイクハウスを追加するか、レイクハウスを作成します。
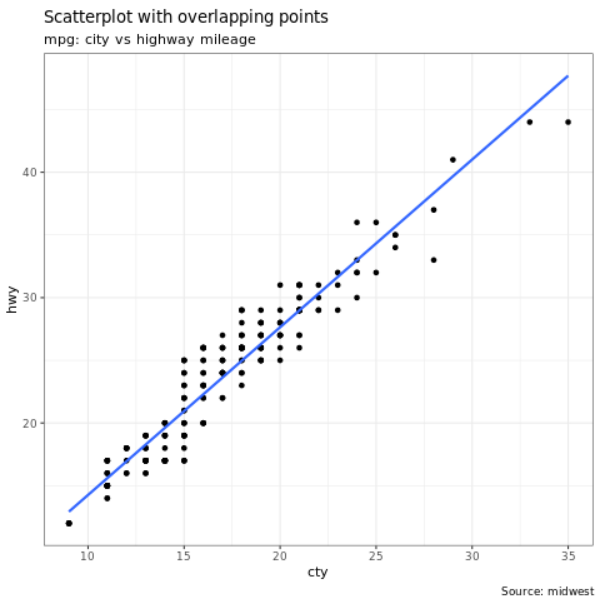
ggplot2
ggplot2 ライブラリは、データの視覚化と探索的なデータ分析で人気があります。
%%sparkr
library(ggplot2)
data(mpg, package="ggplot2")
theme_set(theme_bw())

g <- ggplot(mpg, aes(cty, hwy))

# Scatterplot
g + geom_point() +
  geom_smooth(method="lm", se=F) +
  labs(subtitle="mpg: city vs highway mileage",
       y="hwy",
       x="cty",
       title="Scatterplot with overlapping points",
       caption="Source: midwest")
rbokeh
rbokeh は、対話型グラフィックスを作成するためのネイティブ R プロット ライブラリです。
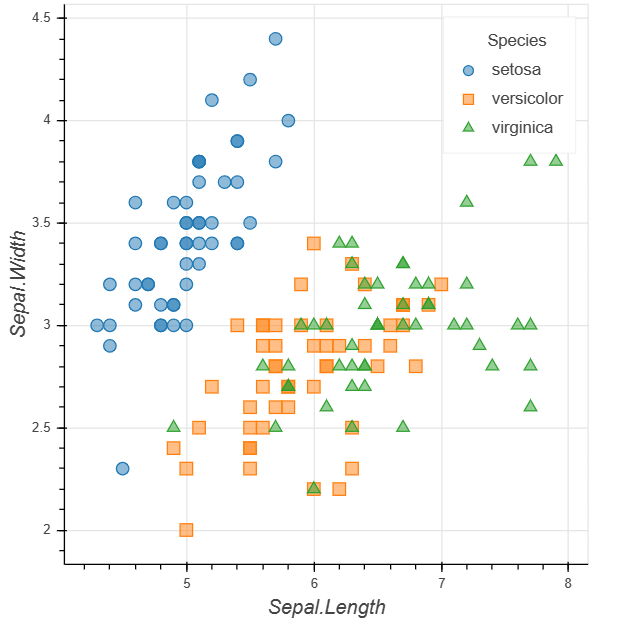
library(rbokeh)
p <- figure() %>%
  ly_points(Sepal.Length, Sepal.Width, data = iris,
    color = Species, glyph = Species,
    hover = list(Sepal.Length, Sepal.Width))
p
R Plotly
R グラフ作成ライブラリである Plotly は、対話型で公開品質のグラフを作成します。
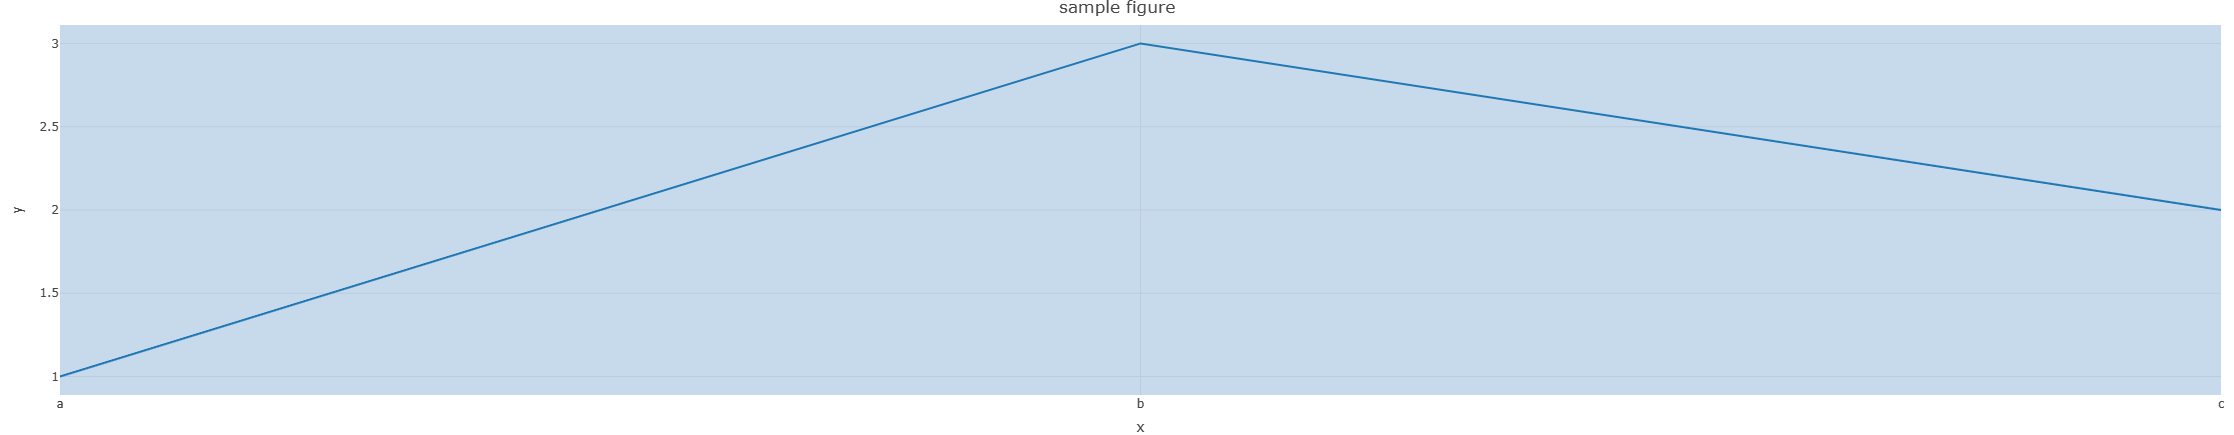
library(plotly)

fig <- plot_ly() %>%
  add_lines(x = c("a","b","c"), y = c(1,3,2))%>%
  layout(title="sample figure", xaxis = list(title = 'x'), yaxis = list(title = 'y'), plot_bgcolor = "#c7daec")

fig
Highcharter
Highcharter は、Highcharts JavaScript ライブラリとそのモジュール用の R ラッパーです。
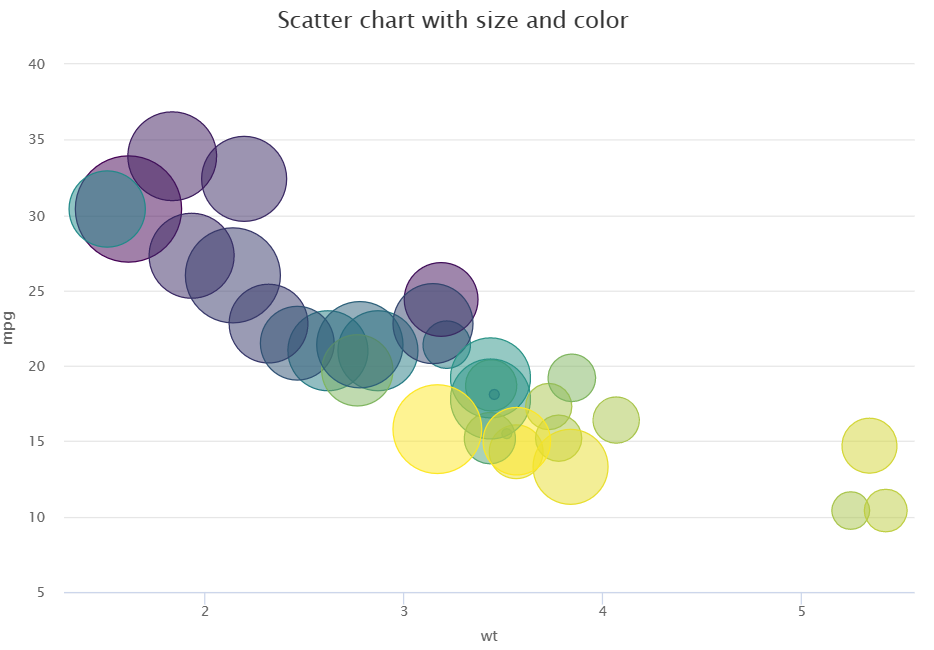
library(magrittr)
library(highcharter)
hchart(mtcars, "scatter", hcaes(wt, mpg, z = drat, color = hp)) %>%
  hc_title(text = "Scatter chart with size and color")