Bot analytics
APPLIES TO: SDK v3
Analytics is an extension of Application Insights. Application Insights provides service-level and instrumentation data like traffic, latency, and integrations. Analytics provides conversation-level reporting on user, message, and channel data.
View analytics for a bot
To access Analytics, open the bot in the Azure portal and click Analytics.
Too much data? You can enable and configure sampling for the Application Insights linked to your bot. This reduces telemetry traffic and storage while maintaining statistically correct analysis.
Specify channel
Choose which channels appear in the graphs below. Note that if a bot is not enabled on a channel, there will be no data from that channel.
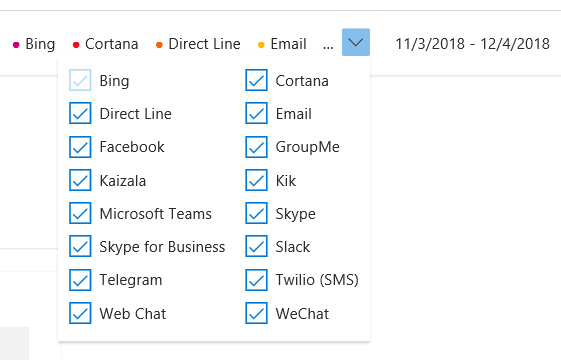
- Check the check box to include a channel in the chart.
- Clear the check box to remove a channel from the chart.
Specify time period
Analysis is available for the past 90 days only. Data collection began when Application Insights was enabled.

Click the drop-down menu and then click the amount of time the graphs should display. Note that changing the overall time frame will cause the time increment (X-axis) on the graphs to change accordingly.
Grand totals
The total number of active users and activities sent and received during the specified time frame.
Dashes -- indicate no activity.
Retention
Retention tracks how many users who sent one message came back later and sent another one. The chart is a rolling 10-day window; the results are not affected by changing the time frame.
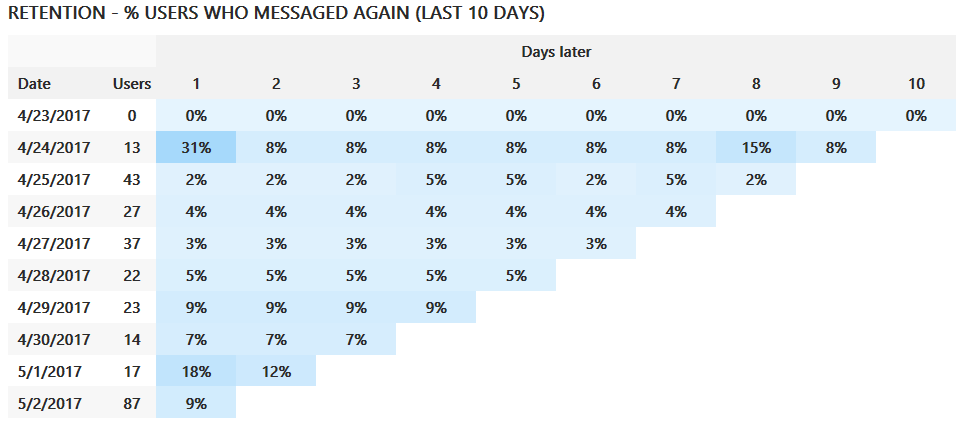
Note that the most recent possible date is two days ago; a user sent messages the day before yesterday and then returned yesterday.
User
The Users graph tracks how many users accessed the bot using each channel during the specified time frame.
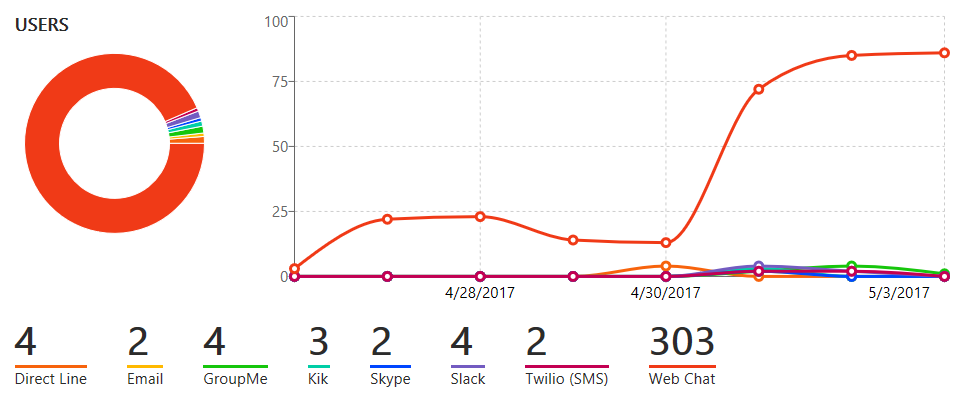
- The percentage chart shows what percentage of users used each channel.
- The line graph indicates how many users were accessing the bot at a certain time.
- The legend for the line graph indicates which color represents which channel and the includes the total number of users during the specified time period.
Activities
The Activities graph tracks how many activities were sent and received using which channel during the specified time frame.
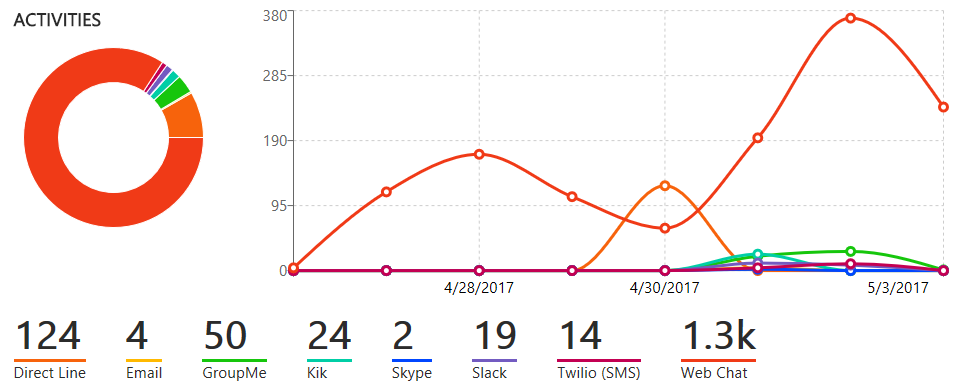
- The percentage chart shows what percentage of activities were communicated over each channel.
- The line graph indicates how many activities were sent and received over the specified time frame.
- The legend for the line graph indicates which line color represents each channel and the total number of activities sent and received on that channel during the specified time period.
Enable analytics
Analytics are not available until Application Insights has been enabled and configured. Application Insights will begin collecting data as soon as it is enabled. For example, if Application Insights was enabled a week ago for a six-month-old bot, it will have collected one week of data.
Note
Analytics requires both an Azure subscription and Application Insights resource. To access Application Insights, open the bot in the Azure Portal and click Settings.
You can add Application Insights when you create your bot resource.
You can also create an Application Insights resource later and connect it to your bot.
- Create an Application Insights resource.
- Open the bot in the dashboard. Click Settings and scroll down to the Analytics section.
- Enter the information to connect the bot to Application Insights. All fields are required.
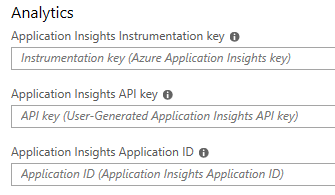
For more information on how to locate these values, see Application Insights keys.