Azure Kubernetes 네트워크 정책
네트워크 정책은 NSG(네트워크 보안 그룹)가 VM에 대한 마이크로 구분을 제공하는 것처럼 pod에 대한 마이크로 구분을 제공합니다. Azure 네트워크 정책 관리자 구현은 표준 Kubernetes 네트워크 정책 사양을 지원합니다. 레이블을 사용하여 Pod 그룹을 선택하고 이러한 Pod와의 트래픽을 필터링하는 수신 및 송신 규칙의 목록을 정의할 수 있습니다. Kubernetes 설명서에서 Kubernetes 네트워크 정책에 대해 자세히 알아보세요.
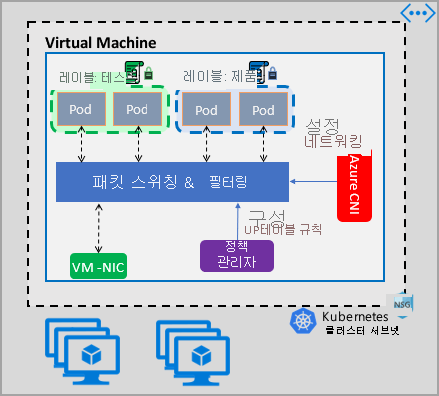
Azure 네트워크 정책 관리 구현은 컨테이너에 대한 가상 네트워크 통합을 제공하는 Azure CNI와 함께 작동합니다. 네트워크 정책 관리자는 Linux 및 Windows Server에서 지원됩니다. 이 구현에서는 Windows Server용 Linux IPTables 또는 HNS(Host Network Service) ACLPolicies에 정의된 정책을 기반으로 IP로 허용 및 거부 규칙을 구성하여 트래픽 필터링을 적용합니다.
Kubernetes 클러스터에 대한 보안 계획
클러스터에 대한 보안을 구현하는 경우 NSG(네트워크 보안 그룹)를 사용하여 클러스터 서브넷을 드나드는 트래픽을 필터링합니다(북-남 트래픽). 클러스터의 Pod 간 트래픽에 대해 Azure Network Policy Manager를 사용합니다(동-서 트래픽).
Azure Network Policy Manager 사용
Azure Network Policy Manager는 pod에 대한 마이크로 구분을 제공하기 위해 다음과 같은 방법에서 사용할 수 있습니다.
AKS(Azure Kubernetes Service)
Network Policy Manager는 기본적으로 AKS에서 사용할 수 있으며 클러스터를 만들 때 사용하도록 설정할 수 있습니다.
자세한 내용은 AKS(Azure Kubernetes Service)에서 네트워크 정책을 사용하여 pod 간 트래픽 보호를 참조하세요.
Azure의 DIY(Do It Yourself) Kubernetes 클러스터
DIY 클러스터의 경우 먼저 CNI 플러그 인을 설치하고 클러스터의 모든 가상 머신에서 사용하도록 설정합니다. 자세한 지침은 직접 배포하는 Kubernetes 클러스터를 위한 플러그 인 배포를 참조하세요.
클러스터가 배포되면 다음 kubectl 명령을 실행하여 Azure Network Policy Manager 디먼 집합을 클러스터에 다운로드하고 적용합니다.
Linux:
kubectl apply -f https://raw.githubusercontent.com/Azure/azure-container-networking/master/npm/azure-npm.yaml
Windows의 경우:
kubectl apply -f https://raw.githubusercontent.com/Azure/azure-container-networking/master/npm/examples/windows/azure-npm.yaml
솔루션도 오픈 소스이며 코드는 Azure Container Networking 리포지토리에서 제공됩니다.
Azure NPM을 사용하여 네트워크 구성 모니터링 및 시각화
Azure Network Policy Manager에는 구성을 모니터링하고 더 잘 이해할 수 있는 유익한 Prometheus 메트릭이 포함되어 있습니다. Azure Portal 또는 Grafana Labs에서 기본 제공 시각화를 제공합니다. Azure Monitor 또는 Prometheus 서버를 사용하여 이러한 메트릭 수집을 시작할 수 있습니다.
Azure Network Policy Manager 메트릭의 이점
이전에는 사용자가 클러스터 노드 내에서 실행되는 iptables 및 ipset 명령을 사용하여 네트워크 구성에 대해서만 알아볼 수 있었습니다. 이 명령은 상세하고 이해하기 어려운 출력을 생성합니다.
전반적으로 메트릭은 다음을 제공합니다.
정책, ACL 규칙, ipsets, ipset 항목 및 지정된 ipset의 항목 수
개별 OS 호출 및 kubernetes 리소스 이벤트 처리에 대한 실행 시간(중앙값, 90번째 백분위수 및 99번째 백분위수)
kubernetes 리소스 이벤트 처리에 대한 오류 정보(OS 호출이 실패하면 이러한 리소스 이벤트가 실패함)
메트릭 사용 사례 예제
Prometheus AlertManager를 통한 경고
다음과 같이 이러한 경고에 대한 구성을 참조하세요.
Network Policy Manager가 OS 호출에 실패하거나 네트워크 정책을 변환할 때 경고합니다.
만들기 이벤트에 대한 변경 내용을 적용하는 중간 시간이 100밀리초를 초과하면 경고합니다.
Grafana 대시보드 또는 Azure Monitor 통합 문서를 통한 시각화 및 디버깅
정책에서 만드는 IPTable 규칙의 수를 확인합니다(많은 양의 IPTable 규칙을 사용하면 대기 시간이 약간 증가할 수 있음).
클러스터 수(예: ACL)를 실행 시간과 연관시킵니다.
지정된 IPTables 규칙에서 사용자에게 친숙한 ipset 이름을 가져옵니다(예:
azure-npm-487392는podlabel-role:database를 나타냄).
지원되는 모든 메트릭
다음 목록은 지원되는 메트릭입니다. 모든 quantile 레이블에는 가능한 값 0.5, 0.9 및 0.99가 있습니다. 모든 had_error 레이블에는 작업이 성공했는지 또는 실패했는지를 나타내는 가능한 값 false 및 true가 있습니다.
| 메트릭 이름 | 설명 | Prometheus 메트릭 유형 | 레이블 |
|---|---|---|---|
npm_num_policies |
네트워크 정책 수 | 계기 | - |
npm_num_iptables_rules |
IPTables 규칙 수 | 계기 | - |
npm_num_ipsets |
IPSet 수 | 계기 | - |
npm_num_ipset_entries |
모든 IPSet 내의 IP 주소 항목 수 | 계기 | - |
npm_add_iptables_rule_exec_time |
IPTables 규칙을 추가하기 위한 런타임 | 요약 | quantile |
npm_add_ipset_exec_time |
IPSet를 추가하기 위한 런타임 | 요약 | quantile |
npm_ipset_counts(고급) |
각 개별 IPSet 내의 항목 수 | GaugeVec | set_name & set_hash |
npm_add_policy_exec_time |
네트워크 정책을 추가하기 위한 런타임 | 요약 | quantile & had_error |
npm_controller_policy_exec_time |
네트워크 정책 업데이트/삭제를 위한 런타임 | 요약 | quantile & had_error & operation(값 update 또는 delete 포함) |
npm_controller_namespace_exec_time |
네임스페이스 만들기/업데이트/삭제를 위한 런타임 | 요약 | quantile & had_error & operation(값 create, update 또는 delete 포함) |
npm_controller_pod_exec_time |
Pod 만들기/업데이트/삭제를 위한 런타임 | 요약 | quantile & had_error & operation(값 create, update 또는 delete 포함) |
각 "exec_time" 요약 메트릭에 대한 "exec_time_count" 및 "exec_time_sum" 메트릭도 있습니다.
메트릭은 컨테이너용 Azure Monitor 또는 Prometheus를 통해 스크랩할 수 있습니다.
Azure Monitor 설정
첫 번째 단계는 Kubernetes 클러스터에서 컨테이너용 Azure Monitor를 사용하도록 설정하는 것입니다. 단계는 컨테이너용 Azure Monitor 개요에서 확인할 수 있습니다. 컨테이너용 Azure Monitor를 사용하도록 설정했으면 Network Policy Manager 통합 및 Prometheus Network Policy Manager 메트릭 수집을 사용하도록 컨테이너용 Azure Monitor ConfigMap을 구성합니다.
컨테이너용 Azure Monitor ConfigMap에는 Network Policy Manager 메트릭을 수집하기 위한 설정이 포함된 integrations 섹션이 있습니다.
이러한 설정은 ConfigMap에서 기본적으로 사용되지 않습니다. 기본 설정 collect_basic_metrics = true를 사용하도록 설정하면 기본 Network Policy Manager 메트릭이 수집됩니다. 고급 설정 collect_advanced_metrics = true를 사용하도록 설정하면 기본 메트릭 외에도 고급 메트릭이 수집됩니다.
ConfigMap을 편집한 후에는 로컬에 저장하고 다음과 같이 ConfigMap을 클러스터에 적용합니다.
kubectl apply -f container-azm-ms-agentconfig.yaml
다음 코드 조각은 고급 메트릭 컬렉션과 함께 사용하도록 설정된 Network Policy Manager 통합을 보여 주는 컨테이너용 Azure Monitor ConfigMap에서 가져온 것입니다.
integrations: |-
    [integrations.azure_network_policy_manager]
        collect_basic_metrics = false
        collect_advanced_metrics = true
고급 메트릭은 선택 사항이며 이를 설정하면 기본 메트릭 수집이 자동으로 설정됩니다. 현재 고급 메트릭에는 Network Policy Manager_ipset_counts만 포함됩니다.
구성 맵의 컨테이너용 Azure Monitor 수집 설정에 대해 자세히 알아봅니다.
Azure Monitor의 시각화 옵션
Network Policy Manager 메트릭 수집을 사용하도록 설정하면 컨테이너 인사이트를 사용하여 Azure Portal트 또는 Grafana에서 메트릭을 볼 수 있습니다.
클러스터에 대한 인사이트 아래 Azure Portal에서 보기
Azure Portal을 엽니다. 클러스터의 인사이트에서 통합 문서로 이동하여 Network Policy Manager(네트워크 정책 관리자) 구성을 엽니다.
통합 문서를 보는 것 외에도 인사이트 섹션 아래의 "로그"에서 Prometheus 메트릭을 직접 쿼리할 수 있습니다. 예를 들어 이 쿼리는 수집되는 모든 메트릭을 반환합니다.
| where TimeGenerated > ago(5h)
| where Name contains "npm_"
로그 분석에서 직접 메트릭을 쿼리할 수도 있습니다. 자세한 내용은 Log Analytics 쿼리 시작을 참조하세요.
Grafana 대시보드에서 보기
여기에 설명된 대로 Grafana 서버를 설정하고 로그 분석 데이터 원본을 구성합니다. 그런 다음 Log Analytics 백 엔드가 포함된 Grafana 대시보드를 Grafana Labs로 가져옵니다.
대시보드에는 Azure 통합 문서와 유사한 시각적 개체가 있습니다. 차트에 패널을 추가하고 InsightsMetrics 테이블에서 Network Policy Manager 메트릭을 시각화할 수 있습니다.
Prometheus 서버 설정
일부 사용자는 컨테이너에 대한 Azure Monitor 대신 Prometheus 서버를 사용하여 메트릭을 수집하도록 선택할 수 있습니다. Network Policy Manager 메트릭을 수집하려면 scrape config에 두 개의 작업을 추가하기만 하면 됩니다.
Prometheus 서버를 설치하려면 클러스터에 이 helm 리포지토리를 추가합니다.
helm repo add stable https://kubernetes-charts.storage.googleapis.com
helm repo update
그런 다음 서버를 추가합니다.
helm install prometheus stable/prometheus -n monitoring \
--set pushgateway.enabled=false,alertmanager.enabled=false, \
--set-file extraScrapeConfigs=prometheus-server-scrape-config.yaml
여기서 prometheus-server-scrape-config.yaml은 다음으로 구성됩니다.
- job_name: "azure-npm-node-metrics"
  metrics_path: /node-metrics
  kubernetes_sd_configs:
  - role: node
  relabel_configs:
  - source_labels: [__address__]
    action: replace
    regex: ([^:]+)(?::\d+)?
    replacement: "$1:10091"
    target_label: __address__
- job_name: "azure-npm-cluster-metrics"
  metrics_path: /cluster-metrics
  kubernetes_sd_configs:
  - role: service
  relabel_configs:
  - source_labels: [__meta_kubernetes_namespace]
    regex: kube-system
    action: keep
  - source_labels: [__meta_kubernetes_service_name]
    regex: npm-metrics-cluster-service
    action: keep
# Comment from here to the end to collect advanced metrics: number of entries for each IPSet
  metric_relabel_configs:
  - source_labels: [__name__]
    regex: npm_ipset_counts
    action: drop
azure-npm-node-metrics 작업을 다음 내용으로 바꾸거나 Kubernetes Pod에 대한 기존 작업에 통합할 수도 있습니다.
- job_name: "azure-npm-node-metrics-from-pod-config"
  metrics_path: /node-metrics
  kubernetes_sd_configs:
  - role: pod
  relabel_configs:
  - source_labels: [__meta_kubernetes_namespace]
    regex: kube-system
    action: keep
  - source_labels: [__meta_kubernetes_pod_annotationpresent_azure_Network Policy Manager_scrapeable]
    action: keep
  - source_labels: [__address__]
    action: replace
    regex: ([^:]+)(?::\d+)?
    replacement: "$1:10091"
    target_label: __address__
AlertManager에 대한 경고 설정
Prometheus 서버를 사용하는 경우 다음과 같이 AlertManager를 설정할 수 있습니다. 다음은 이전에 설명한 두 경고 규칙에 대한 예제 구성입니다.
groups:
- name: npm.rules
  rules:
  # fire when Network Policy Manager has a new failure with an OS call or when translating a Network Policy (suppose there's a scraping interval of 5m)
  - alert: AzureNetwork Policy ManagerFailureCreatePolicy
    # this expression says to grab the current count minus the count 5 minutes ago, or grab the current count if there was no data 5 minutes ago
    expr: (npm_add_policy_exec_time_count{had_error='true'} - (npm_add_policy_exec_time_count{had_error='true'} offset 5m)) or npm_add_policy_exec_time_count{had_error='true'}
    labels:
      severity: warning
      addon: azure-npm
    annotations:
      summary: "Azure Network Policy Manager failed to handle a policy create event"
      description: "Current failure count since Network Policy Manager started: {{ $value }}"
  # fire when the median time to apply changes for a pod create event is more than 100 milliseconds.
  - alert: AzurenpmHighControllerPodCreateTimeMedian
    expr: topk(1, npm_controller_pod_exec_time{operation="create",quantile="0.5",had_error="false"}) > 100.0
    labels:
      severity: warning
      addon: azure-Network Policy Manager
    annotations:
      summary: "Azure Network Policy Manager controller pod create time median > 100.0 ms"
      # could have a simpler description like the one for the alert above,
      # but this description includes the number of pod creates that were handled in the past 10 minutes,
      # which is the retention period for observations when calculating quantiles for a Prometheus Summary metric
      description: "value: [{{ $value }}] and observation count: [{{ printf `(npm_controller_pod_exec_time_count{operation='create',pod='%s',had_error='false'} - (npm_controller_pod_exec_time_count{operation='create',pod='%s',had_error='false'} offset 10m)) or npm_controller_pod_exec_time_count{operation='create',pod='%s',had_error='false'}` $labels.pod $labels.pod $labels.pod | query | first | value }}] for pod: [{{ $labels.pod }}]"
Prometheus의 시각화 옵션
Prometheus 서버를 사용하는 경우 Grafana 대시보드만 지원됩니다.
아직 설치하지 않은 경우 Grafana 서버를 설치하고 Prometheus 데이터 원본을 구성합니다. 그런 다음, Prometheus 백 엔드가 포함된 Grafana 대시보드를 Grafana Labs로 가져옵니다.
이 대시보드의 시각적 개체는 컨테이너 인사이트/로그 분석 백 엔드가 포함된 대시보드와 동일합니다.
샘플 대시보드
다음은 CI(컨테이너 인사이트) 및 Grafana의 Network Policy Manager 메트릭에 대한 몇 가지 대시보드 예제입니다.
CI 요약 수
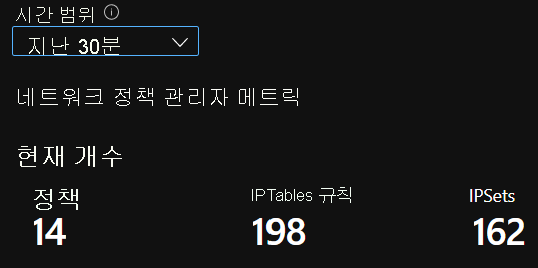
시간별 CI 수

CI IPSet 항목

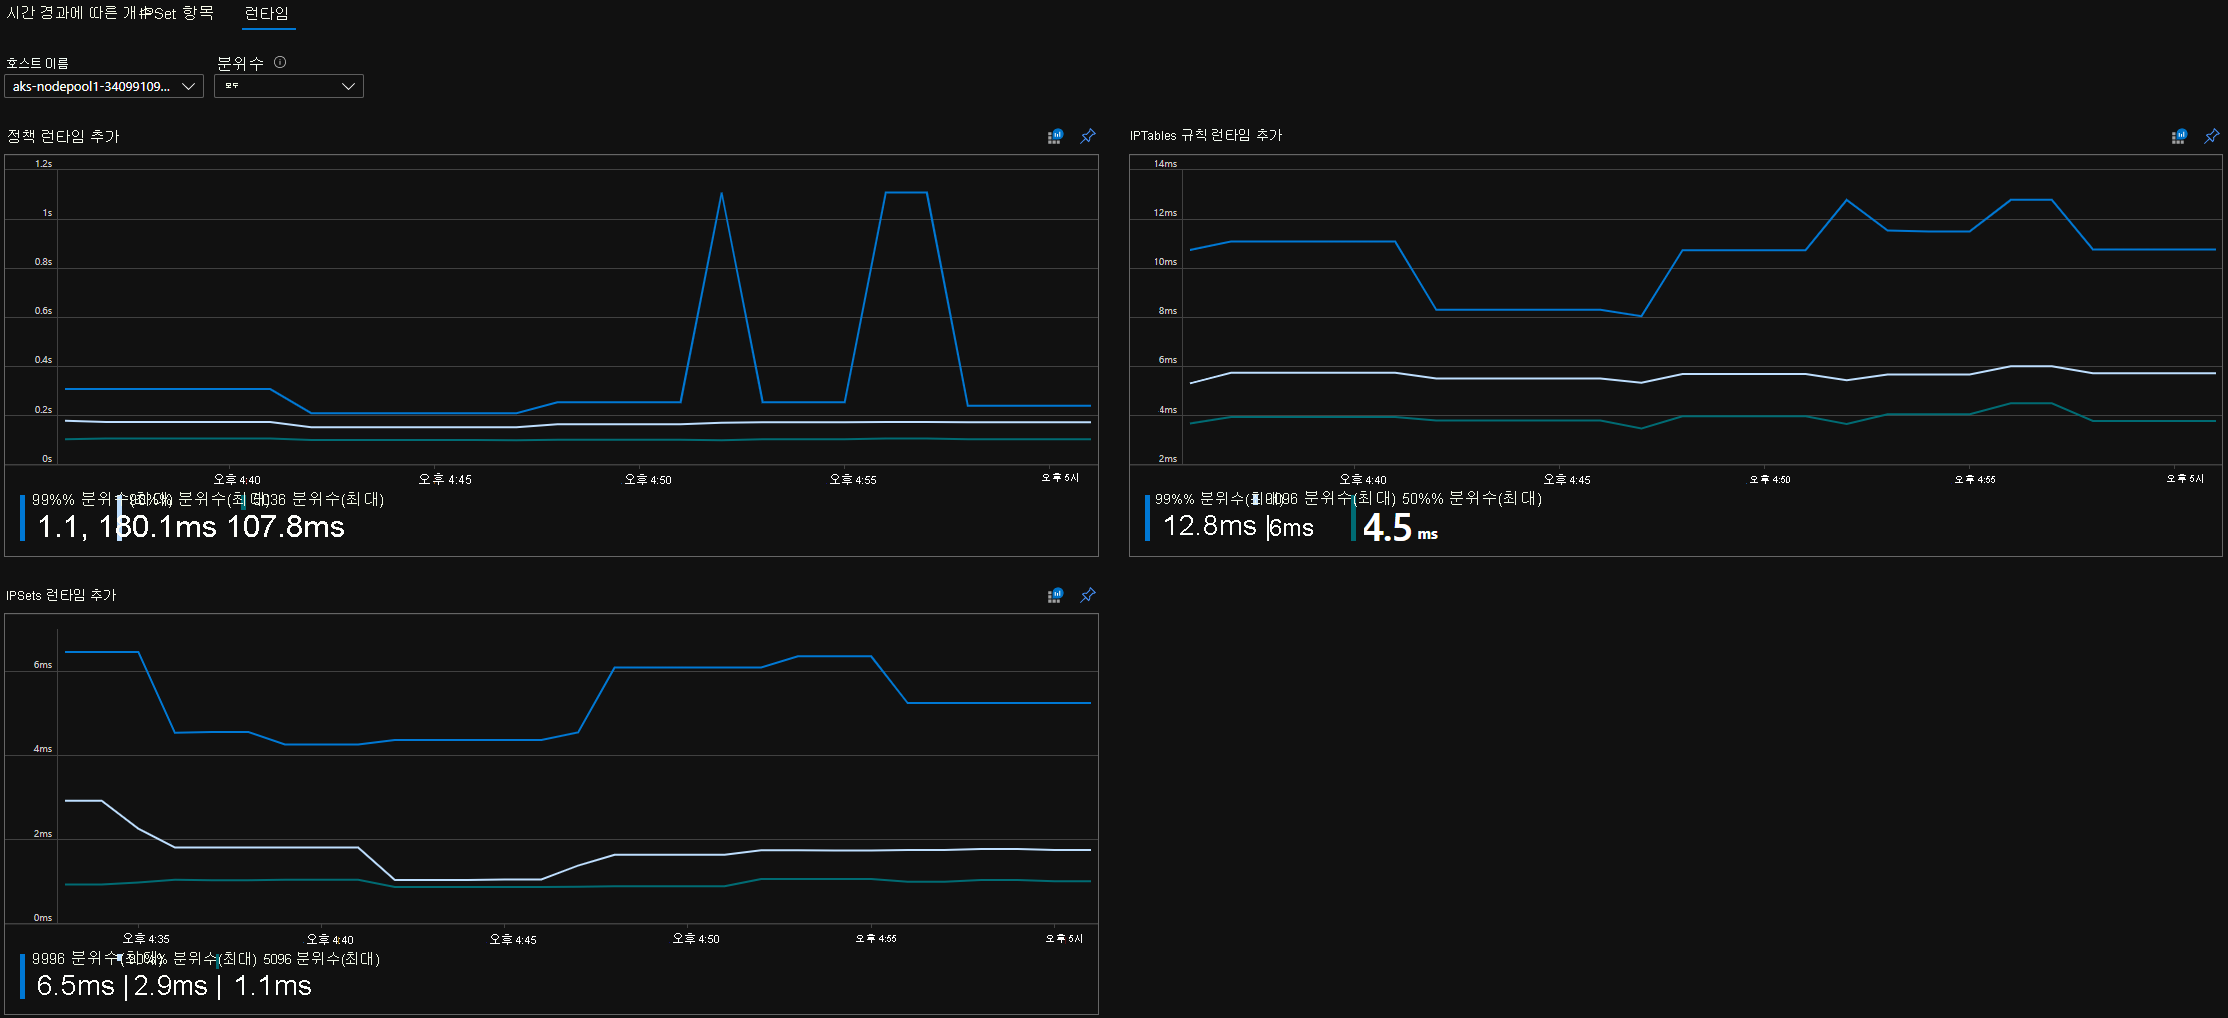
CI 런타임 분위수
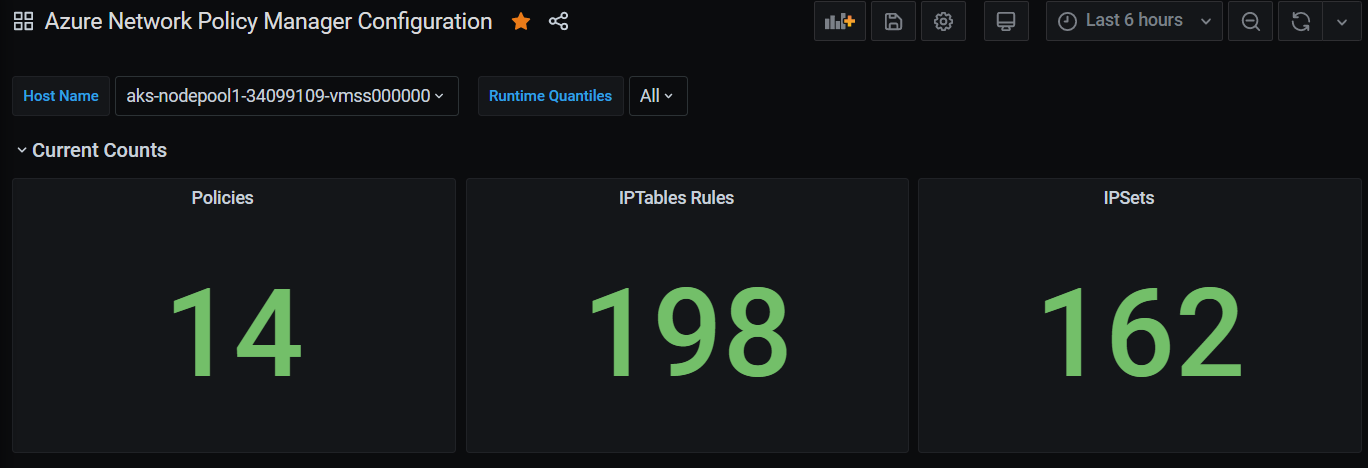
Grafana 대시보드 요약 수
시간별 Grafana 대시보드 수

Grafana 대시보드 IPSet 항목

Grafana 대시보드 런타임 분위수

다음 단계
Azure Kubernetes Service에 대해 알아봅니다.
컨테이너 네트워크에 대해 알아봅니다.
Kubernetes 클러스터 또는 Docker 컨테이너에 대한 플러그 인을 배포합니다.