Walk through major features of Microsoft Dynamics AX 2012 Trace Parser (Part 1)
Microsoft Dynamics AX 2012 Trace Parser is a performance analyzer that helps users discover and resolve performance problems in customized Microsoft Dynamics AX systems. Unlike its previous versions, Trace Parser is now a component within the Microsoft Dynamics AX 2012 release.
Trace Parser provides user interfaces to import, process and render ETW tracing events that produced by Microsoft Dynamics AX. User can then analyze tracing events to identify performance bottlenecks such as long-running X++ methods, slow SQL queries and frequently called RPCs. Features in Trace Parser help users determine the root causes of performance problems.
This blog series will walk through the major features of Trace Parser.
Install and set up Trace Parser
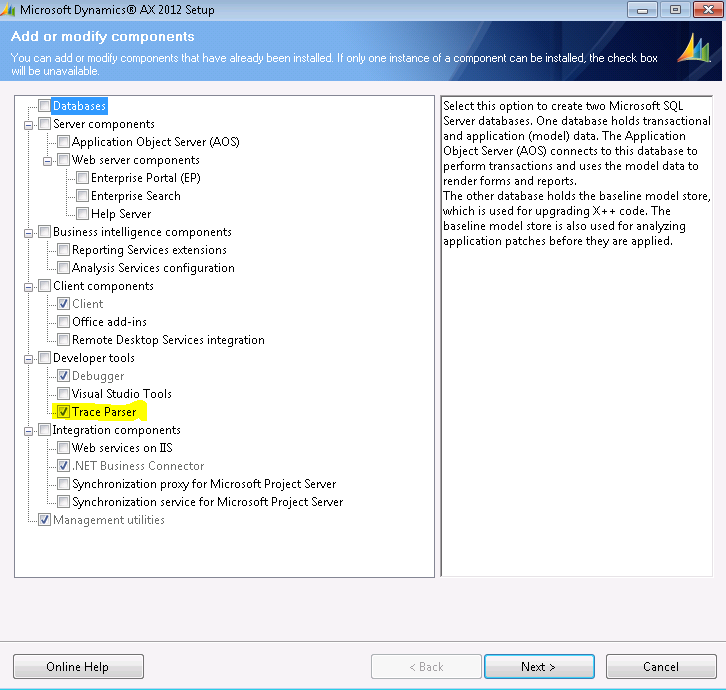
Trace Parser can be installed using the Microsoft Dynamics AX 2012 setup program. Note that Trace Parser requires .Net Business Connector. In order to run Trace Parser, you also
need access to a SQL Server 2008 instance (Enterprise or Developer edition) with admin permission. Using a local SQL server instance is recommended. You don’t need to
use the same SQL instance where the AX DB is installed.
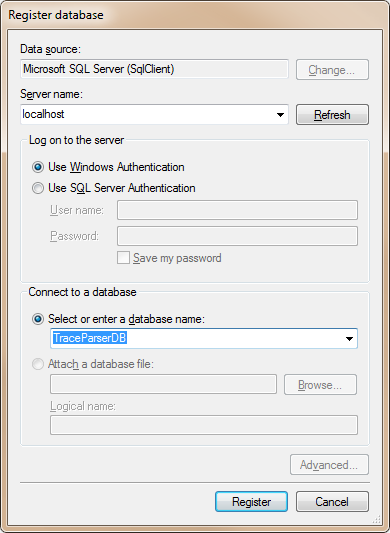
The first time you start Trace Parser, you will be prompted to set up Trace Parser database. You need to let Trace Parser create a new database for you. Do not select an existing database. Fill in server name and type a database name that doesn’t exist, and then click the “Register” button:
A message box “The specified database does not exist. Would you like to create it?” is displayed. Click“Yes” to create and register a new database.
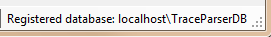
The “Select Trace” window pops up. You can click the Cancel button to dismiss the window for now. Note the status bar at bottom displays the registered database name now:
Collect and import trace
Collect Trace
Start Microsoft Dynamics AX 2012 client and switch to Development Workspace. Open the Tracing cockpit (in the Tools menu) form:
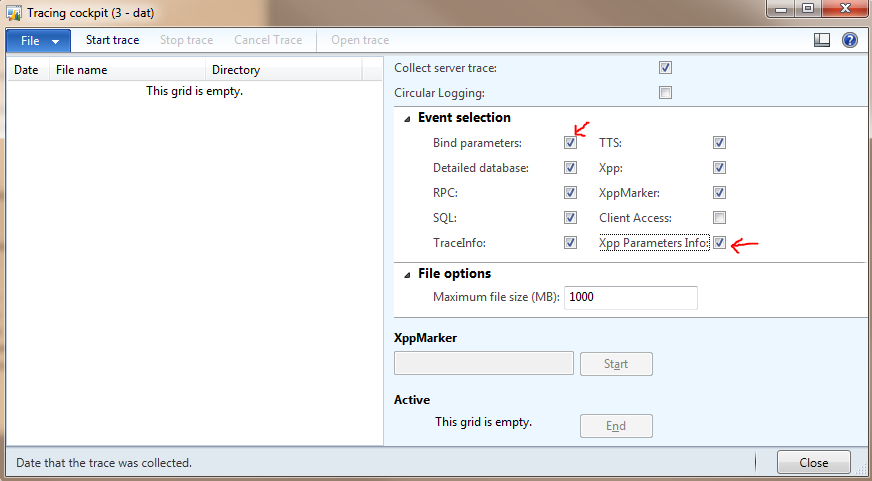
By default, the “Bind Parameters” and “Xpp Parameters Info” events are unchecked. This is to avoid capturing confidential information which could be exposed through the parameters of X++ methods and SQL queries. Always ask your customer or IT Admin whether it's OK to collect these information. If you have cleared the legal and privacy concerns, we recommend you check the options to collect more useful information.
To collect trace:
- Click “Start trace”, specify a trace file name. Event tracing is now enabled in AX.
- “Replay” the scenario that you are investigating in AX client. Once done, click the “Stop trace” button in Tracing Cockpit. A
trace file is now created. - You may now click the “Open trace” button to launch a new Trace Parser instance and imports the trace automatically. For the
purpose of this walk-through, click the “Close” button to finish this step.
Tips and tricks:
- We recommend choosing “small” scenarios to produce small but relevant trace files.
- We recommend “warming up” your system before collecting the trace. This will generate less noise such as metadata reads.
- If possible, collect traces on a machine that runs AOS because traces collected on such machine contain tracing events from both server and client sessions. A helpful feature in Trace Parser, “Drill into sessions” (explained later), works only if a trace contains both server and client sessions.
Import trace
In Trace Parser, click the menu item “File -> Import trace” and then specify the trace file that was created in the previous step. Trace Parser now starts importing the trace, and it may take up to minutes to finish, depending on the file size.
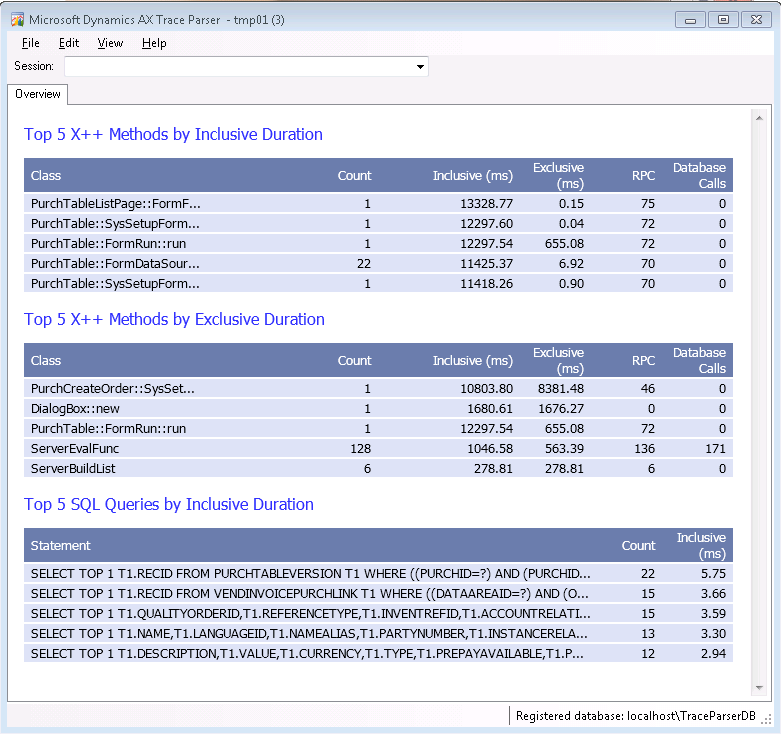
After importing is finished, Trace Parser displays the overview of the imported trace. The overview gives users quick ideas about the “hot spots” in the trace by showing the top-most expensive X++ method calls and SQL statements across all sessions.
Comments
Anonymous
May 06, 2013
I strictly follow the steps but When I click on start Trace I have provided the file name and Click Ok , it will throw error: Error Starting Server Trace...I will go to SysTraceCockpit class method Start Tracing.... Unable to resolve the issue :(Anonymous
May 07, 2013
@Sundeep : make sure that you are an AX Admin, ensure that the AOS service account has local admin permissions, and make sure that the log directory for the server has write permissions for the AOS account.Anonymous
May 09, 2013
@Sundeep, also make sure you have enough space in the hard drive of the AOS machine.Anonymous
May 16, 2013
@SunDeep : I had the same issue. To solve the problem, i right clicked on the Dynamics AX Shortcut and selected "Run as administrator".Anonymous
November 01, 2013
The best way to run the AOS trace is through performance monitor here: blogs.msdn.com/.../collect-ax-2012-event-traces-with-windows-performance-monitor.aspxAnonymous
November 21, 2013
Hi All, I follow this steps i can able to start & stop the trace without fail. and trace file also created but while i am trying to open the saved trace file with "Open Trace" button, i got the following error message "Microsoft Dynamics AX Trace Parser was not found. Please ensure that the application is installed by rerunning setup."Anonymous
August 14, 2014
Hello,is there a way to show more than the top 5 in each category?Thank you.Anonymous
October 24, 2014
I am new this AX.Thank you for your information...So, i searched this topic only for my performance fine tuning.please share some tips which i have to add my development.Anonymous
November 27, 2014
"Julien Hernandez: I had the same issue. To solve the problem, i right clicked on the Dynamics AX Shortcut and selected "Run as administrator"."In my system all the accounts (me, AOS) were local admins. So I started AX as Administrator and that helped to resolve the error "Error Starting Server Trace" in my case too.Waldemar ProssAnonymous
December 07, 2014
new user here, stuck on step 1. how do you get to the Dynamics AX setup?Anonymous
May 20, 2015
Is there a document on how to analyze the Trance file in?Anonymous
May 20, 2015
Is there way or documentation or procedure to read trace file?Anonymous
August 12, 2015
Hi Rahul, Hope you found your answer. If not please refer this link - blogs.msdn.com/.../walk-through-the-major-features-in-microsoft-dynamics-ax-2012-trace-parser-part-2.aspxAnonymous
December 01, 2015
Why can't you use an existing database when first using/registering a database for trace parser? Or is there a way to connect to an existing database after initially setting up a new database for traces?