Simple Trick to Stay on top of your Azure Data Lake: Create Alerts using Log Analytics
If you manage one or more Azure Data Lake accounts, do you ever find it hard to stay on top of everything that is happening? Ever feel the need to know more about them? Are you regularly asking yourself any or all of these questions:
- What are our most expensive jobs ?
- When was a new data folder created in [path]?
- When did a file get deleted from our [data/compliance/telemetry/other] folder?
Creating Azure Log Analytics alerts for your Azure Data Lake accounts can help you know when specific events happen, or when a metric reaches a defined threshold. In this post I'll show you how to reduce the level of unknowns when working with Azure Data Lake using Azure Log Analytics alerts - it's easy to get started:
Connect your Azure Data Lake account to Log Analytics
Follow the steps in our previous blog post on Log Analytics to connect your accounts and start collecting usage and diagnostics logs.
Create the Log Analytics Alert
Open Log Analytics, and navigate to the Alerts section towards the bottom of the table of contents.
[caption id="attachment_9705" align="alignnone" width="216"] Figure 1: Log Analytics - Alerts[/caption]
In the Log Analytics Alert blade, click on New Alert Rule to create a new alert.
[caption id="attachment_9715" align="alignnone" width="838"]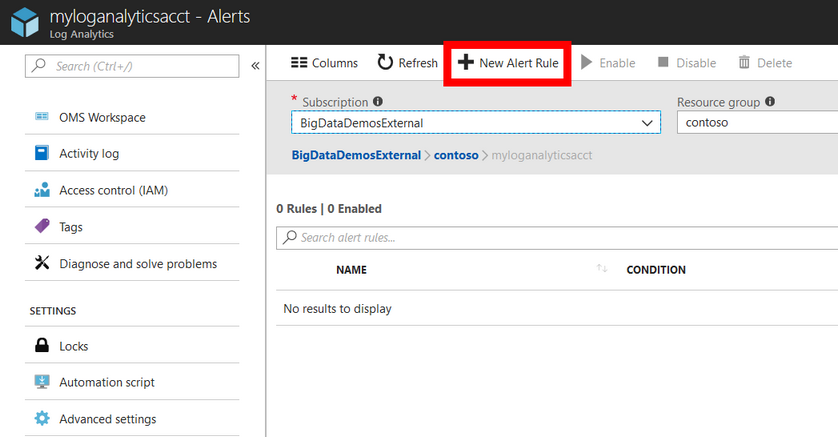 Figure 2: Log Analytics - New alert[/caption]
The first part of the rule, the target, should already be selected – using the current Log Analytics account. For the second part – the criteria, click the button to add the conditions for the alert.
[caption id="attachment_9735" align="alignnone" width="800"]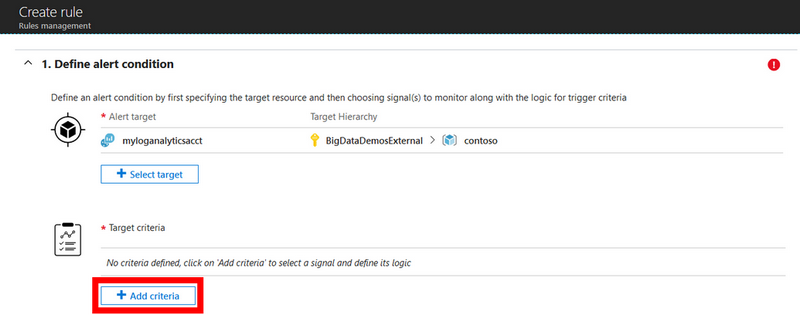 Figure 3: Log Analytics alert criteria settings[/caption]
To configure the alert signal, select Custom Log Search.
[caption id="attachment_9745" align="alignnone" width="437"]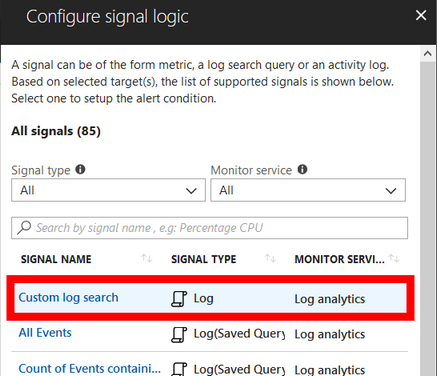 Figure 4: Custom query for an alert[/caption]
In the Search query field, paste the specific query that will trigger the alert. For this example, we will track when a new folder is created in a Data Lake Store account:
[caption id="attachment_9935" align="alignnone" width="414"]
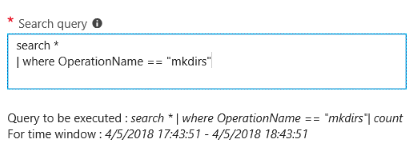 Figure 5: Log search query[/caption]
The alert logic can be based on a number of results such as the total number of events tracked (create a folder in Data Lake Store, submit a job in Data Lake Analytics, etc), or a specific metric value such as a sum of the events or aggregation of values from the query (total data read, total number of AUs assigned, total duration of the jobs ran in a window of time, etc).
[caption id="attachment_9925" align="alignnone" width="509"]
 Figure 6: The two main types of alerts - based on number of results or a single metric value[/caption]
- The period and frequency indicate the rolling window of time that needs to be evaluated, and how frequently to check it, respectively.
In the Define alert detail section, we can enter some descriptive details, including the severity for the alert.
[caption id="attachment_9945" align="alignnone" width="698"]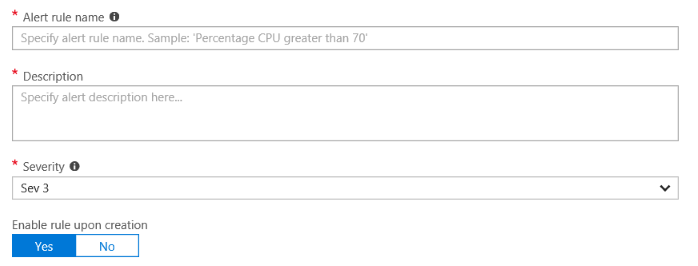 Figure 7: Default alert details[/caption]
Next, let's create a new action group where we can add people or groups to notify and the specific action to take, such as email, SMS, etc.
[caption id="attachment_9795" align="alignnone" width="356"] Figure 8: Action group details[/caption]
It is possible to create complex combinations of emails, SMS, or other notifications for specific users and groups. In this example, the team will be emailed:
[caption id="attachment_9805" align="alignnone" width="800"]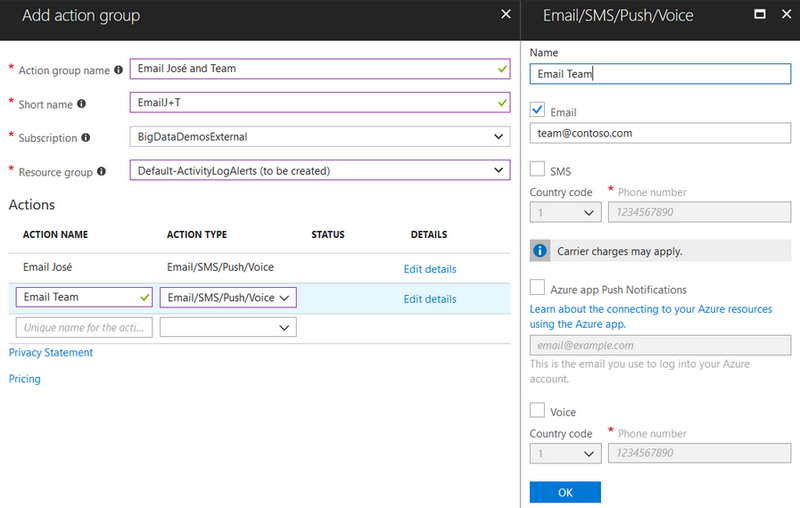 Figure 9: Action group settings[/caption]
Once the action group is created it will be added to the definition, save the alerts settings, and you're done.
The rule will be displayed in the list of alerts:
[caption id="attachment_9775" align="alignnone" width="800"] Figure 10: Updated alert criteria[/caption]
Conclusion
In this blog post, I've shown you how to configure alerts for your Azure Data Lake accounts. These alerts can notify you of specific events or metric values that are relevant to you and your organization and will help you to proactively act on events, optimize costs, and understand usage trends. Try these simple steps to enable alerts, and let us know how they are helping you stay on top of your Azure Data Lake usage or costs - leave us a comment and share your experiences for others to build on. Have a specific need or scenario? Send your feature requests to our Azure Data Lake UserVoice forum.
Based on your comments and suggestions, we will cover useful and interesting events and metrics that you can plug-in into alerts. Stay tuned!