100% CPU on Exchange 2013/2016 - Check the number of CPUs is not too high
100% CPU issues seen recently due to high number of CPU. Max recommended CPU is 24
CPU is usually consumed by mapihttp module.
You will find below Resolution and Further details on the symptom and troubleshooting.
Resolution :
---------------
When there is too much CPU , more CPU time is spend due to minimum number of threads per CPU and synchronization named Contention
Exchange/ .net is not designed/optimized for so much CPUs and this is not following Exchange architecture recommendations.
There is a great article on Exchange dev team on this subject:
https://blogs.technet.microsoft.com/exchange/2015/06/19/ask-the-perf-guy-how-big-is-too-big/
Such problem and far more can be avoided by following design recommended named Preferred Architecture , or requirement calculators which integrate this maximum CPU number and provide further details to get best performance.
In most case the issue can be mitigated by disabling hyperthreading which is not recommended on Exchange and double artificially the number of CPU triggering this problem.
When it is physical CPU without hyperthreading , there are sometimes hardware options to disable part of the CPUs in order to avoid exceeding max number of CPU recommendation.
There is also a .net optimization for these contention generated by high number of CPU :
.net fix KB3146718 (Web Installer) or KB3146717 both contains this optimization.
Choose one package or the other depending if you need a web installer version or not
For applying these hotfixes , it is also recommended to apply CU13 or upper : https://technet.microsoft.com/en-us/library/ff728623.aspx
Such issues are fixed by applying this .net fix and disabling hyperthreading which reduce as well the number of CPU.
Further details on symptom and troubleshooting:
--------------------------------------------------------------------
Generic troubleshooting steps for 100% CPU is to check which process consume the CPU.
This can be seen from task manager during the problem or using daily perfmon logs stored under \Microsoft\Exchange Server \V15\Logging\Diagnostics\DailyPerformanceLogs
In most case I have seen, the process consuming most CPU in case of too much CPU is the w3wp.exe running MSExchangeMapiMailboxAppPool linked with mapihttp module.
c:\windows\system32\inetsrv\w3wp.exe -ap "MSExchangeMapiMailboxAppPool" -v "v4.0" -c "C:\Program Files\Microsoft\Exchange Server\V15\bin\MSExchangeMapiMailboxAppPool_CLRConfig.config" -a \\.\pipe\iisipm93b74187-ee0a-4645-9295-38cfcbed72a4 -h "C:\inetpub\temp\apppools\MSExchangeMapiMailboxAppPool\MSExchangeMapiMailboxAppPool.config" -w "" -m 0
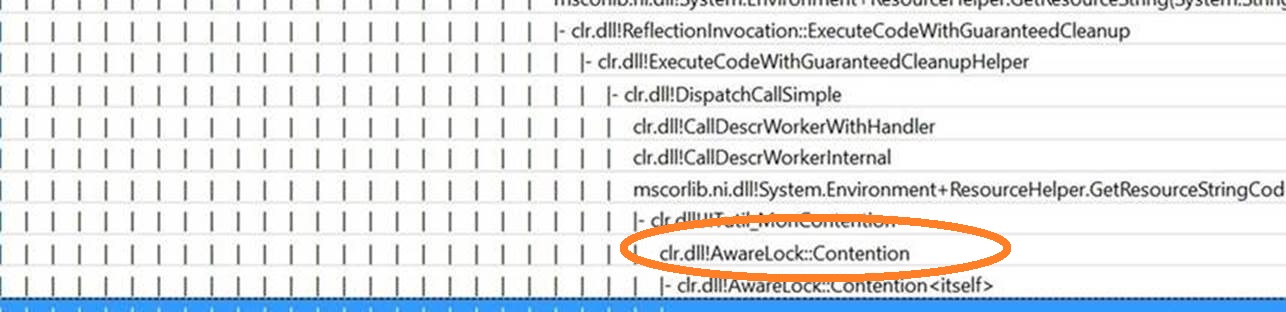
Tools to trace further causes of 100% CPU are usually Perfview or xperf trace as they help to narrow down the functions consuming most CPU.
In these trace , you will see clr.dll!AwareLock::Contention the stack for main CPU consumption
Another way to trace high CPU is using dumps .
In these dumps , you will see lots of threads waiting on clr!AwareLock::Contention
00007ffee4b70c6a ntdll!ZwWaitForMultipleObjects+0xa
00007ffee1f913ed KERNELBASE!WaitForMultipleObjectsEx+0xe1
00007ffed8e38976 clr!WaitForMultipleObjectsEx_SO_TOLERANT+0x62
(Inline) clr!Thread::DoAppropriateAptStateWait+0x45
00007ffed8e3877a clr!Thread::DoAppropriateWaitWorker+0x1d0
00007ffed8e38591 clr!Thread::DoAppropriateWait+0x7d
00007ffed8e3883d clr!CLREventBase::WaitEx+0xc0
00007ffed8e53ed6 clr!AwareLock::EnterEpilogHelper+0xc6
00007ffed8e53dea clr!AwareLock::EnterEpilog+0x62
00007ffed8e54521 clr!AwareLock::Contention+0x1e3
00007ffed8e54293 clr!JITutil_MonContention+0xaf
00007ffed769bc35 mscorlib_ni!System.Threading.TimerQueueTimer.Fire()+0xc5