Troubleshooting Errors in the TMG Management Console
Troubleshooting errors found in the user interface of the TMG Management console can be confusing and tricky. These issues are seen most often in a scenario where there are multiple TMG Servers in an array. The array may be a Standalone Array where one of the TMG Servers is the Manager (it holds the policy configuration) and the other TMG Servers are considered “Managed”. Another common scenario is an environment where a TMG EMS exists and one or more servers in the array get their configuration from it. In this article I am going to talk about some of the most common errors and show you the typical causes of them and how you can troubleshoot and hopefully resolve them.
My Lab Environment:
In my environment I have one TMG Enterprise Management Server (EMS) and one TMG Server in an array. The EMS hostname is ems.fabrikam.com and the TMG Server is hostname tmg1.fabrikam.com. To simulate the issues that I see most often I put them on different subnets separated by a firewall.
Error 1: “Unable to Retrieve data from: “
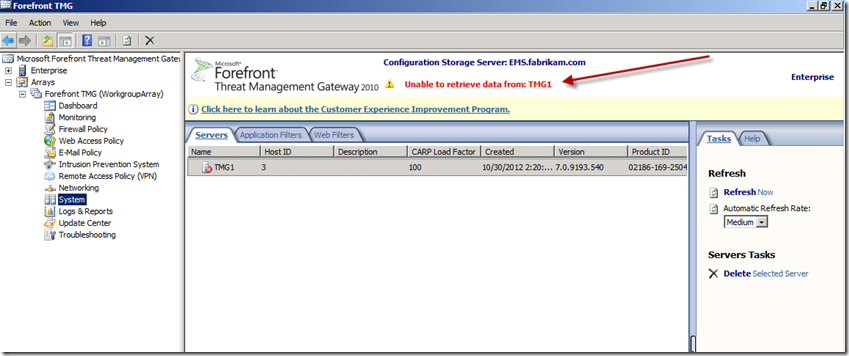
The first error I wanted to discuss is found in the TMG management console near the top and it will say something like “Unable to retrieve data from: <servername>” . If you open the console, expand the Array branch, and then click on the System node you will also see 3 tabs in the middle of the console. You then click on Servers and you should see the TMG servers that are in the array. A red X will appear beside the server when it is in this error state.
In my lab I opened the TMG Management Console on the EMS and it looks like Figure 1 below.
Fig. 1
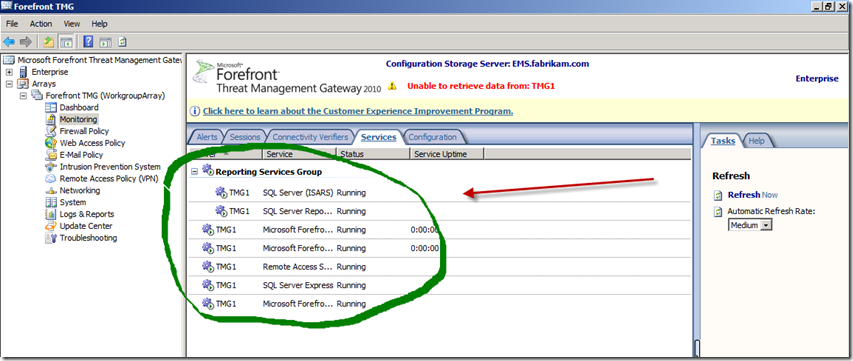
Note: Although we see an obvious error, the Services appear to be running which means the EMS is able to monitor them (Figure 2).
Fig. 2
For this particular area of the management console, TMG is relying on RPC communication between the EMS (or the TMG Manager in a Standalone Array) and the managed TMG Servers in the Array. If RPC traffic is blocked or being modified by an intermediary device then this will often be the result. This device could be another firewall, a router, a switch, a WAN accelerator, and IPS device, etc.
To troubleshoot this issue you want to rely on a network capture and analysis tool such as Netmon 3.4 which can be downloaded from the Microsoft download site. This is a great tool for troubleshooting and TMG administrators should ideally have it installed on their servers. I have it installed on both of the servers in my lab environment. To see what was going on I first closed the TMG management console on the EMS, then I started the capture utility on both servers, then I reopened the TMG management console on the EMS and drilled down to the System area. I then stopped the capture and filtered for RPC traffic which is TCP port 135. (Note: In Netmon the syntax for the filter would be tcp.port==135)
A sample of what I saw is below. If you will notice that the process name is MMC.EXE and the source is 10.10.10.35 which is the IP address of the EMS. The destination is 10.2.2.36 which is the TMG1 array server. There are tons of SYN packets coming from the EMS but they are never acknowledged. Eventually they are re-transmitted. This means that RPC is not able to set up the conversation and the results the error we saw above shows up in the TMG management console.
3 2:37:40 PM 5/10/2013 1.5939296 mmc.exe 10.10.10.35 10.2.2.36 TCP TCP:Flags=......S., SrcPort=54045, DstPort=DCE endpoint resolution(135)
8 2:37:42 PM 5/10/2013 3.7703686 mmc.exe 10.10.10.35 10.2.2.36 TCP TCP:Flags=......S., SrcPort=54049, DstPort=DCE endpoint resolution(135)
9 2:37:45 PM 5/10/2013 6.7655293 mmc.exe 10.10.10.35 10.2.2.36 TCP TCP:[SynReTransmit #8]Flags=......S., SrcPort=54049, DstPort=DCE endpoint resolution(135)
10 2:37:46 PM 5/10/2013 7.5945205 mmc.exe 10.10.10.35 10.2.2.36 TCP TCP:[SynReTransmit #3]Flags=......S., SrcPort=54045, DstPort=DCE endpoint resolution(135)
20 2:37:51 PM 5/10/2013 12.7801922 mmc.exe 10.10.10.35 10.2.2.36 TCP TCP:[SynReTransmit #8]Flags=......S., SrcPort=54049, DstPort=DCE endpoint resolution(135)
I had an interesting case recently for this type of error that was slightly different. In this case the RPC traffic was being seen on both sides and at first glance looked normal.
238 1:18:25 PM 4/30/2013 3.7905287 mmc.exe 10.10.10.35 10.2.2.36 TCP TCP:Flags=......S., SrcPort=55603, DstPort=DCE endpoint resolution(135)
256 1:18:25 PM 4/30/2013 3.9087116 mmc.exe 10.2.2.36 10.10.10.35 TCP TCP:Flags=...A..S., SrcPort=DCE endpoint resolution(135), DstPort=55603
258 1:18:25 PM 4/30/2013 3.9088279 mmc.exe 10.10.10.35 10.2.2.36 TCP TCP:Flags=...A...., SrcPort=55603, DstPort=DCE endpoint resolution(135)
262 1:18:25 PM 4/30/2013 3.9324689 mmc.exe 10.10.10.35 10.2.2.36 MSRPC MSRPC:c/o Bind: EPT(EPMP) UUID{E1AF8308-5D1F-11C9-91A4-08002B14A0FA} Call=0x2 Assoc Grp=0x0 Xmit=0x16D0 Recv=0x16D0 {MSRPC:41, TCP:40, IPv4:29}
263 1:18:25 PM 4/30/2013 3.9333150 mmc.exe 10.2.2.36 10.10.10.35 TCP TCP:Flags=...A...., SrcPort=DCE endpoint resolution(135), DstPort=55603
275 1:18:25 PM 4/30/2013 4.0156367 mmc.exe 10.2.2.36 10.10.10.35 TCP TCP:Flags=...A...F, SrcPort=DCE endpoint resolution(135), DstPort=55603
276 1:18:25 PM 4/30/2013 4.0156856 mmc.exe 10.10.10.35 10.2.2.36 TCP TCP:Flags=...A...., SrcPort=55603, DstPort=DCE endpoint resolution(135)
278 1:18:25 PM 4/30/2013 4.0235419 mmc.exe 10.10.10.35 10.2.2.36 TCP TCP:Flags=...A...F, SrcPort=55603, DstPort=DCE endpoint resolution(135)
279 1:18:25 PM 4/30/2013 4.0258142 mmc.exe 10.2.2.36 10.10.10.35 TCP TCP:Flags=...A...., SrcPort=DCE endpoint resolution(135), DstPort=55603
Upon further investigation, what I found in the network traces was that the packet leaving the EMS was not the same packet that arrived at the TMG1 firewall server.
RPC communication uses what is called an endpoint mapper to dynamically assign endpoints for the client request. The EMS was providing one but something in between was stripping it out.
UUID in the packet when it leaves the EMS
IfUuid: {E1AF8612-5D1F-11C9-91A4-08002B14A0FA}
UUID modified (stripped out) when it arrives at TMG 1
IfUuid: {00000000-0000-0000-0000-000000000000}
What we found was that a 3rd party “WAN accelerator” was the culprit and that was why RPC communication was not working properly.
A good troubleshooting technique to gauge the overall health of RPC traffic is to open an MMC on the computer where you are seeing the “Unable to Retrieve Data from: <servername>” message and add the Computer Management snap-in. When asked to “Select the computer you want snap-in to manage” message, choose the “Another computer” option and put in the name of the remote computer (in my case it is TMG1) and see if that works. If it fails then RPC communication in general is not happening between the two machines.
Error 2: A Red X appears beside the services for a remote TMG Server
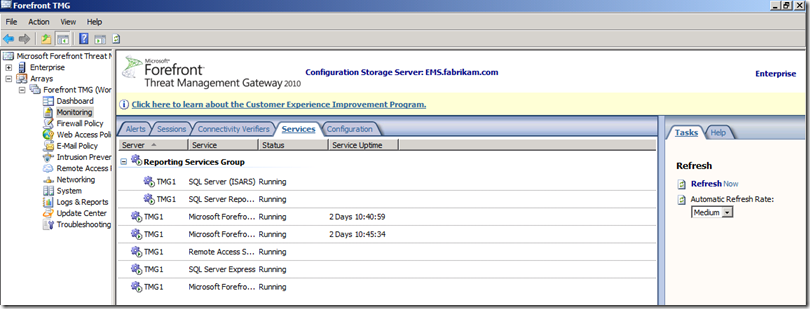
Another common error we see that causes concern for TMG administrators is in the Monitoring section of the TMG MMC. Across the middle there is a tab that allows you to check the status of the Services of all the TMG Firewall Servers in your array. It would normally appear as below. (Figure 3).
Fig. 3
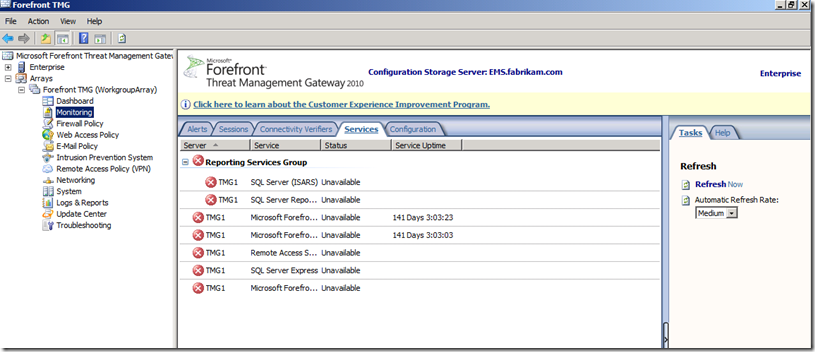
In an error state it looks like Figure 4.
Fig. 4
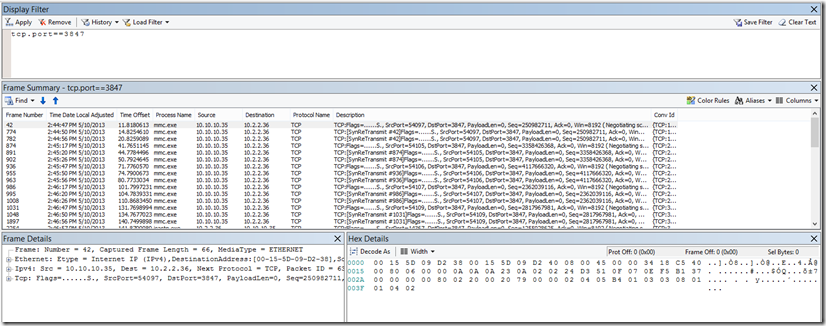
For this part of the TMG Management console, it relies on the MS Firewall Control Protocol which uses TCP port 3847.
To troubleshoot the issue use the same technique as you did for the previous error. Install a network capture utility such as Netmon on both server. To see what was going on close the TMG Management Console on the server where Red Xs are seen in UI, then start the capture utility on both servers, reopen the TMG Management Console navigate to the Monitoring, Services area. Stop the capture and filtered for traffic on TCP port 3847.
What you will most likely see is a of SYN packets (and SynReTransmits) leaving the box where the MMC is opened and never getting replied to. A network capture from the remote server and filtered for tcp.port==3847 would not show anything (Figure 5). The packets are never making it there and that is why we see the Red X next to the services.
Fig. 5
The likely culprit is any device in between especially another firewall. You will need to allow communications on that port if you want to be able to accurately monitor the services.
Error 3: Server cannot establish connection with the configuration storage server
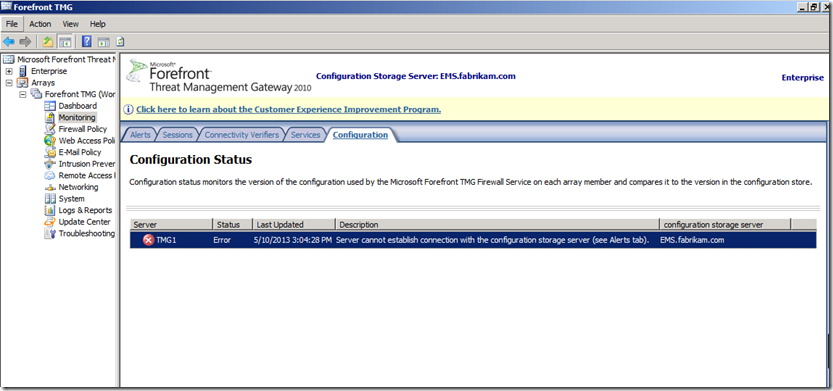
This error occurs when the firewall servers are not able to pull their configuration from where it is stored. In a Standalone Array the configuration is stored on the server that is designated as the Manager. In an environment where an EMS exists, the configuration resides on the EMS and the firewall servers in the array all get their configuration from there. You would see this error in the MMC under Monitoring and then the Configuration tab (Figure 6).
Fig. 6
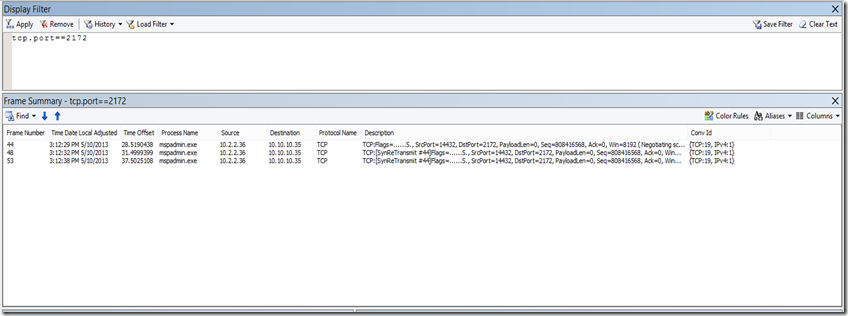
Depending on whether TMG is in a workgroup, in a domain, or a combination of both determines what port it will be using for this communication. In a workgroup environment, TMG uses SSL communication over TCP port 2172. In a domain environment it uses TCP port 2171. Use the same technique outlined above to gather Netmon capture data and then filter for the appropriate port depending on your environment. In my case my EMS is in a domain but my firewall server is in a workgroup so I am using TCP port 2172 for SSL (Figure 7).
Fig. 7
Again we see the same type of one-way traffic leaving one server and never being responded to by the other. This implies that something is in the middle blocking that traffic.
Conclusion
Troubleshooting errors commonly seen in the TMG management console can be somewhat challenging. I have outlined a few of the more common errors and how you can troubleshoot them. I hope that these tips will be useful to you and cut down on the time you spend trying to resolve these common error messages.
Comments
- Anonymous
August 20, 2013
I am getting one error in TMG . The error message is file:///C:/Program%20Files/Microsoft%20Forefront%20Threat%20Management%20Gateway/UI_HTMLs/TaskHandler/TasksHandler.htc I have searched for the 3 lines which contain "paddingTop", and remark-out each of them by adding "//" in the begining. But still this error is coming and I am unable to perform many tasks. So can you suggest a solution for this .
