BizTalk Services Tracking and Tracing
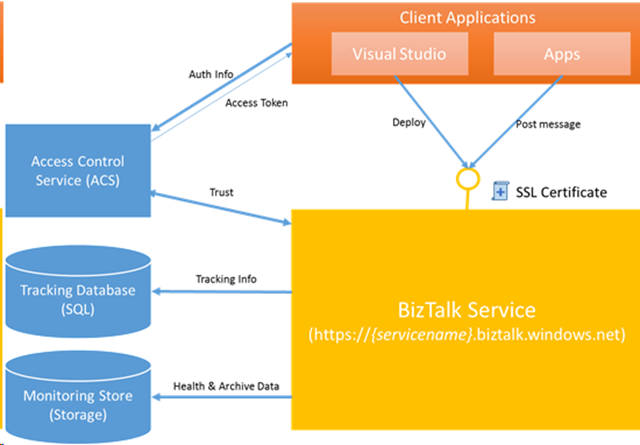
In Windows Azure BizTalk Services, customers do not have access to the machines where their code is running. Hence, great care is taken to show all your logs, different events that happen via the tracking and tracing logs.
Difference between Tracking and Tracing
It’s important to understand the difference between tracing and tracking and what data is collected in each one of them. For most cases unless you are tracing from custom code, tracking should be sufficient.
Tracking |
Tracing |
Tracking events are stored in Azure SQL Database |
Tracing information is stored in Azure Blob and WADLogsTable Storage |
Tracked events can be viewed via BizTalk Services Portal or BizTalk Services Explorer |
Tracing data is stored in Blob and Table Storage. Hence we use the storage explorer. |
You can turn tracking on/off as need be. |
Tracing is always turned on. This is not Configurable |
Tracking records includes --Operational Events are tracked. (Example: The different stages that are executed) --It tracks the errors that happened. --Message Properties --EDI Message body(this is stored in blob storage) |
Tracing information includes --Records Emitted by custom code context.Tracer.TraceEvent(TraceEventType.Warning, "Value: {0}", propertyValue). This is stored in WADLogsTable. --Perfmon --ETL files |
Can be deleted via PowerShell Clear-AzureBizTalkTrackingStore or SQL Stored Procedures PurgeBridgeTrackRecords and PurgeB2BTrackRecords |
Tracing data is auto deleted every 60 days. However, everything newer than that needs to be manually deleted via the storage explorer. |
Insight to Tracking Tables
Tracked records are stored in the SQL database.
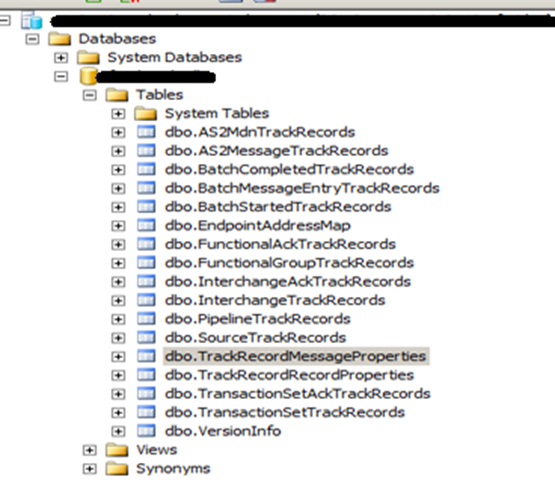
The tracking database exposes a GetTrackRecords stored procedure that can be used for retrieving the track records as well as automation of failure notification. The main tables in the database are:
Table |
Comments |
EndpointAddressMap |
Contains mapping of Bridge Endpoint Name to Endpoint Id which is used in the PipelineTrackRecords table. |
PipelineTrackRecords |
Contains the track records with names of stages, activities and the status of each. |
TrackRecordRecordProperties |
Contains detailed status for events with Parent Id corresponding to Id of PipelineTrackRecords record. |
TrackRecordMessageProperties |
Contains user defined and default promoted properties like X_PIPELINE_REQUESTMESSAGETYPE and X_PIPELINE_MESSAGETYPE |
What Gets Tracked?
There is a very good blog from the BizTalk Services Product team that covers the details of tracking. I have copied the same content below.
· Operational Events are tracked. (Example: The different stages that are executed)
· It tracks the errors that happened.
· Message Properties
· EDI Message body(this is stored in blob storage)
Pipeline and Source Track Records
Track Records can be emitted by the Pipelines as well as FTP and SFTP Sources. Pipelines can emit below information and error events based on the configuration:
1. Pipeline started
2. Pipeline completed
3. Stage started – emitted for all the Enabled Stages like xmlvalidator, requestMessageExtractor, requestMessageTransform, transformedResponseEnrich, route, sendReply and others.
4. Stage completed
5. Artifact Retrieved - for artifacts like schemas and transforms
6. Custom – emitted from custom code inspectors when they are set.
7. Route – show the route status for the message ie faulted or success.
8. Faulted – when any error is thrown like lookup failed, validate failed
With "Track All Message Processing Events" option set to true all the above events get saved in the tracking database, but the BizTalk Portal Tracking section will only show last four events. For EAI scenarios, FTP and SFTP Sources emit below events to the tracking database.
1. TrackSubmitted – emitted when the message is submitted to the pipeline
2. TrackProcessed – emitted when the message is deleted from the source. Faulted when delete fails as in case of read only user.
3. TrackStatus – emitted on source start and stopped. Faulted when service cannot connect to the FTP server.
4. TrackRetrieved – error event is emitted when the file cannot be retrieved from the server in cases like it being a subfolder inside the FTP folder. Error looks like ‘The remote server returned an error: (550) File unavailable (e.g., file not found, no access)’.
5. Poll Error – emitted when one of the above errors happen. The poll interval in increased to 1.5 times on each poll error in order to give time to rectify the issue.
6. Listing error – emitted when the listing of the files fails eg when the configured FTP folder is deleted
The Tracking portal will only show error events for the sources.
EDI Message Body Tracking
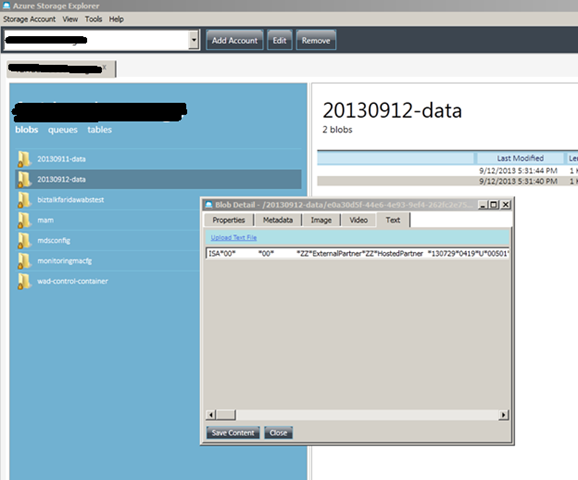
The EDI message body tracking when turned on is tracked in the blob storage. A blob container gets created every day and it contains the message body. You can use the Azure Storage Explorer.
How to enable tracking
Tracking can be enabled and disabled as needed. You can enable tracking at 2 places:
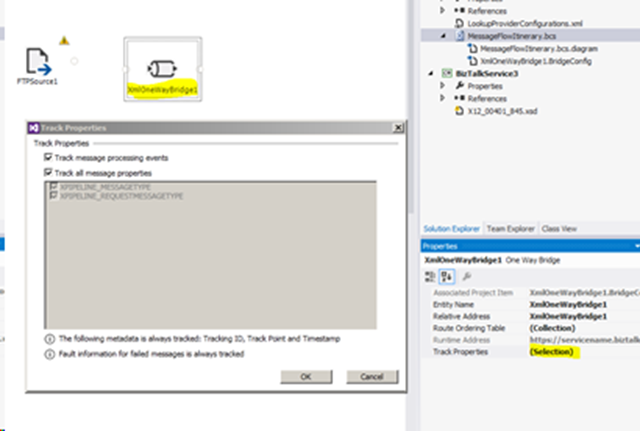
Pipeline. In VS, select your bridge. In Tracking Properties you can enable the tracking for the pipeline.
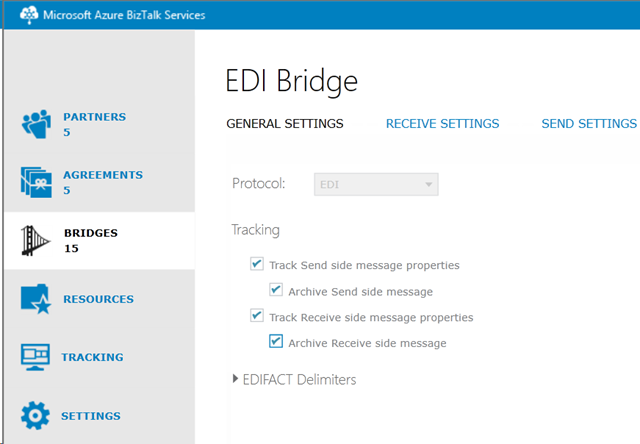
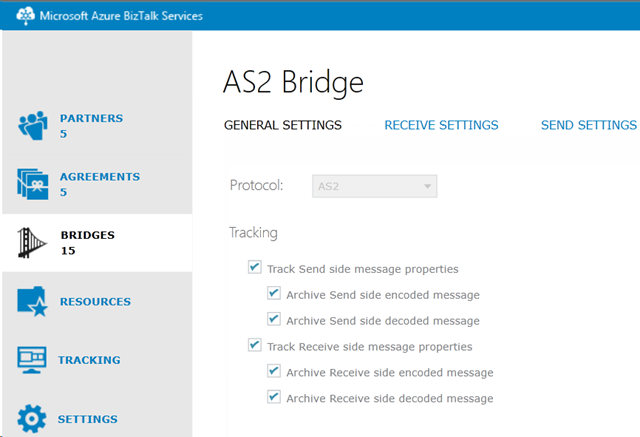
The 2nd way to enable tracking is for B2B. Go to BizTalk Services Portal. Click respective EDI / AS2 bridge and check the tracking options. You will need to Deploy the bridge after making the changes.
How to View the tracked Records
There are 3 ways to view the tracked records. The tracked records go to the SQL database.
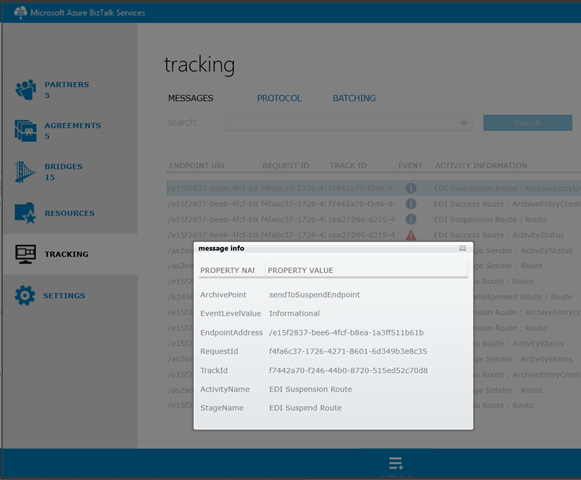
1. The easiest way to view the tracked records is from BizTalk Services Portal. Click tracking on the left and you should be able to view the tracked records. To open and view each record in details, click the record and click details at the bottom.
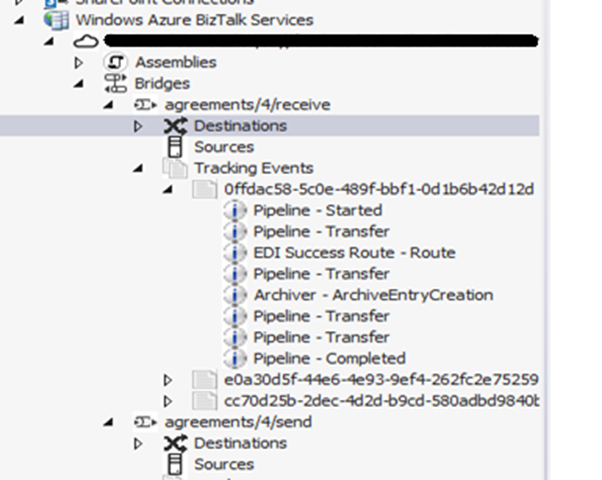
2. You can also view the tracked records from the BizTalk Services Explorer
3. The 3rd way is directly from SQL Azure Server. You can use SSMS to connect to SQL Azure. To get details of the SQL Azure being used, you will need to go to Azure portal/click BizTalk Services. On the dashboard tab, you will see the SQL Azure Database being used for tracking. If you click the database name, it will take you to the database page. Click Dashboard. On the left you will see ‘Show connection string’. Click this and it will show you the database name and the user ID for the database. Looking at the tracked records directly from SQL may not be very useful.
How to Manage Tracked Records
We have seen how to enable and view the tracking records. The tracking database needs to be managed (delete older records) by the customers. Currently you can delete the tracking records in 2 ways
1. Using the PowerShell cmdlet Clear-AzureBizTalkTrackingStore
https://msdn.microsoft.com/en-us/library/windowsazure/dn232411.aspx
• Run the following command to register the BizTalk PS cmdlet
import-module "C:\Program Files\Windows Azure BizTalk Services Tools\Microsoft.BizTalk.Services.Powershell.dll"
• You may need to Gac the storageclient.dll manually - gacutil /i Microsoft.WindowsAzure.StorageClient.dll
• The following command clears the SQL Tracking data until the date/time specified. Before you run this command make sure that you have updated the sqlString.txt and AzureStore.txt files with your SQL Azure and Storage details.
Sample AzureStore.txt DefaultEndpointsProtocol=https;AccountName=mystorageaccount;AccountKey=accountkey
Sample SQLString.txt
Server=tcp:mydb.database.windows.net,1433;Database=mydb;User ID=user@mydb;Password=password;Trusted_Connection=False;Encrypt=True;Connection Timeout=30;
Clear-AzureBiztalkTrackingStore -Sql (Get-Content sqlString.txt) -AzureStore (Get- Content AzureStore.txt) -Ndays 2 true -NoPrompt
2. Using the truncate stored proc to clear SQL Tracking data only. You can run the following stored procedures to delete the tracking records older than the specified date
PurgeBridgeTrackRecords '2013-09-12'
PurgeB2BTrackRecords '2013-09-11'
Tracing
Tracing is enabled by default. This feature cannot be turned off. Tracing information is stored in Azure Table and Blob Storage. You can use any storage tool to view this information.
A free tool that I like is Azure Storage Explorer. This can be downloaded from https://azurestorageexplorer.codeplex.com/
Tracing captures perfmon logs, ETL files and tracing information emitted by custom pipeline code. The ETL information is not much use to end customers because it needs formatting which in turn needs Manifest which is not available publicly. The ETL files are more for internal use by the support team.
However the custom code tracing information emitted by custom pipeline is most useful to customers. This is stored in the WADLogsTable. You can use the following code to configure tracing from custom code. context.Tracer.TraceEvent(TraceEventType.Warning, "Value: {0}", propertyValue). This is stored in WADLogsTable.
The tracing information is automatically deleted after 60 days. Hence the most information you will have is worth of 60 days. You can manually delete some of the tracing information if you do not want to logs too large. You can delete the etl files from the container named similar to your BizTalk Services name.
