SQL High CPU and TempDB Growth By Scalar UDF
Most high CPU troubleshooting technologies focus on execution plan compilation and recompilation OR suboptimal plans such as hash or merge join, among others. We (MSDN SQL team) recently found out a unique scenario of using scalar UDF (user defined function) and tempDB object (temp table or temp variable) that can also lead to high CPU usage as well as tempDB growth.
In this post, I will show you an easy to understand, reproducible demo that you can try it out yourself. I will also use several performance counters to illustrate different anomalies by changing a section of the code.
Preparation:
First, let's create a simple table and a one liner scalar UDF:
create table tblDateDT (DateID int identity(1,1) primary key, dtDate datetime)
go
declare @i int = 0,
@cnt int = 1000000,
@dt datetime = '2000-01-01'
-- Populate tblDateDT with one million rows
while @i < @cnt
begin
insert tblDateDT (dtDate) values ( dateadd(day, @i, @dt) )
select @i = @i + 1
end
go
Create function dbo.UDF_GetLongDateString (@dtDate datetime)
returns varchar(1000)
as
begin
return convert(varchar(1000), @dtDate, 109)
end;
Next, select the following performance counters and start a trace:
Object |
Counter |
Processor |
% Processor Time |
SQLServer:Access Methods |
Index Searches/sec |
SQLServer:Access Methods |
Page Splits/sec |
SQLServer:Transactions |
Free Space in tempdb (KB) |
Baseline from Perf Counter Perspective:
Let's first establish a "healthy" baseline without CPU and tempDB anomalies. Run this simple select statement:
declare @temp table (DateID int, strDate varchar(1000), dtDate datetime)
insert @temp(DateID, strDate, dtDate)
select dt.DateID, convert(varchar(1000), dt.dtDate, 109), dt.dtDate from dbo.tblDateDT dt
select top 1 * from @temp
Here's the @@version of my test box: Microsoft SQL Server 2008 (RTM) - 10.0.1600.22 (X64) Enterprise Edition (64-bit) on Windows NT 6.0 <X64> (Build 6001: Service Pack 1).
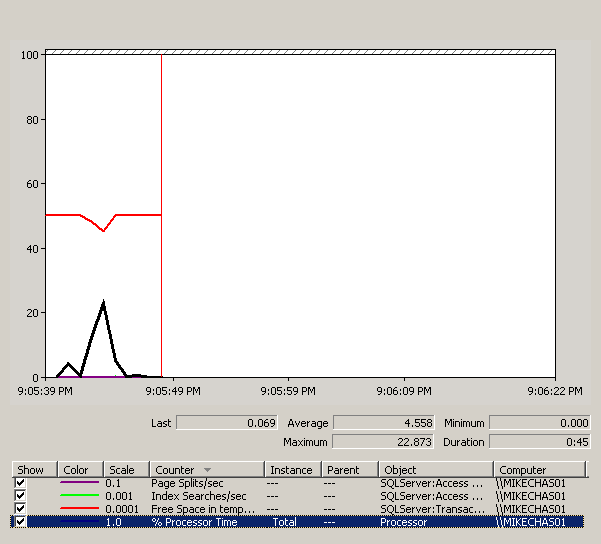
On my quad proc, 8G workstation, it took just one second to run. Pause perfmon and you should see a graph like below.

Figure 1: A baseline showing a CPU uptick and a tempDB free space dip
As you can see, we have a slight CPU spike while in the meantime the free tempDB space dips a bit for populating the temp variable.
Baseline from SQL Internal Perspective:
Now let's get some baseline from SQL internal perspective. We will turn on statistics time, IO and profile options to see the duration, temp objects and execution plan. Run the same query but add the three extra statistics options
set statistics time on
set statistics profile on
set statistics io on
go
declare @temp table (DateID int, strDate varchar(1000), dtDate datetime)
insert @temp(DateID, strDate, dtDate)
select
dt.DateID, convert(varchar(1000), dt.dtDate, 109), dt.dtDate from dbo.tblDateDT dt
select top 1 * from @temp
go
set statistics time off
set statistics profile off
set statistics io off
And here is the output: ( The output is truncated to the right so you may want to blow up your IE window if lines don't align well.)
Table 'tblDateDT'. Scan count 1, logical reads 2609, physical reads 0, read-ahead reads 0, lob logical reads 0
(1000000 row(s) affected)
Rows Executes StmtText
-------------------- -------------------- --------------------------------------------------------------------
1000000 1 insert @temp(DateID, strDate, dtDate)
select dt.DateID, convert(varchar(1000), dt.dtDate, 109), dt.dtDate from dbo.tblDateDT dt
1000000 1 |--Table Insert(OBJECT:(@temp), SET:([DateID] = [DemoDB].[dbo].[tb
1000000 1 |--Top(ROWCOUNT est 0)
0 0 |--Compute Scalar(DEFINE:([Expr1006]=CONVERT(varchar(100
1000000 1 |--Clustered Index Scan(OBJECT:([DemoDB].[dbo].[tbl
(5 row(s) affected)
SQL Server Execution Times:
CPU time = 1014 ms, elapsed time = 1100 ms.
DateID strDate
----------- --------------------------------------------------------------------------------------------------
1 Jan 1 2000 12:00:00:000AM
(1 row(s) affected)
Table '#2FCF1A8A'. Scan count 1, logical reads 2, physical reads 0, read-ahead reads 0, lob logical reads 0, l
Rows Executes StmtText StmtId NodeId Parent
-------------------- -------------------- ------------------------------------- ----------- ----------- ------
1 1 select top 1 * from @temp 2 1 0
1 1 |--Top(TOP EXPRESSION:((1))) 2 2 1
1 1 |--Table Scan(OBJECT:(@temp)) 2 3 2
(3 row(s) affected)
There is nothing unusual here. It took one second to scan the tblDateDT and then put it into temp table variable, #2FCF1A8A. The execution plan shows that there just one execution in each node and the data is kind of "streaming" into @temp. The inline Convert function is handled, well, "inlined". Later, when we replace the inline Convert function with the scalar UDF UDF_GetLongDateString, we will see the a change of the plan as well as how SQL handles the data flow.
Use Scalar UDF to Insert Temp Table Variable:
The following script has the inline Convert function replaced by the scalar UDF, dbo.UDF_GetLongDateString.
declare @temp table (DateID int, strDate varchar(1000), dtDate datetime)
insert @temp(DateID, strDate, dtDate)
select dt.DateID, dbo.UDF_GetLongDateString(dt.dtDate ) , dt.dtDate from dbo.tblDateDT dt
select top 1 * from @temp
Perf Counter Analysis:
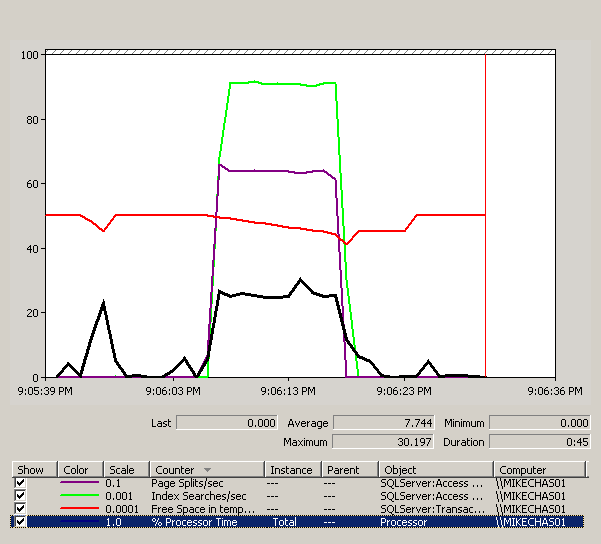
Resume the perfmon counter trace and run the script. Upon completion, pause the perfmon trace and you should see something similar like below.

Figure 2: Compared to the baseline in the left, the center is the scalar UDF anomalies of extra tempDB usage, page splits and index searches.
The duration is a long 12 seconds on my box, 10 times longer than our base line. CPU usage spikes up from the get go and stays that way for the rest of the batch execution. Ignore the tiny spike two thirds of the course as it's backgound noise. The page splits and index searches counters not seen in the baseline stay plateaued and trend together with CPU usage. Lastly, the tempDB free space slowly chips off and has a sudden drop at the end. The space is reclaimed in two steps, at the end of the batch and about 3 seconds afterwards.
While these are interesting trends but how do they correlate with each other? Stay with me, they will make more sense once we look into SQL internal.
SQL Internal Analysis:
Let's run the same script with three statistics options on
set statistics time on
set statistics profile on
set statistics io on
go
declare @temp table (DateID int, strDate varchar(1000), dtDate datetime)
insert @temp(DateID, strDate, dtDate)
select dt.DateID, dbo.UDF_GetLongDateString(dt.dtDate), dt.dtDate from dbo.tblDateDT dt
select top 1 * from @temp
go
set statistics time off
set statistics profile off
set statistics io off
Output:
Table 'Worktable'. Scan count 1, logical reads 2974753, physical reads 0, read-ahead reads 0, lob logical reads 0, lob physical r
Table 'tblDateDT'. Scan count 1, logical reads 2609, physical reads 0, read-ahead reads 0, lob logical reads 0, lob physical read
(1000000 row(s) affected)
Rows Executes StmtText
-------------------- -------------------- ---------------------------------------------------------------------------------------
1000000 1 insert @temp(DateID, strDate, dtDate)
select dt.DateID, dbo.UDF_GetLongDateString(dt.dtDate), dt.dtDate from dbo.tblDateDT dt
1000000 1 |--Table Insert(OBJECT:(@temp), SET:([DateID] = [DemoDB].[dbo].[tblDateDT].[DateID] a
1000000 1 |--Table Spool
1000000 1 |--Compute Scalar(DEFINE:([Expr1006]=[DemoDB].[dbo].[UDF_GetLongDateString]
1000000 1 |--Top(ROWCOUNT est 0)
1000000 1 |--Clustered Index Scan(OBJECT:([DemoDB].[dbo].[tblDateDT].[PK__t
(6 row(s) affected)
SQL Server Execution Times:
CPU time = 13557 ms, elapsed time = 14208 ms.
DateID strDate
----------- ---------------------------------------------------------------------------------------------------------------------
793793 Apr 30 4173 12:00:00:000AM
(1 row(s) affected)
Table '#6166761E'. Scan count 1, logical reads 2, physical reads 0, read-ahead reads 0, lob logical reads 0, lob physical reads 0
Rows Executes StmtText StmtId NodeId Parent PhysicalOp
-------------------- -------------------- ------------------------------------- ----------- ----------- ----------- -------------
1 1 select top 1 * from @temp 2 1 0 NULL
1 1 |--Top(TOP EXPRESSION:((1))) 2 2 1 Top
1 1 |--Table Scan(OBJECT:(@temp)) 2 3 2 Table Scan
Using the scalar UDF in the insert @temp statement introduces an extra "Worktable" table. It is created with the strDate column left blank. The scalar function then updates the nvarchar column with an about 26 character wide value (for example, Apr 30 4173 12:00:00:000AM). There you have the classical page splits. What I also experimented is the make the nvarchar column narrower and I can see a lower page splits plateau. However, as I tried different page splits rates, they don't affect CPU usage much. So where is CPU usage coming from? It's the index searches.
Notice that there are close to 3,000,000 logical reads against the "Worktable". That's 3 times the row size. If this number sounds familiar, you're not mistaken. It's a bookmark lookup. When the scalar UDF needs to update the "Worktable", it performs a bookmark lookup to get to the row. The number of reads is not exactly 3 times since it contains reads when the BTree is only two level deep. Remember we have a constant page split causing "Worktable" to gradually grow into a big size. This also explains why we have a slow but constant consumption of tempDB free space. It's the scalar UDF, row by row, updating the varchar column and expanding the "Worktable". When the UDF is done with the last row, it jams all the complete resultset into the temp table variable and that causes the sudden dip in tempDB at the end of the batch.
Summary:
In a nutshell, when INSERT INTO @temp or #temp ... followed by SELECT scalar_UDF()... syntax is used, an extra worktable is used to pass data to the UDF, which in turns, tries to find one row at a time to process (hence the index searches caused by repetitive bookmark lookups) and updates a column in the worktable (hence the page splits and tempDB usage growth).
Just like in the case of temp table variable VS temp table, you should know the pros and cons of different technologies in order to implement the features that can help you to achieve your business need. This blog serves as an informational purpose and hope with the better understanding of the behaviors I just presented, you will use scalar UDF in the scenario that's best suited for you.
Happy coding,
Mike Chang
SQL SDE,
MSDN
Comments
Anonymous
July 07, 2009
I am able to reproduce the same thing with SQL 2005. Microsoft SQL Server 2005 - 9.00.3282.00 (Intel X86) Aug 5 2008 01:01:05 Copyright (c) 1988-2005 Microsoft Corporation Standard Edition on Windows NT 5.2 (Build 3790: Service Pack 2)Anonymous
July 29, 2009
is it 3 times, or 1000 times of row size? udf's are bad as they turn set based operations to row based.Anonymous
April 06, 2010
Rafat, you probably refer to this section of the blog: 'Notice that there are close to 3,000,000 logical reads against the "Worktable". That's 3 times the row size. ' What I compare to is the row size of the "Worktable" which got inserted 1-1 from tblDateDT where I make an initial population of 1,000,000 rows.