Windows 7: Troubleshooting Disk IO
If you have additional tips, tools, information to improve this topic, please feel free to add and update this article, it is the wiki way!
Minimizing the amount of data that is written to a disk can massively impact the scalability and performance of you solution. Before you can minimize it, you need to understand what is happening. If you are using Windows 7 as a VDI client, you really care about disk IO. If you are using differencing disks you really care about disk writes.
More disk writes = (bigger child vhd * many virtual machines) = More Storage = More Dollars
You need a sorted list on which processes are writing the most data and to which files. It is helpful to have the exact command line that is calling each process.
This article is a step by step guide on how to identify how much data each process is writing to disk. It’s particularly relevant for VDI installations, but also applies to physical Windows 7 installations. It is based on the blog article: http://blogs.technet.com/b/benp/archive/2010/08/19/how-to-figure-out-which-processes-are-generating-disk-io-in-windows-7.aspx.
Installing the Tools
Install the Windows Performance Toolkit .
Generate the Log File Using Xperf
1. Open a Command Prompt as administrator and navigate to the directory that contains Xperf.exe.
2. Start Kernel Tracing by running the command line.
xperf -on DiagEasy
3. Stop the tracing with this command line.
xperf -d c:\MyFolder\MyTrace.etl
Analyzing the Trace in XPerf
These steps help you identify which processes are writing data
1. Open the Trace in XPerf.
xperf c:\MyFolder\MyTrace.etl
2. Right Click on the “Disk” section of the graph click “Summary Table”.
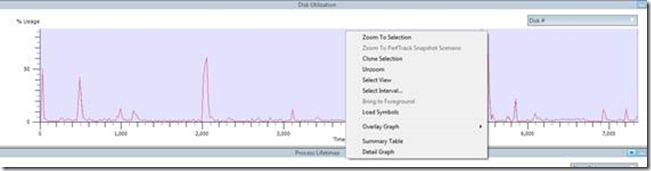
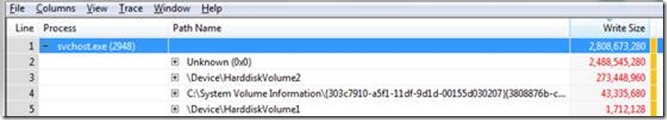
3. Sort on “Write Size” to find the processes writing the most data and use “Path Name” to find the files being written to.
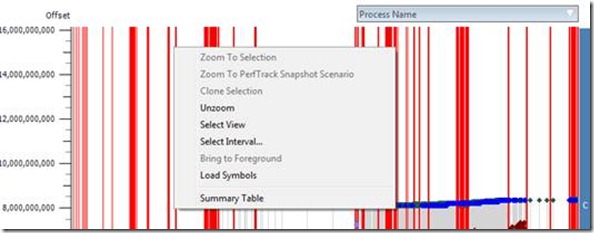
4. To get more details about each process, right click on the “Checkpoint” graph and select “Process Summary Table”.
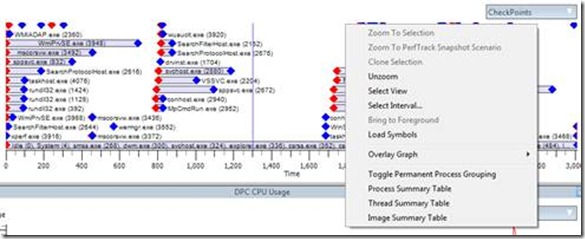
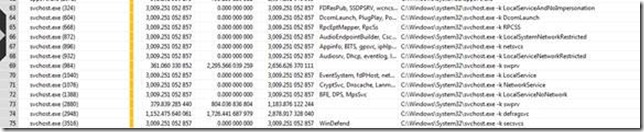
5. Use the “Command Line” column to help identify how the process started. This is particularly useful for looking at what each svchost.exe is actually doing.
Analyzing the trace in Excel
You might want to analyze the trace in a more familiar tool and generate some custom reports.
1. Open the Trace in XPef.
xperf c:\MyFolder\MyTrace.etl
2. Right click the “Disk” graph and select “Detail Graph”.
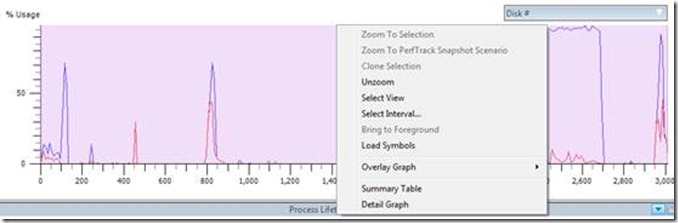
3. On the new graph right click and select “Summary Table”.
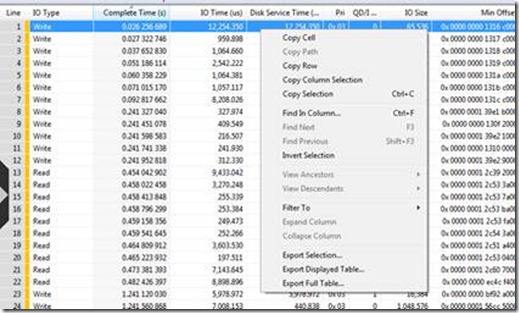
4. On the table right click, select “Export Full Table” and save to a CSV file.
5. Open the CSV file in Excel and save it as an Excel Workbook.
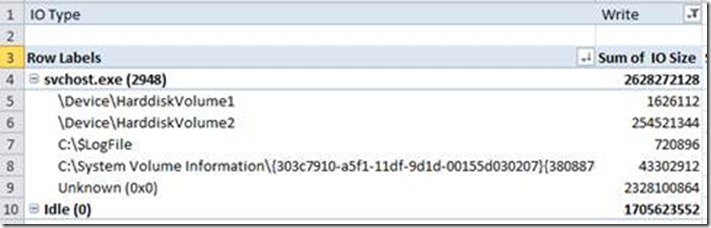
6. Insert a pivot table using the entire data set and set it up like this:
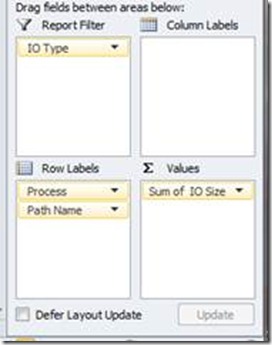
7. Filter the pivot table based on “Write” and the table should look like screenshot below. You might then want to sort the table on “Sum of IO Size”.
Next Steps
Note: “c:\Kernel.etl” is the file used to store all the performance data. This will grow to be quite large and can be discarded from your analysis as it is only generated when you are actively monitoring Windows.
By now you have a sorted list on which processes are writing the most data and to which files. You also have the exact command line that is calling each process. The next stage is the tricky part! You need to identify the purpose of the processes writing the data.