Operations Manager Management Pack Authoring - Defining a Health Model
This document is part of the Operations Manager Management Pack Authoring Guide. The Microsoft System Center team has validated this procedure as of the original version. We will continue to review any changes and periodically provide validations on later revisions as they are made. Please feel free to make any corrections or additions to this procedure that you think would assist other users.
Designing a health model Operations Manager for an application consists of determining the required set of monitors to accurately measure the health of each class in the service model. Dependency monitors are defined to order to roll up health between classes and provide an overall application health. Rules are added to collect valuable information for analysis and reporting. The following sections provide a basic process to help you design a health model to monitor an application.
Failure Mode Analysis
The first step in designing the health model for an application is defining monitors for each class in the service model. The goal is to provide a combination of different kinds of monitors to appropriately measure the health of each managed object. If the set of monitors are designed correctly, then any issue with the application will result in one or more monitors changing from a healthy state to warning or critical. If there are flaws in the design of the monitors, then the actual health of the application may not be accurately detected. An issue may occur in the application that is not recognized by a monitor, or a monitor may change to a negative state when the application is not actually experiencing a problem.
Define Unit Monitors
A combination of different kinds of monitors will frequently be required to accurately measure the health state of a particular class. The questions that can be asked for each class to define its monitors are as follows:
- What functions does the object perform and how can each function be tested? Does the application provide this information or is a synthetic transaction required to test the functionality?
- What information does the application create that might indicate a loss in functionality? Where is the information stored? What component of the application does it apply to? What, if any, indicators are there that the problem is corrected?
- How can the performance of the application be measured? Does the application make this information available or is a synthetic transaction required to collect the information?
- Are there any configuration requirements that could affect the operation of the application? Can this information be collected?
The answers to these questions will help in the definition of unit monitors to test different aspects of the application. It is important to define monitoring requirements for an application even if there is no identified ways to implement one or more of the required monitors. If a feature of an application provides no means of monitoring, then the application may experience an issue that the management pack will be unable to detect. This issue should at least be documented so that owners of the application understand the limitations of the monitoring being implemented. This information can also be used to work with developers to potentially change the application to make such monitoring possible.
As an example, the health model for the SQL Server 2008 DB class is shown here. This includes the SQL Server 2008 DB class itself in addition to the monitors for the SQL Server 2008 DB Engine class that hosts it and the SQL Server 2008 DB File class that it hosts. A diagram such as this can be useful in picturing the health of a particular class in addition to the classes directly related to it.
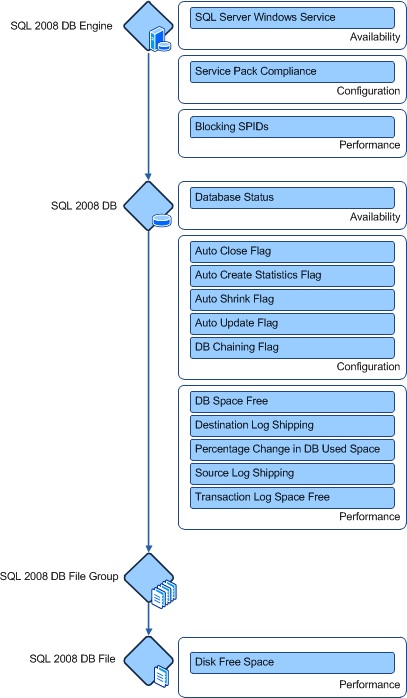
The database class itself is monitored by a combination of monitors by using events, scripts, and performance data to measure the health of each database. Availability status of the database cannot be retrieved through a simple method so that a script is required that connects to the database engine and validates the connection to each database. The script determines a status for the database identifying whether it is available for connections. If a connection to the database cannot be made for any reason, then this monitor will change to a warning or critical state.
Configuration monitors are defined for both the SQL Server 2008 DB class and the SQL Server 2008 DB Engine class. For the database engine, the SQL Server service pack level is retrieved through WMI to determine whether it is at a required level. The user is expected to use an override to define the required level for their environment. Configuration monitors for each database are defined by using a script that retrieves different properties of the database and compares each to recommended values. Configuration of the database or database engine does not necessarily affect availability or performance, but providing monitors for these properties enables the user to identify configurations that do not match required standards for their environment and that could lead to eventual lead to issues with availability or performance.
Diagnostics and Recoveries
As soon as monitors are defined, diagnostics and recoveries for each can be considered. Most monitors will not have either. Diagnostics are only defined if there is additional information to collect about the detected issue. Many monitors already contain all available information, or additional information must be collected manually by the user. Diagnostics should only be defined when additional information about the issue that may be useful to the user can be retrieved programmatically.
As discussed in the Diagnostics and Recoveries section of this guide, recoveries should only be defined after careful consideration. Because recoveries try to make some change to the external environment, they can cause issues in addition to the one they are responding to. The strategies discussed in that section of configuring recoveries to run manually or after a diagnostic can be used to lessen this risk. An automated recovery should only be configured in response to a monitor if the following two questions can be answered affirmatively.
- Has the specific issue that the recovery is intended to correct been correctly identified?
- Does the recovery have a high degree of probability that it will correct the issue it is designed to correct without causing adverse side effects.
These questions may seem common sense, but realize that there may be multiple root causes for the issue detected a monitor, and each may require a different kind of recovery. Before a recovery is configured to run automatically, it should be verified that it will only run in response to the cause that it is designed for.
One strategy for designing diagnostics and recoveries is to delay their definition until the management pack has run in production for a while. This allows monitors to change state in response to actual issues with the application. Analysis of these incidents and the manual steps that were taken to correct them can lead to automated responses defined in diagnostics and recoveries.
Define Aggregate Monitors
Most applications will be adequately managed by using the standard set of aggregate monitors. Additional aggregate monitors may be added to a management pack to group related unit monitors targeted at a common class. This is performed either to make a large number of monitors more manageable or to provide a consolidated health state in a particular category.
For example, the Microsoft Windows DNS 2008 Server management pack includes an aggregate monitor called Resolution Rollup that is used for unit monitors that perform test resolutions and another called Services State Rollup used for unit monitors related to the state of DNS services. These aggregate monitors provide a combined health state for each set of related monitors and the Health Explorer for the state of the DNS Server 2008 class.
Define Dependency Monitors
As soon as unit monitors are defined to measure the health of individual classes and each are configured underneath a standard or custom aggregate monitor, then dependency monitors can be defined to roll up health between instances of different classes.
Hosted Classes
Any classes that use Windows Computer Role as a base class will automatically have their health roll up to Windows Computer. This is because the Microsoft Windows Library management pack includes a dependency monitor for Windows Computer Role targeted at Windows Computer. No dependency monitor has to be defined in this case.
Classes that use Windows Local Application as a base class will not automatically have their health roll up to Windows Computer. If the health of these classes should rollup to the hosting computer, then a dependency monitor has to be created.
Classes that use Windows Application Component as a base class and are hosted by another class in the application’s service model require a dependency monitor if their health should be rolled up to the hosting class. The hosting relationship that is required for the dependency monitor will already be in place.
The rollup policy for these dependency monitors will typically be worst state so that any instance of the Application Component class in an error state will cause a corresponding error state on the parent object. Best state and percentage though may be used for those applications requiring different logic.
Health Rollups
A dependency monitor will typically be defined for each containment relationship between any health rollup classes, if such classes are part of the application’s service model. The purpose for these classes is typically to roll up health for a set of objects, and this function is not performed without a dependency monitor. These dependency monitors will use different rollup policies based on their requirements. Worst state is the most common policy that is used, although best state and percent policies are common for health rollups.
Defining Monitors
Defining Rules
After monitors and health state are defined for each class in the service model of a System Center Operations Manager 2007 management pack, rules can be defined.
Alerting Rules
Alerting rules are used either when a monitor cannot reasonably be defined for a particular issue or when the issue does not relate to the health state of a particular class. The most common reason that a monitor cannot be defined is that there is no reasonable means of identifying that the issue was corrected. This is required to define the healthy state of the monitor. One strategy to address this challenge is using an alerting rule instead of a monitor.
Instead of creating an alerting rule, a monitor that uses a timer reset can be considered. We do not recommend a manual reset, especially targeted at a class that has multiple instances, because of the requirement that a user must always intervene to return the monitor to a healthy state. A timer reset monitor still influences the health state of the target object and will automatically reset to a healthy state if a user does not manually reset it in a specified time.
The other use of alert rules is to identify issues that do not relate to a health state. For example, the application might perform a data replication regularly. An alert should be created if the transfer fails, although the application is still fully functional. This issue is best identified through an alerting rule instead of a monitor.
A strategy that can be used to identify alert rules is to analyze all events created by the application that were not used in a monitor. These may be Windows events or may be provided in any of the event data sources previously discussed. Such events will typically identify errors in the application. Any events not used by a monitor are candidates for an alerting rule.
Minimizing Noise
A strategy of just creating an alerting rule for each event created by the application without analysis is not a best practice because excessive alerts can represent a source of noise in the Operations Manager environment with minimal value. Before you create any alerting rule, consideration should be given to whether the issue that is identified by the event is significant enough to create an alert. If the issue is minor, the event may just be collected for later analysis.
Analysis should also be performed to determine whether an event represents a unique issue not identified by another rule or monitor. A single application issue may have several symptoms generating multiple kinds of error events. There is minimal value in creating multiple alerts from the same root problem. Such noise can create too much work for the user and obscure alerts that identify other issues.
Collection Rules
Collection rules augment health monitoring by collecting information for reporting and analysis in the Operations console. The most common collection rules will be those collecting performance data. This may be any Windows performance counters that are provided by the application or could be response times and other numeric data that is created by monitoring scripts.
The first data that should be considered for collection is any performance data that is used in monitors. The monitor sets health state based on comparing the numeric data to a threshold, but it does not store the data for analysis. Having trending and historical data to support the monitor will typically be useful for the end-user. Additional performance data that might be available should be defined taking into consideration storage requirements. If performance data is of minimal value in daily monitoring then it may not be worth the space that is required for its storage.
Practices to Avoid
Focus on the easy–to-monitor instead of the required
We recognize the natural tendency to start a health model design for an application by analyzing the monitoring information made available by the application through events and other easily obtained information. However, this approach assumes that the application is proactively identifying all issues and may leave a significant potential for an application issue to go undetected. If an application has a problem that does not generate an event or other information, then the issue will require a synthetic transaction or other way of identification.
One consistent strategy is to analyze the different features and potential issues for each classe defined in the service model. A process such as Failure Mode Analysis can help in this analysis. As soon as the monitoring requirements are identified, appropriate monitors and rules can be defined to address those requirements. This strategy encourages development of synthetic transactions and other proactive monitoring techniques in order to obtain information that the application does not make available on its own.
Running monitors and rules too frequently
Monitors and rules that use a script or WMI query that run too frequently can result in excess overhead on the agent. The overhead will vary, depending on the script or query and the number of other scripts and queries in the management pack. A general guideline is not to run a script or query at any interval more frequently than 5 minutes. Even with this guidance, the script or query should not be run any more frequently than is required for needed monitoring.
For collection rules, too frequent collection can result in significantly increased storage requirements and return minimal value. Although a single performance value is fairly small, storage requirements quickly accumulate for collection targeted at multiple instances across multiple agents. We recommend that you never have a collection frequency less than 5 minutes for counters with significant volatility. A frequency of 15 minutes is effective for counters with less variance. It also a best practice to use optimized collection for any counter that is not expected to consistently have a significantly different value between consecutive samples.
Multiple scripts running at the same time
If several monitors and rules that are running scripts are defined to run on the same interval, then there is a potential for them to consistently run at the same time. Every time that the interval arrives, all the scripts run, and a noticeable affect can be observed on the agent processor. One method to avoid this condition is to use a different synchronization time for each monitor or rule to make sure that they run at different times.
Targeting classes with multiple instances
As is discussed in the Targets section of this guide, a workflow targeted at a class that has multiple instances on an agent will have multiple copies of the workflow running on the same agent. Such workflows will typically require additional criteria by using a $Target variable to uniquely identify the particular instance. Failure to provide unique criteria can result in multiple alerts being created for a single event, or all instances of a particular class entering an error state instead of a single instance.