Analyzing the protocol logs and Message tracking logs in Exchange 2013
During the time of troubleshooting in mail delay and issues when users reporting emails not being received, it's a little bit tougher to isolate and identify the problem.
Message tracking and protocol logs analysis is one of the best ways to identify whether the problem exists in Exchange or elsewhere to prove that Exchange has successfully done its mail transaction on its end.
In this article, we will be looking at how to enable protocol logging and message tracking in Exchange 2013 and analyzing the protocol and message tracking logs in a little bit different way through Excel. Earlier in Exchange 2007 & 2010, we used to turn on Message Tracking in Hub transport servers.
Since Exchange 2013 the hub transport servers have been removed and the Message tracking logs are storon in the mailbox servers.
Steps to turn on Message Tracking in Exchange 2013:
Use EAC to configure Message tracking.
1. In the EAC, navigate to Servers > Servers.
2. Select the Mailbox server you want to configure, and then click Edit .
3. On the server properties page, click Transport Logs.
4. In the Message tracking log section, select the following:
◦Enable message tracking
5. Click Save.
Steps to turn on Protocol Logs in Exchange 2013:
Open EAC
Click on mail flow
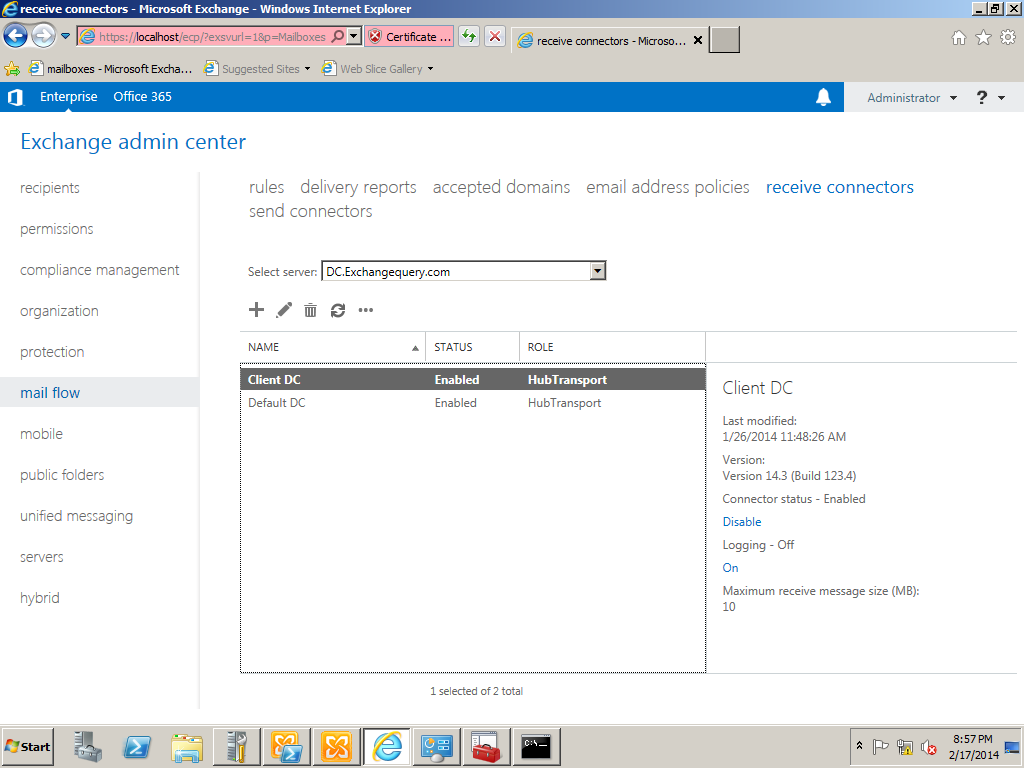
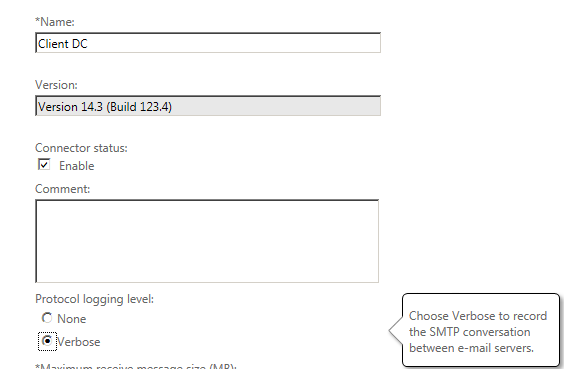
Double-click on receive connector tab and set the protocol logging level to verbose.
Now we are going to send a few test emails so that the logs get generated which would be ideal for us to analyze the logs.
So we are sending test email with subject “Test Email for Message Tracking”.
For analyzing the verbose logs it’s always better if we can use the log parser tool.
If still we need to analyze the data without log parser for single transaction it’s possible with sender and recipient to check if the mail transaction has been successful.
Below is an example.
For analyzing the logs in message tracking you can follow the below steps:
Copy the message tracking logs from the below location from the mailbox server.
Note: There will be four types of message tracking logs in Exchange 2013 unlike in Exchange 2010 we have only two.
•MSGTRK These logs are associated with the Transport service.
•MSGTRKMA These logs are associated with the approvals and rejections used by moderated transport. For more information, see Moderated Transport.
•MSGTRKMD These logs are associated with messages delivered to mailboxes by the Mailbox Transport Delivery service.
•MSGTRKMS These logs are associated with messages sent from mailboxes by the Mailbox Transport Submission service
MSGTRKMS is sufficient for us to calculate the message tracking in most of the situations.
We can use other logs in deep dive analysis of cases where we suspect the mail not being delivered to mailbox server and in a few cases where we are unable to find any transaction in MSGTRKMS logs to see if the mail is been delivered to the mailbox server from the CAS server.
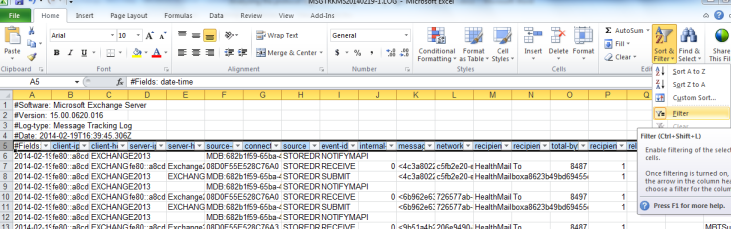
But MSGTRKMS will give us the information 99 percent of the time. After copying the MSGTRKMS logs in Excel, just filter the category column as shown below.
Now we have number of options to filter message transactions. In below example we are going to filter a particular transaction with Message subject and below is the output for successful transaction.
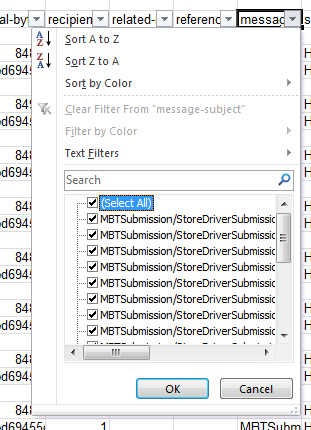
Just select the Message subject column drop down and uncheck select all as shown below.
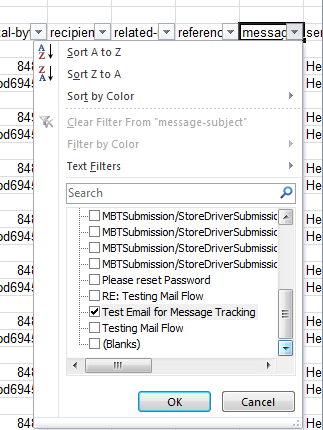
Just select Test Email for Message Tracking as shown below
Below output is the successful transaction of the message transaction after the filter is applied for our example scenario.
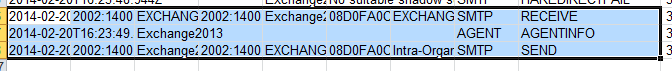
The below screenshot is the important parameter which should be checked and for a successful transaction i.e column (source and event-id) as shown below.
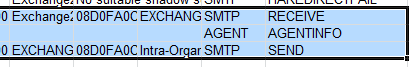
For a failure transaction we will not be having the receive status as shown above
We have multiple options like date time, Client IP, server IP, recipients through which we will be able to isolate a particular transaction very easily. Getting used to this will take some time but once after if you start analyzing the message tracking through this then you will feel comfortable with this type of message tracking Cook for situations like where you need to filter out multiple parameters.
Now we will look into how to analyze the receive connector protocol logs with help of Excel as we did for Message tracking.
First, copy the logs from the below location:
Note:
It is very clear we will be getting confused to see where to find the receive connector protocol logs since the transport level architecture have been bifurcated in Exchange 2013 and we have multiple folders like the front end, hub, protocol log unlike Exchange 2010 we have only this location:
“D:\Program Files\Microsoft\Exchange Server\V14\TransportRoles\Logs\ProtocolLog\SmtpReceive”
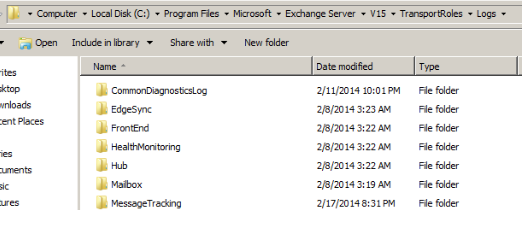
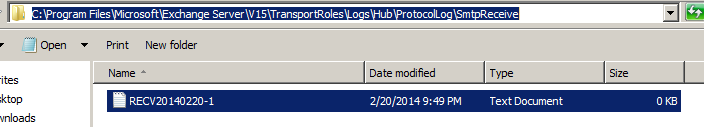
We just need to navigate to the below location alone in Exchange 2013 and copy the received connector logs which will be identical to analyze the protocol logs via Excel:
“C:\program files\Microsoft\Exchange Server\V15\TransportRoles\Logs\Hub\ProtocolLog\SmtpReceive”
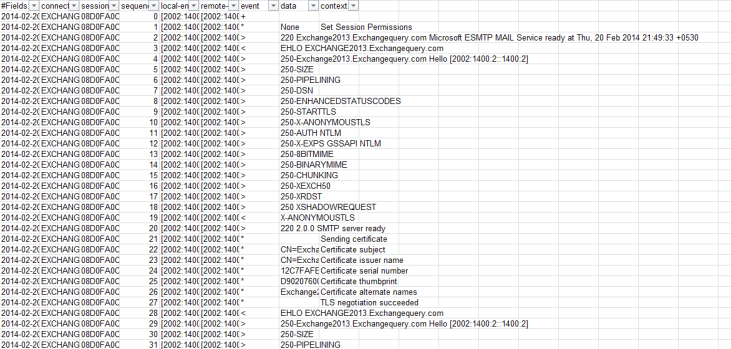
Open them in Excel.
Unlike in Message tracking we do not have many items for us to filter here as shown below. But we can always filter them via sender or recipient address who reported to be a problem with mail flow.
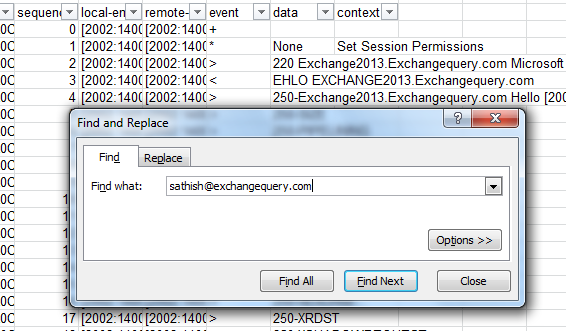
Now we are going to identify a successful transaction for user id Sathish@exchangequery.com through receive connector protocol logs. For that we just need to open the receive connector logs in Excel and search for the above email id in the Excel sheet.
Below is the successful transaction for the above search result:
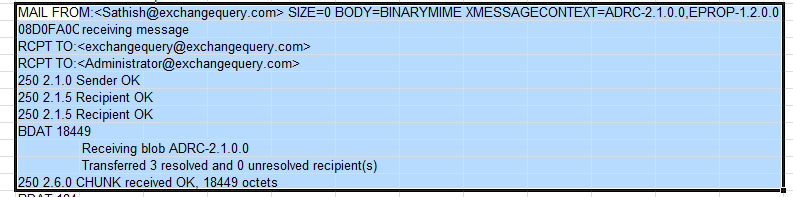
In the above screen it clearly mentions the mail from and the rcpt to . The final transaction result we can see is Transferred 3 resolved and 0 unresolved and 250 chunk received OK . This should be the output for a successful transaction.
Note: All we need to look at is only the data and context part in receive and send connector protocol logs which gives us info about the successful \ failure transaction.
You can also use log parser to analyze the protocol logs. The above steps is just an additional part of troubleshooting steps through deep dive into message tracking and protocol logs to narrow down mail flow issues to identify the root cause.