DevOps - Measuring the performance of your application
(***translation in progress***)
Introduction
The purpose of this article is to explain step by step, including delivering ready scripts for you to set, measure and interpret the performance counters of a server or computer, so you can identify the following points:
- Operating system behavior when your application is running;
- What are the ideal hardware, software, and configuration for your application to work properly;
- When there is slow if this slowness is associated with a bottleneck of resources and this bottleneck resources occurs due to low resource, concurrent use of other applications or mismanagement of their own use of resources.
- When a malfunction of your application or server to identify if any of the resources are overloaded causing this malfunction.
Measuring the AutoShape Performance
Currently, we have tools that automate the process explained below. The most common tools include Microsoft System Center Operations Manager consisting of a server with SCOM and databases and servers or computers that host your application, that has the SCOM agent installed. Then deploy the necessary templates on the SCOM server and enable the measurements and collect the data. It is an extremely powerful and easy to use the tool. Suitable for companies that have a Datacenter, including CPD to manage third-party applications to evaluate their behavior.SCOM can monitor measurements Services, Processes, Web Applications (IIS and Apache) and JAVA Applications.
Another tool that is an evolution of System Center in this regard is the Microsoft Visual Studio Application Insights that is using the same principle besides the measurements discussed above, and also directly monitors the application but returns to faults, exceptions, use of functionality of your application by the user, among other things, being necessary to instrument the application via Visual Studio. Its advantage is that it monitors in-place applications, the customer, cell phones, etc. Since the data is hosted in the Visual Studio Online.
But it is worth reading this article because before you use any tool, it is important to understand what to measure and how to interpret each measurement, and you often will not have such tools available for use and those that point out in this article are free and easy management.
Counters Base
What and when measuring. Understanding counters
Firstly, this post is specific to Windows, but there is very good material for other operating systems like Linux, OSX, etc.
There are five resource areas that can cause bottlenecks and affect server performance.
These areas are:
- Physical Disk,
- Memory,
- Process,
- CPU (processor) and
- Network .
If any of these features is used in excess, the server or the application may be very slow or even fail.
Very important:
Before we measuring the performance of disk and already saying it's okay, or any other resource, we must first understand a little about this feature.
For example:
Currently one of the fastest drives on the market are the disks SSD with direct bus on the board as the picture below: (Yes this is a disc)
https://qualidadeeti.files.wordpress.com/2015/11/revodrive3_x2_lrg_thumb.png?w=240&h=175
Now imagine that you collect a given data item and tells the server responsible for the problem is narrowing of the disc, and the server has a record of this? The likelihood of your analysis is incorrect is almost 100%. Indeed there may be a bottleneck, but possibly a process is being executed incorrectly generating this bottleneck. And the worst, the administrator can come up with a question that usually lets any developer or analyst hair standing.
OK, we have a bottleneck, I need you to tell me how many IOPS your application needs ... And then my friend?
So the ideal is to have careful look at all the counters, make an interpretation and oh yes talk to the IT team to see if there are any problems on resources.
Basic rules
It is very important to know about:
Maximum performance hardware
For example, what is the maximum transfer rate of a hard drive or a RAID configured? The idea is to know the hardware model and consults the manufacturer's manual. For example, an application with Microsoft SQL Server accepts a maximum reading / writing at most 10ms, to pass it causes a bottleneck. Ideally in this case, when the hardware does not support it or replace it with a higher speed, or mount volumes RAID or JBOD to give speed.
What are the most counters used to measure server performance:
The most used are the
- disk,
- memory,
- CPU,
- network and
- Process (application)
With these counters can understand where the bottleneck.
What is the association between these counters
For example, if I'm having a disk bottleneck caused by paging the operating system, means that RAM "just" and the system is in need write to disk to compensate for the lack of resources. If the processor is 80% with peaks, and disk and memory are in use within your normal, may mean it's time to review the processor and amount of used colors.
Some tips
The idea is to measure these counters server itself because it can be seen in these counters that sometimes your process (application) may have problem reading and writing to disk, but watching the disk counter is noticed " off ",ie, the application can be difficult to try to manipulate files and not the problem is the disc itself.
Your application is using all the colors of the processor correctly, or your application can use this balance? Or realizes that only one core of the 24 available in the processor is being used by your application? Or your application still works in 32-bit?
Key counters
To give you an assertive measurement, the idea is to measure the set in general server or computer running the application and the counters of the processes (the executable of your application and additional executables such as W3Wp.exe Internet Information Services, when your application is Web).
Server Counters / Computer
The more measured counters and used on a server are processor, memory, disk and network times. And among these counters are specific sub counters you should use as needed.
See this article the sub counters available and what is it used.
https://technet.microsoft.com/en-us/magazine/2008.08.pulse.aspx
Counter your process (executable of your application)
You must individually measure the processes that constitute your application, and this process, the most common counters are:
- CPU time,
- Handles or pointers,
- memory.
Processor Time
Measures the percentage of elapsed time spent by the processor in executing a thread. If the percentage exceeds 85%, the processor is overloaded.
https://qualidadeeti.files.wordpress.com/2015/11/burning-cpu_thumb.jpg?w=240&h=240
Handles or Pointers:
An object is a data structure that represents a system resource such as a file, line, or graphic. An application can not directly access data object or system resource that represents the object. Instead, an application must obtain an object identifier, which it can use to examine or modify the system resource. Each handle has an entry in an internally maintained table. These entries contain the addresses of the resources and the means to identify the resource type.
Ie your application "opens" a request through a pointer (handle) to the operating system to access a resource, and once completed, it closes. What can happen is the opening of numerous pointers without finalizing after the resource query, generating an overload on the system to full availability of the same.
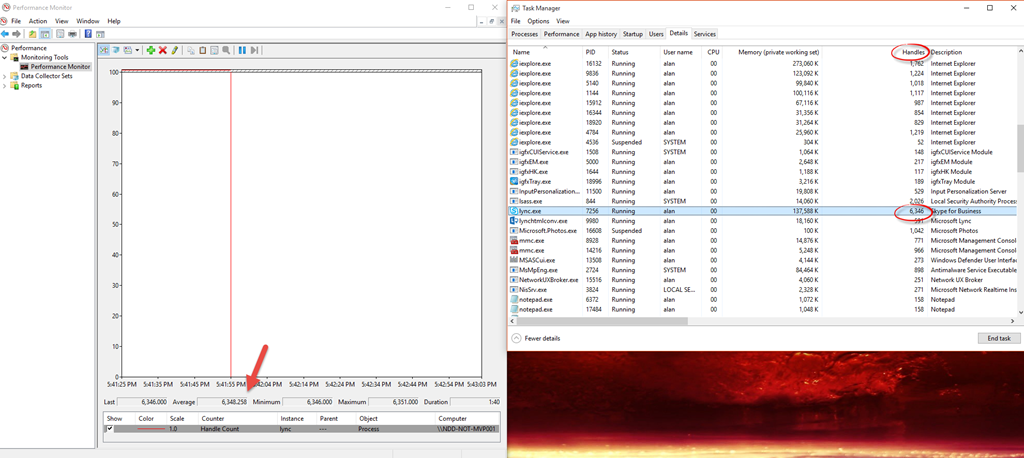
See the counter below Perfmon, compared with the Task Manager.
https://qualidadeeti.files.wordpress.com/2015/11/image_thumb1.png?w=644&h=290
And what is the ideal number of Handles?
It depends on the application but a visible behavior that something is wrong is the daily increase that number, more and more increasing than decreasing during the day. But as a rule, any process that I have more than 10,000 open handles, is possibly poorly designed or is experiencing a "leak" identifiers and must be evaluated by the development team.
See this article: Pushing the Limits of Windows: Handles
Another way to identify a possible leak Handles is to use Process Explorer from Microsoft and monitor the management of identifiers if you know through Perfmon graph a significant increase in Handles.
In this case, I enabled the visualization of Handles panel in Process Explorer and followed what a process is using, opening and closing.
https://qualidadeeti.files.wordpress.com/2015/11/image_thumb.png?w=244&h=202
Memory
Extremely important counter, because behind us crucial information such as memory usage by process. We can identify if consumption is according to expectations if there is a lack of memory or a leak by mismanagement or BUG.
But how much is enough that a process can use?
When we know that there is a memory leak or memory leak? How much memory is enough for the server or computer?
You must first understand how a process of application allocates to perform a certain activity. For example, for my application process a batch of 10 satisfactorily document the process utilizes 2048 K memory and Process B uses 1024 K. After completed processing, the process frees the memory or keep using the minimum.
At that moment when you measure the memory, you can evaluate the following items:
- Once the process concluded memory usage, it releases memory, keeps the memory, or allocate more and more memory without running any processing?
- After he sued the batch of 10 documents when it processes a lot more, it significantly increases memory usage to double? That is, every time it processes a batch process doubles the memory usage?
- The amount of memory used by my process, is a reasonable amount where it will work in a standard environment with 08 GB servers with their other concurrent processes? Or for my application to work, I have to provide a considerable amount of memory for my claims, and that acceptable to the market and customer?
In Task Manager or Task Manager, physical memory used will be in the "Memory (private) for their specific process. In Performance Monitor, the counters will be Memory - Working Set.
https://qualidadeeti.files.wordpress.com/2015/11/image_thumb2.png?w=644&h=341
You can also follow if there is memory available on the server, to identify if you are with memory management problems or not by their process, as the available measurement memory is really a ready free memory for use by a process.
The Windows operating system defines available memory as physical memory that is not assigned to a process, the kernel or device drivers.
In Performance Monitor, the counter is Memory - Avalilabe MBytes. Note that it states that the operating system has approximately 14 GB of free memory.
https://qualidadeeti.files.wordpress.com/2015/11/image_thumb3.png?w=644&h=235
This counter is extremely important because measuring it more what is used by your process, you can identify if there is a lack of memory on the server causing delays in your application or not.
Counters of processes that behave Its Application
Of course, your application uses various operating system processes, and it would be complex to measure all, such as the famous SVCHOST of Windows that is virtually your CORE. But where the light of experience. In short, there are processes such as:
- SPOOLER.EXE:it comes to printing matters
- W3Wp.exe: that comes to Web applications hosted on Internet Information Services
These processes you can use the Handles counter (Pointers Quantity), Memory (Physical Memory Used) and processor (CPU time)
Scripts and Templates Ready
https://qualidadeeti.files.wordpress.com/2015/11/powershell_thumb.png?w=185&h=139
For convenience, I leave here the links to download a collection of PowerShell scripts as well as templates to be used as needed.
Using the Template Server Collector - Model A
This template works on Windows 2008, Windows 2012, Windows 7, Windows 8 and Windows 10. It has the Server counters: Disk, Processor and Memory and Process: Handles, Thread, Memory, Disk.
or click directly on the link: https://gallery.technet.microsoft.com/e-Template-para-uso-no-1218cac8
Open Performance Monitor - Data Collector Sets - New - Data Collector Set
https://qualidadeeti.files.wordpress.com/2015/11/image_thumb4.png?w=244&h=177
Enter the name of the Data Collector, then select Create from the template.
https://qualidadeeti.files.wordpress.com/2015/11/image_thumb5.png?w=244&h=192
Select the template
Server Collector - Model A
https://qualidadeeti.files.wordpress.com/2015/11/image_thumb6.png?w=244&h=123
Click Finish. Then click Start.
https://qualidadeeti.files.wordpress.com/2015/11/image_thumb7.png?w=244&h=116
This collector will work until it occupies a LOG space of 600 MB or if you stop him before. and its default directory is an image.
https://qualidadeeti.files.wordpress.com/2015/11/image_thumb8.png?w=244&h=34
You can change the settings of the same properties as the directory, stop conditions, account that will run the collector (administrator, for example).
https://qualidadeeti.files.wordpress.com/2015/11/image_thumb9.png?w=211&h=244
To learn more, visit the links below:
Important: Remember that in addition to Server counters, you must also activate the process counters. The package is available a template for the Windows Calculator process with key counters. You should only change the process of its implementation.
https://qualidadeeti.files.wordpress.com/2015/11/image_thumb10.png?w=232&h=244
Analyzing the Collected Counters
After doing the collection of data from the server and processes that make up your application, we will now interpret the data.
https://qualidadeeti.files.wordpress.com/2015/11/analysis_thumb.jpg?w=640&h=366
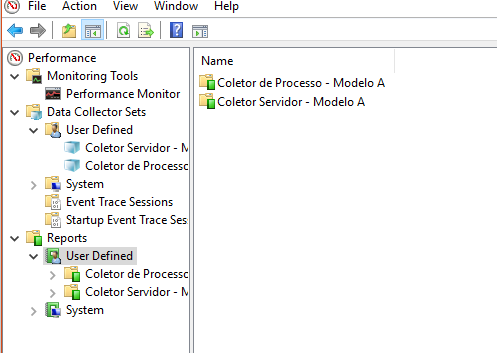
Then we have the collectors below:
https://qualidadeeti.files.wordpress.com/2015/11/image_thumb11.png?w=244&h=49
We will in
Reports - Server Collector
https://qualidadeeti.files.wordpress.com/2015/11/image_thumb12.png?w=244&h=174
The first counter to be noted is the
Processor Time
During the period that your application was running, the percentage of processor occupancy averaged "average" of 16%, ie the processor and its colors were working quietly because it was a value of the total content.
https://qualidadeeti.files.wordpress.com/2015/11/image_thumb13.png?w=244&h=155
The next is the percentage of
Idle Disk Time
.
https://qualidadeeti.files.wordpress.com/2015/11/image_thumb14.png?w=244&h=157
Noting disc was the average (average) 99% or, most idle. If this number was below 20%, it would be necessary to further investigate the processes that were causing this bottleneck on the disk and whether it would be necessary or adjust the application, distribute loads or replace the disk if their technology was outdated.
Finally, we will observe the amount of
available memory
on the application execution period.
https://qualidadeeti.files.wordpress.com/2015/11/image_thumb15.png?w=244&h=167
Note that in our measurements, the average of available memory on the server is 15 GB, or have enough memory on the server that has not been allocated, even with our application running.
Conclusion:
On the server resources, there is no bottleneck, we will then look at the part of the application process. If there was a bottleneck, we could use more specific counters such as disk writing time, measure each Core processor, but it is usually not necessary to enter this granularity.
We will now evaluate the Calculator process as an example:
https://qualidadeeti.files.wordpress.com/2015/11/image_thumb16.png?w=244&h=148
Collectors are:
Handles (Pointers) Processor Time, Thread Count, Private Bytes (Memory Usage)
Using the tips already mentioned above about Handles, processor time, memory use, we can see that the Calculator process is working properly, not featuring any apparent problem.
Final conclusion
We thus come to the conclusion using such counters, because we can answer:
Operating system behavior when your application is running;
In the above analysis, we see proper behavior at the level of resources by the operating system, without excessive consumption of them.
What are the ideal hardware, software, and configuration for your application to work properly;
At the time of measurement, performed various mathematical operations and realized that the average consumption of each item (CPU, disk, etc.) was X. If you want to know the ideal for my application, simply add the counters that need within the process, do the document issuing operations, management, etc. And then shot the average "Average" necessary and insert in my manual.
When there is slow if this slowness is associated with a bottleneck of resources and this bottleneck resources occurs due to low resource, concurrent use of other applications or mismanagement of their own use of resources.
No bottleneck problem has been identified.
When a malfunction of your application or server to identify if any of the resources are overloaded causing this malfunction.
All features, Handles, Memory, Processor agreed.