Working with Power BI Reports using Gateway and Direct Query
Introduction
The on-premises data gateway acts as a bridge, providing quick and secure data transfer between on-premises data (data that is not in the cloud) and Power BI. With the on-premises gateways, we can keep our data fresh by connecting to our on-premises data sources without the need to move the data. Without a gateway if we try to publish the On Premises report it will give us the below warning during report publishing. Though the publishing will succeed, the published report will not be able to connect to the on premises data source.
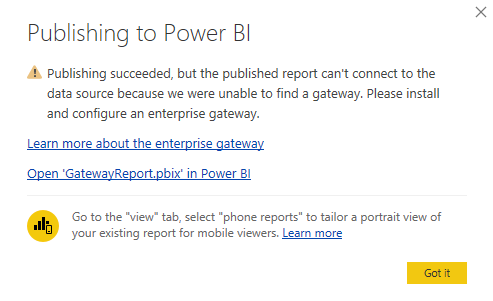
However if we have a gateway in place, the published report will be able to use the Enterprise Gateway to connect to on premise data source and create live reports.

In this demo we will see how to connect to On Premises SQL Server using Gateway and create Power BI reports using Direct Query live connection. We will make use of the below CarSales table to create the Power BI report.

Create Data Gateway
By default, there won’t be any Gateways created. If we sign in to Power BI online and go to the Data Gateway section, we will get the below warning.

So as the first step lets create the Data Gateway from Power BI Online.

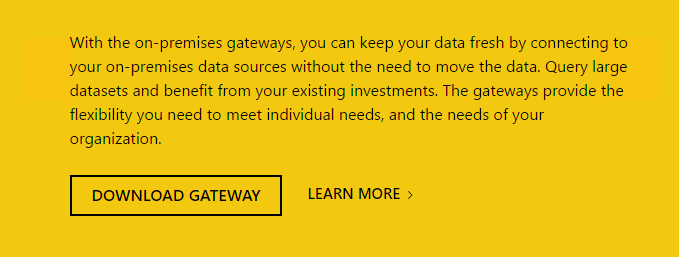
Select Data Gateway option which will take us to the Gateway downloader page. Select Download Gateway option.
It will start the download of the installer. Once the download is completed, run the installer.

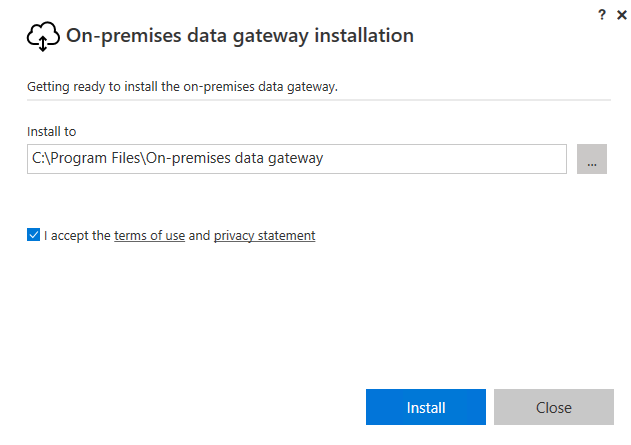
Choose On Premises Data Gateway option and proceed.

This will prepare the installation of the Data Gateway.

Ensure that the Gateway is being installed in a computer that will be up without downtimes as the Gateway acts as the bridge to our data source and installing it in a computer with downtime means the report rendering will be disturbed during downtimes.

Accept the agreement and proceed.
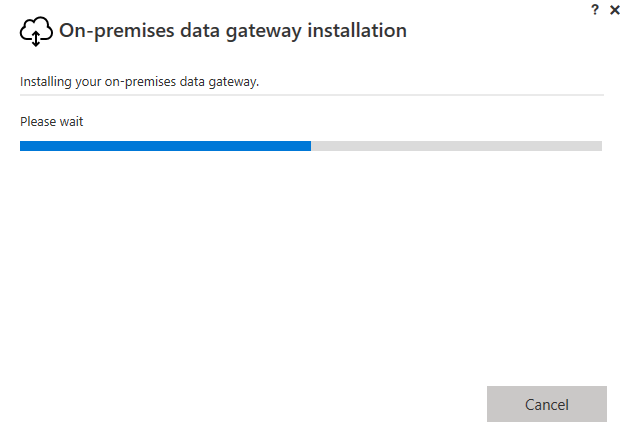
This will start the installation of the Power BI Gateway in the computer.
Once the installation is done we have to associate our Power BI account id with the gateway.
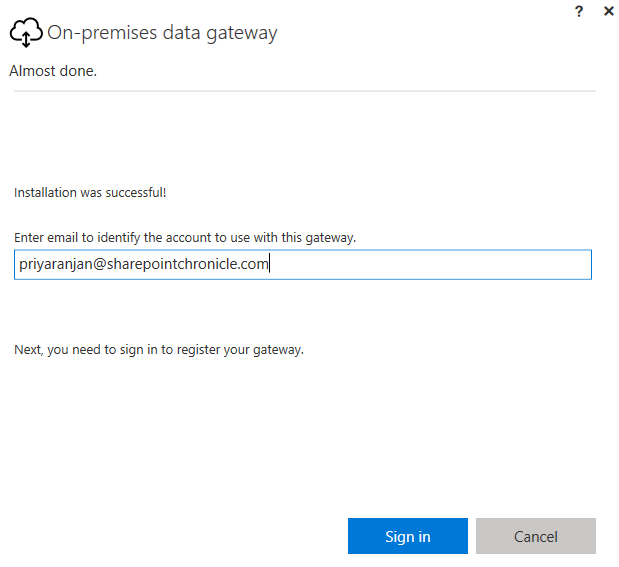
Click on Sign in and we will register the gateway. Specify a name for the gateway and mention a key which will be used to restore the gateway. Finally click on Configure to complete the registration of the Gateway.

Thus we have completed the configuration and registration of the gateway.


If we head over to the Services.msc we can see that the gateway service is up and running. Now lets head over to the Power BI Online Service.
Add DataSource
Once we have logged in to Power BI Online, we can manage the Gateway from the below option.

It indicates that the Gateway is Online. We can add the datasource to which the gateway should connect by selecting ‘ Add data sources to use the gateway’ option.

This will take us to the tab where we can specify the Data Source Details.

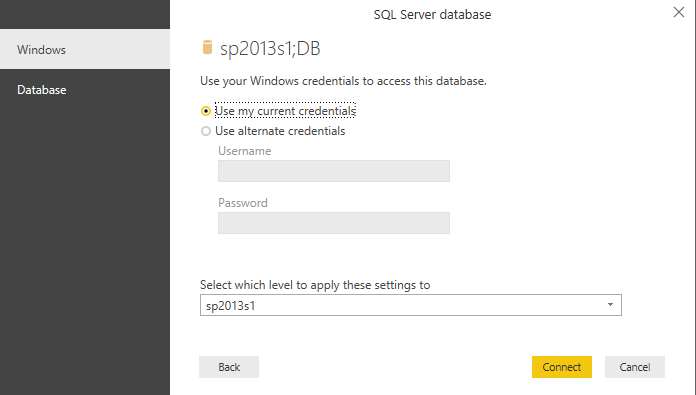
Since we are connecting to the SQL Server table, specify the SQL Server details which will be used by the gateway to connect to the database.
Specify the authentication method as Windows and specify the credentials that will be used to access the database.

After clicking on Add which will add the data source, go to the users tab to add users to this data source.

Specify the email address and click on Add to provision new users who can use this data source and publish reports to Power BI Online.

Create Power BI Reports
Now lets head over to Power BI Desktop and create reports by making use of SQL Server table data.

Select Get Data option to connect to our data source. Select SQL Server Database category and click on Connect.

This will open the window where we can specify the Server and Database details. In the Data connectivity mode ensure that we chose Direct Query as it will use Gateway to fetch the real-time data to create reports.

We can either use current credentials or specify an admin account to access the database.
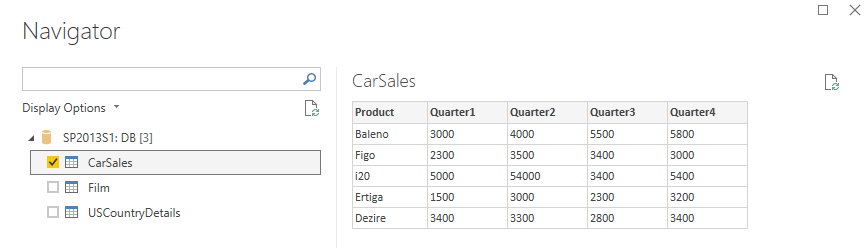
On clicking connect it will connect to the database and fetch the tables within the database. We will be making use of the CarSales table to create the report, Select ‘CarSales’ Check box.
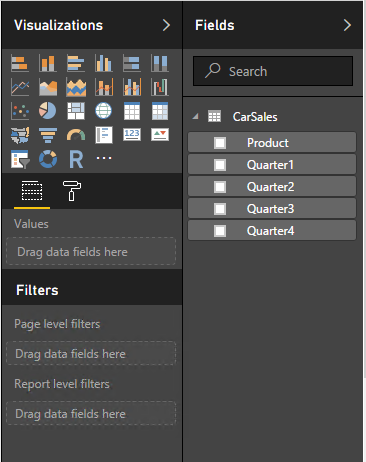
It will show the columns from the table using which we can generate the reports as well as the various types of graphs to render the table data.
We will go ahead and chose the bar graph and drag/drop Product column to ‘Axis’ section so as to plot against the X Axis. We will then move the columns to ‘Values’ section so that they are plotted against the Y Axis

Finally, the report has been rendered as shown below as a bar chart. We can convert it to various other charting options.
Publish the Report
Once we have completed the report we can publish the report online. Select the location to where the report should be published.

This will start the publishing of the report to Power BI Online.

Finally the report has been published and it will use the Enterprise Gateway which we had configured earlier to connect to the data source.

Test the Gateway
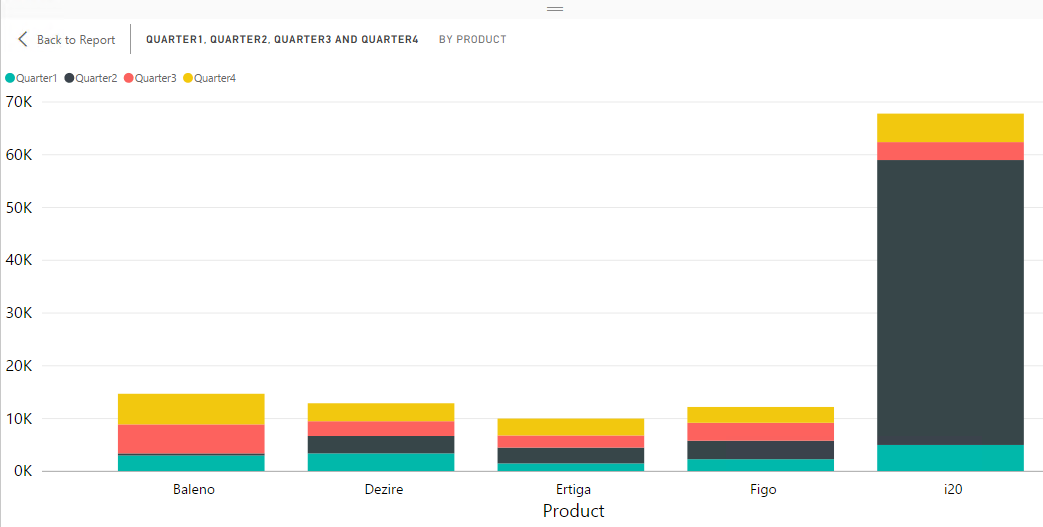
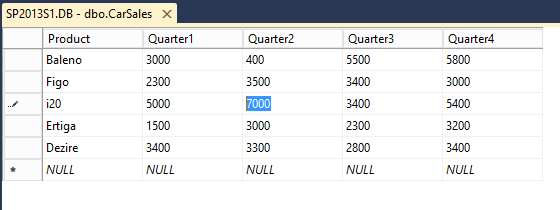
Once we have published the report to Power BI Online, we can see it from the Online Power BI Service. We will try to change the i20 Quarter 2 Sales Values from 54000 to 7000 in the SQL Server Data Source and see if the change will get reflected in the Power BI report through the Gateway.

Let’s change the value in the SQL Server table.
On a refresh we can see that the Power BI report values has also been changed to the new value which was possible due to the existence of the gateway.

Remove Gateway
In case if we want to remove the gateway we can do this from the Power BI Online Service. From Manage Gateway window select the Gateway which we would like to remove.

It will show the warning that the removal will affect the existing reports as we are removing the bridge connection to the data source. Click Remove only if we are so sure about the removal of the gateway.

Summary
Thus we saw how to create a Gateway and connect to the On Premise data sources and create reports using Power BI.