Azure ML Studio: A Quick Start
For those who don’t know anything about machine learning, it’s a hot trending technology domain. From classification of emails, sentiment analysis to visual recognition and much more, machine learning helps everywhere.
Microsoft provides ML Studio as one of the SaaS applications on Azure platform. The important question is why we should choose Azure ML Studio instead of traditional solutions such as R, SAS, SPSS, Python, etc. A major strength of Azure ML Studio is that it not only gives support for old tools (R, Python) but also has a graphical and highly customizable environment where we can perform very daunting tasks by just few drag & drops. It contains industry-recognized world-class algorithms.
We need to have an Outlook / Hotmail account. Sign up for Azure ML studio here.

After clicking “Sign up here”, we’ll be asked to choose our subscription plan.

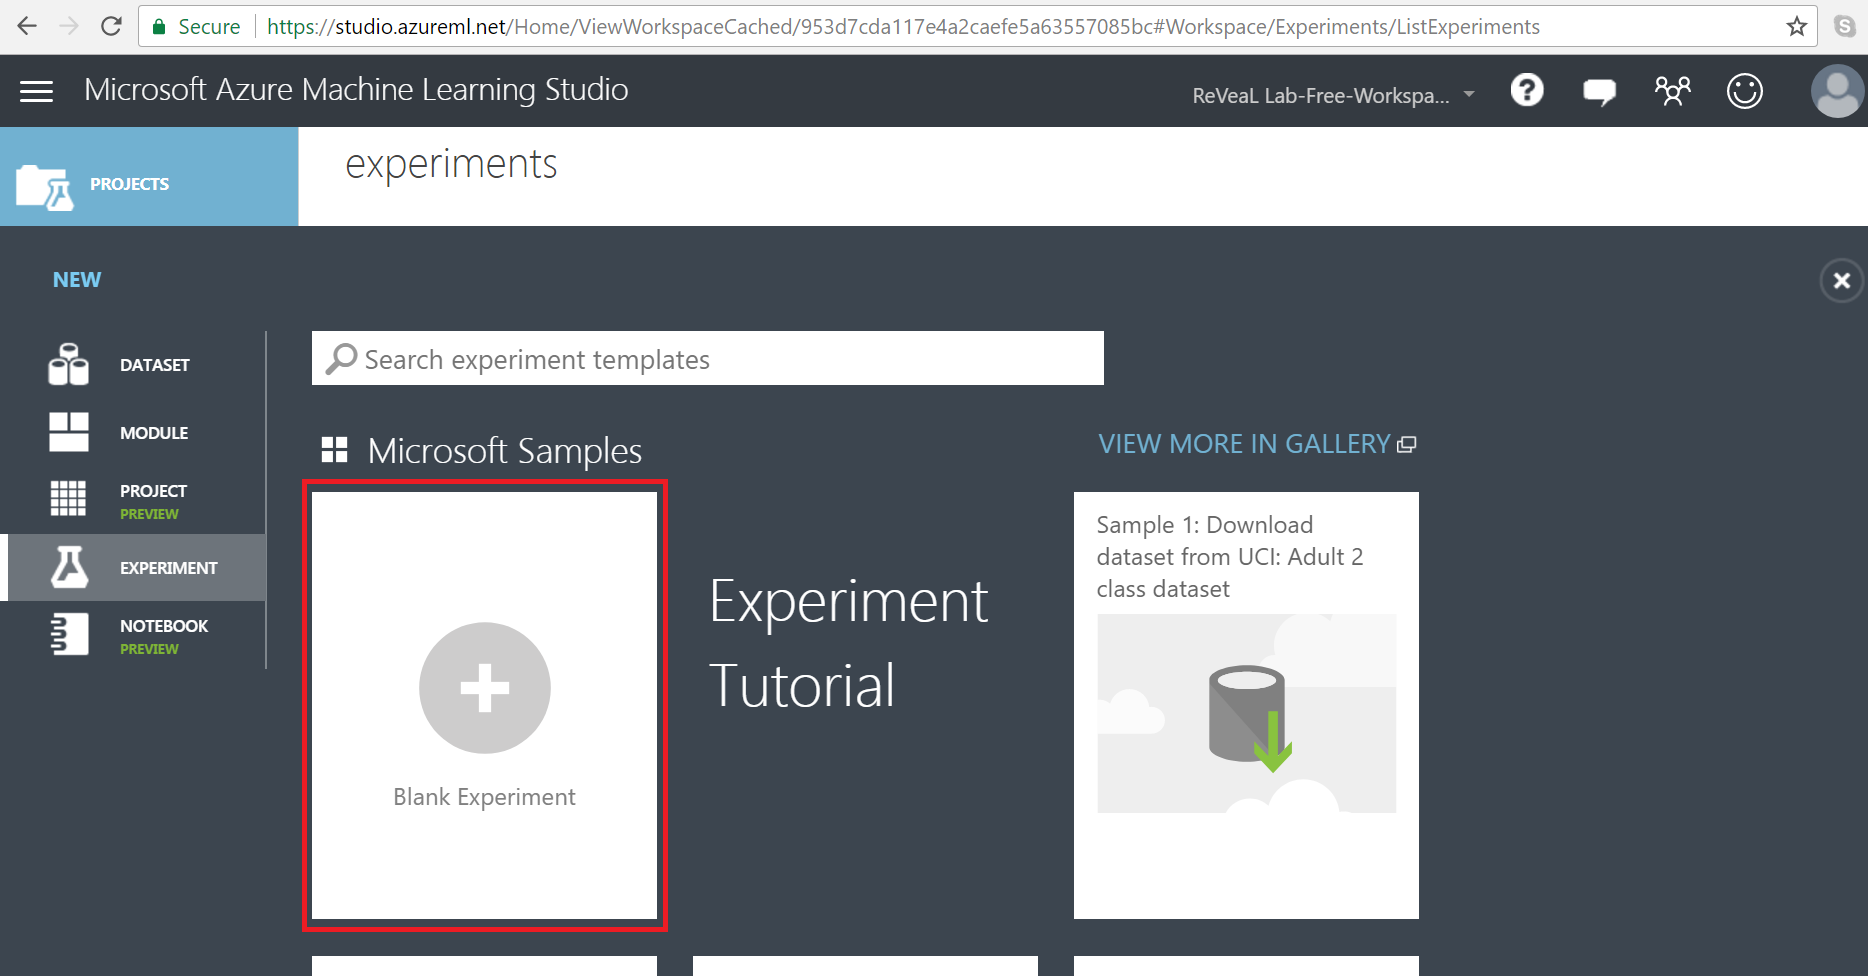
Choose the “Most Popular” free plan by clicking “Sign In” and you’re done. After signing in you’ll be directed to ML studio workspace. Let’s create a simple experiment to get familiar with the workflow of ML studio. Choose “EXPERIMENTS” from the left panel and click on “+ NEW” sign on the bottom left.

Here we can see many amazing experiment templates which we’ll be seeing in later posts. For now, choose “Blank Experiment”. After creating the experiment, we’ll notice a simple how-to tutorial drawn on the workspace.
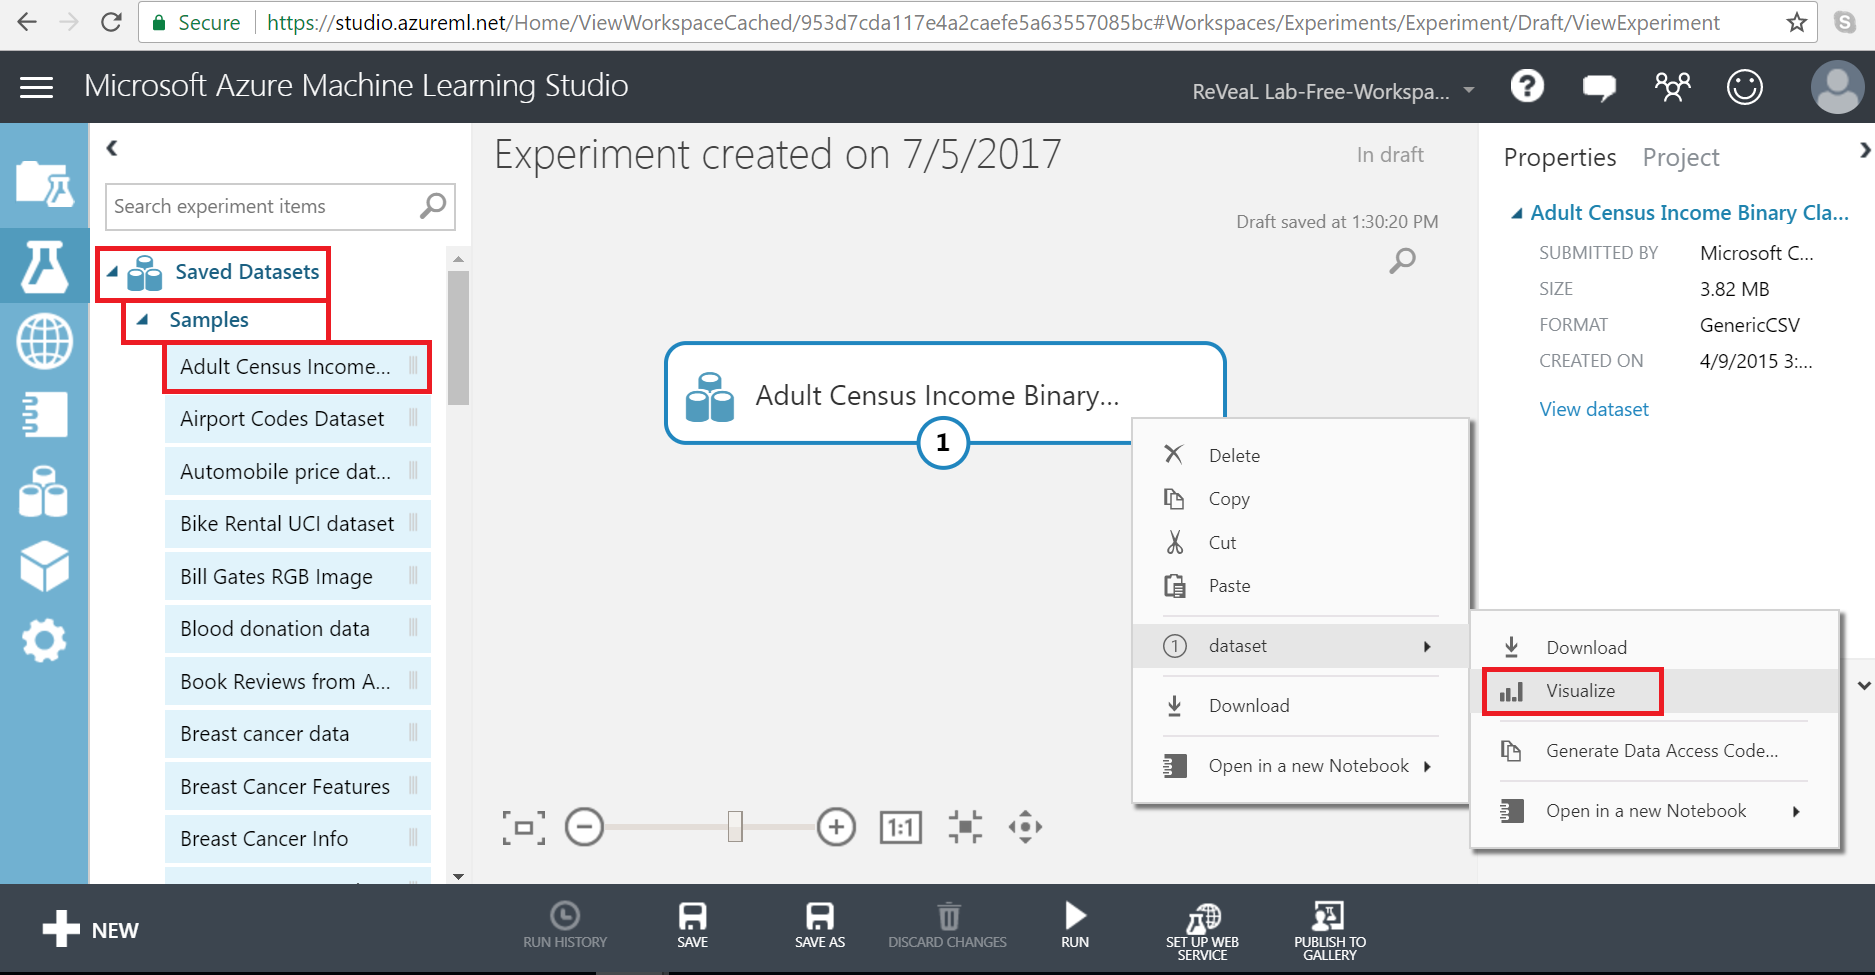
Now we’ll just simply drag a dataset and perform a quick descriptive analysis on it. On the left panel, click “Saved Datasets” -> “Sample”. We’ll see there are many datasets available. Click and drag any dataset to the workspace. We can visualize this dataset as well as shown in the picture below.
Here is the visualization of our dataset.

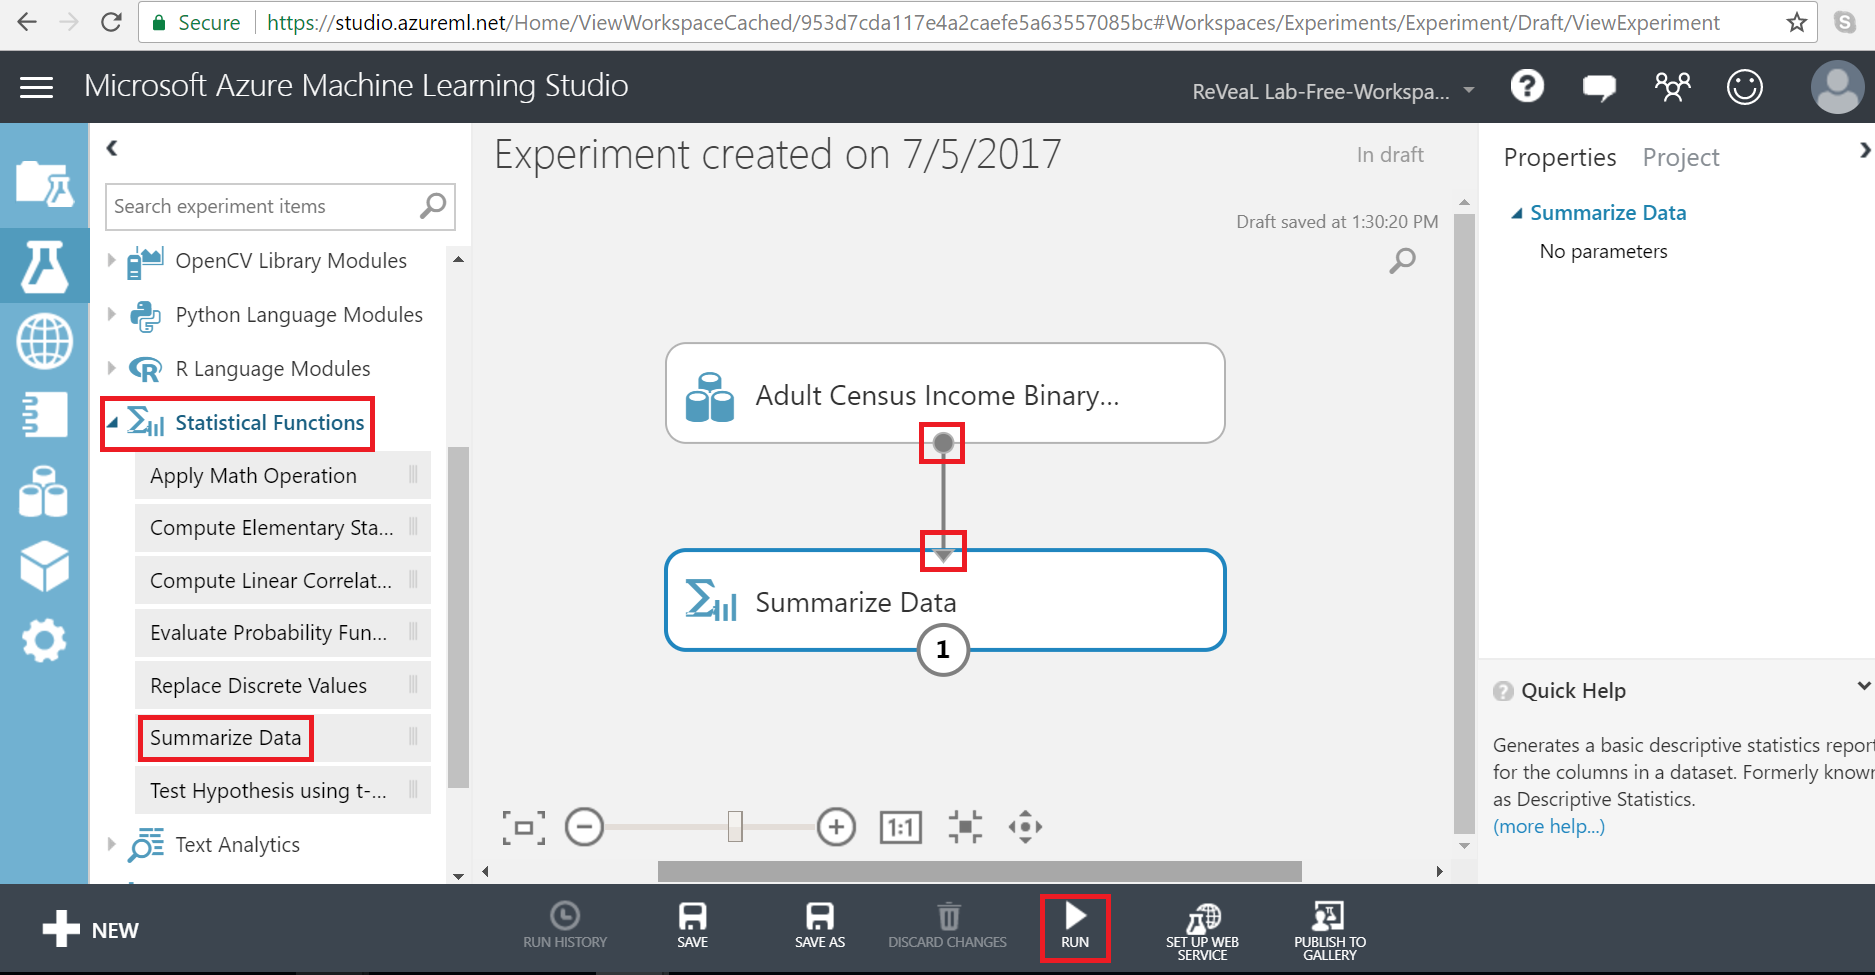
Now add another module for descriptive analysis. Drag and drop “Summarize Data” from “Statistical Functions”. Now connect the output port of our dataset to the input port of our statistical module. Then finally run the experiment using the button in the bottom bar.
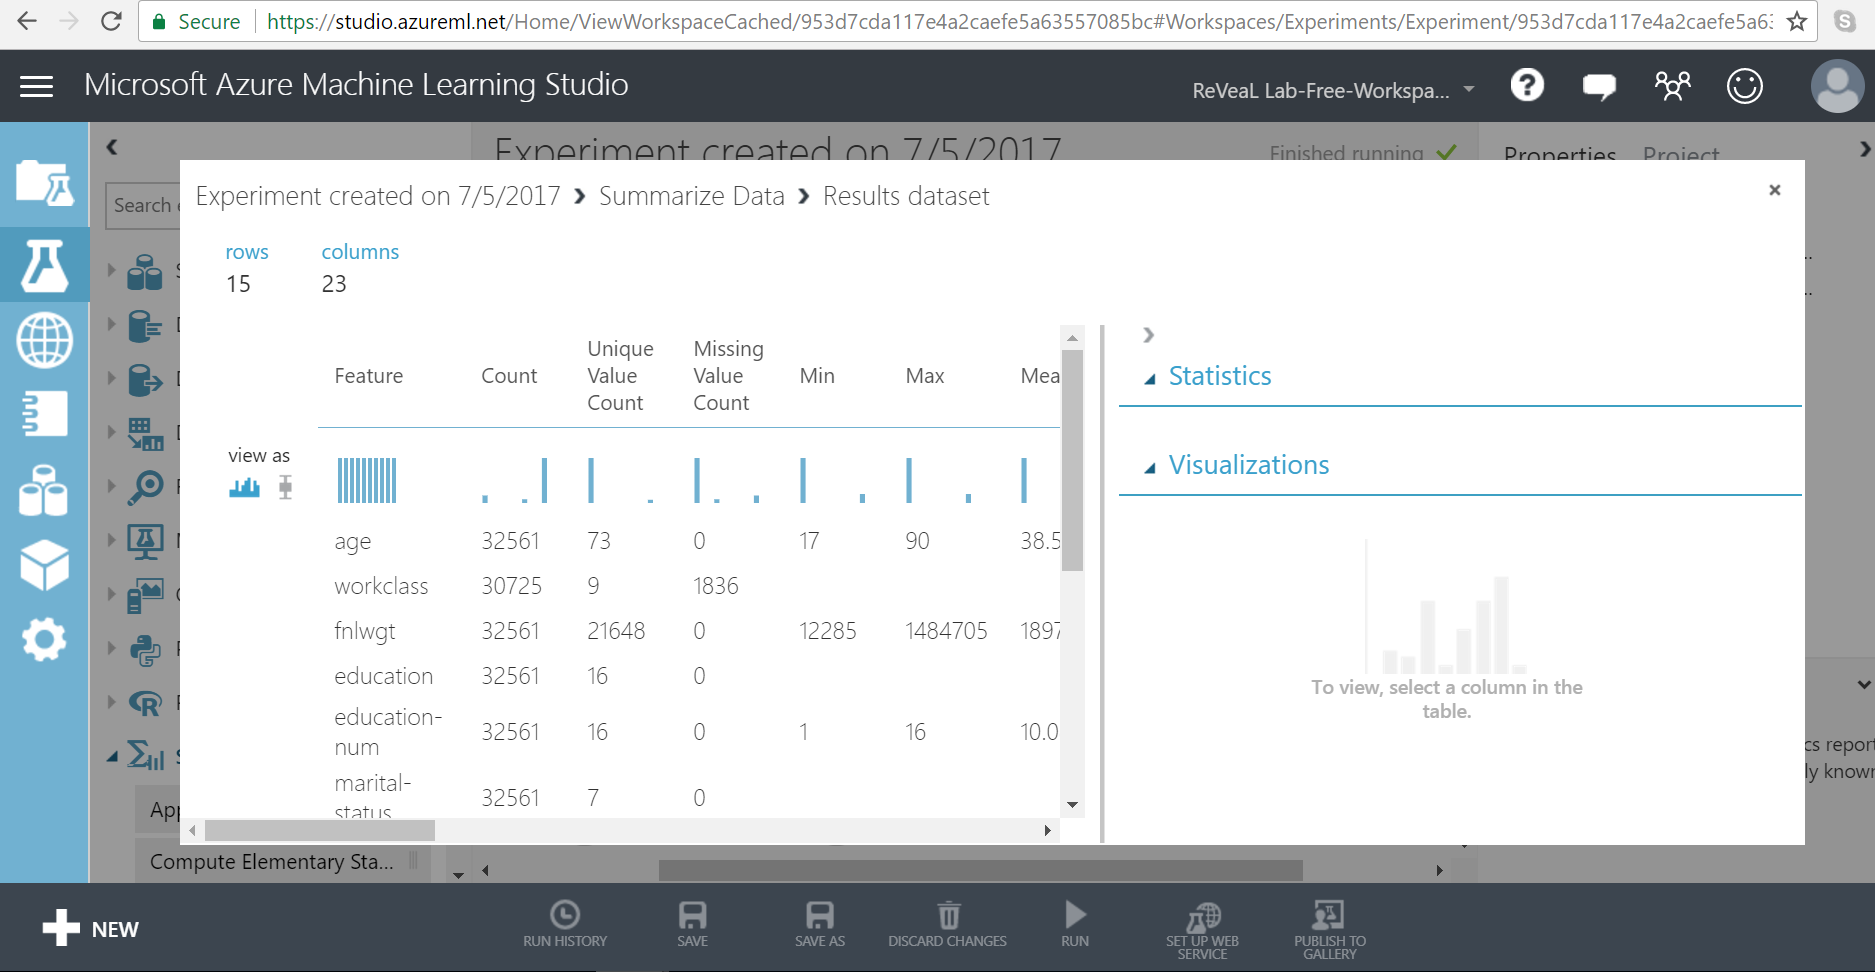
After the experiment is finished running, we’ll notice a green tick sign in front of the selected module. Now right click this and again visualize the data as shown in the picture below.

Here you can see complete statistics report of your data which include quite significant measures such as missing value counts, min, max, etc.
In this post, we’ve set up a simple experiment in just a few clicks. Further, we’ll create more useful experiments with ease and power of ML Studio.
See Also
Another important place to find an extensive amount of Cortana Intelligence Suite related articles is the TechNet Wiki itself. The best entry point is Cortana Intelligence Suite Resources on the TechNet Wiki.