Azure Databricks: How to Get Started to Work with Data
In this article I’m focusing on How to create a notebook and start to execute code against uploaded dataset on Spark cluster. If you are new to Databricks, always recommended to read previous tutorials, how to get started with Databricks by creating workspace and how to create a spark cluster.
For this tutorial I’ve taken famous Titanic Training dataset from Kaggle. Kaggle is a place you can do data science projects. So, Titanic Machine Learning from Disaster is one of the competition where you can predict survivals based on various attributes. (Remember, this is not a ideal candidate for demonstrate capabilities of Spark. Spark is designed for Big Data processing. This dataset is very small one. Purpose is to just demonstrate how to work with data)

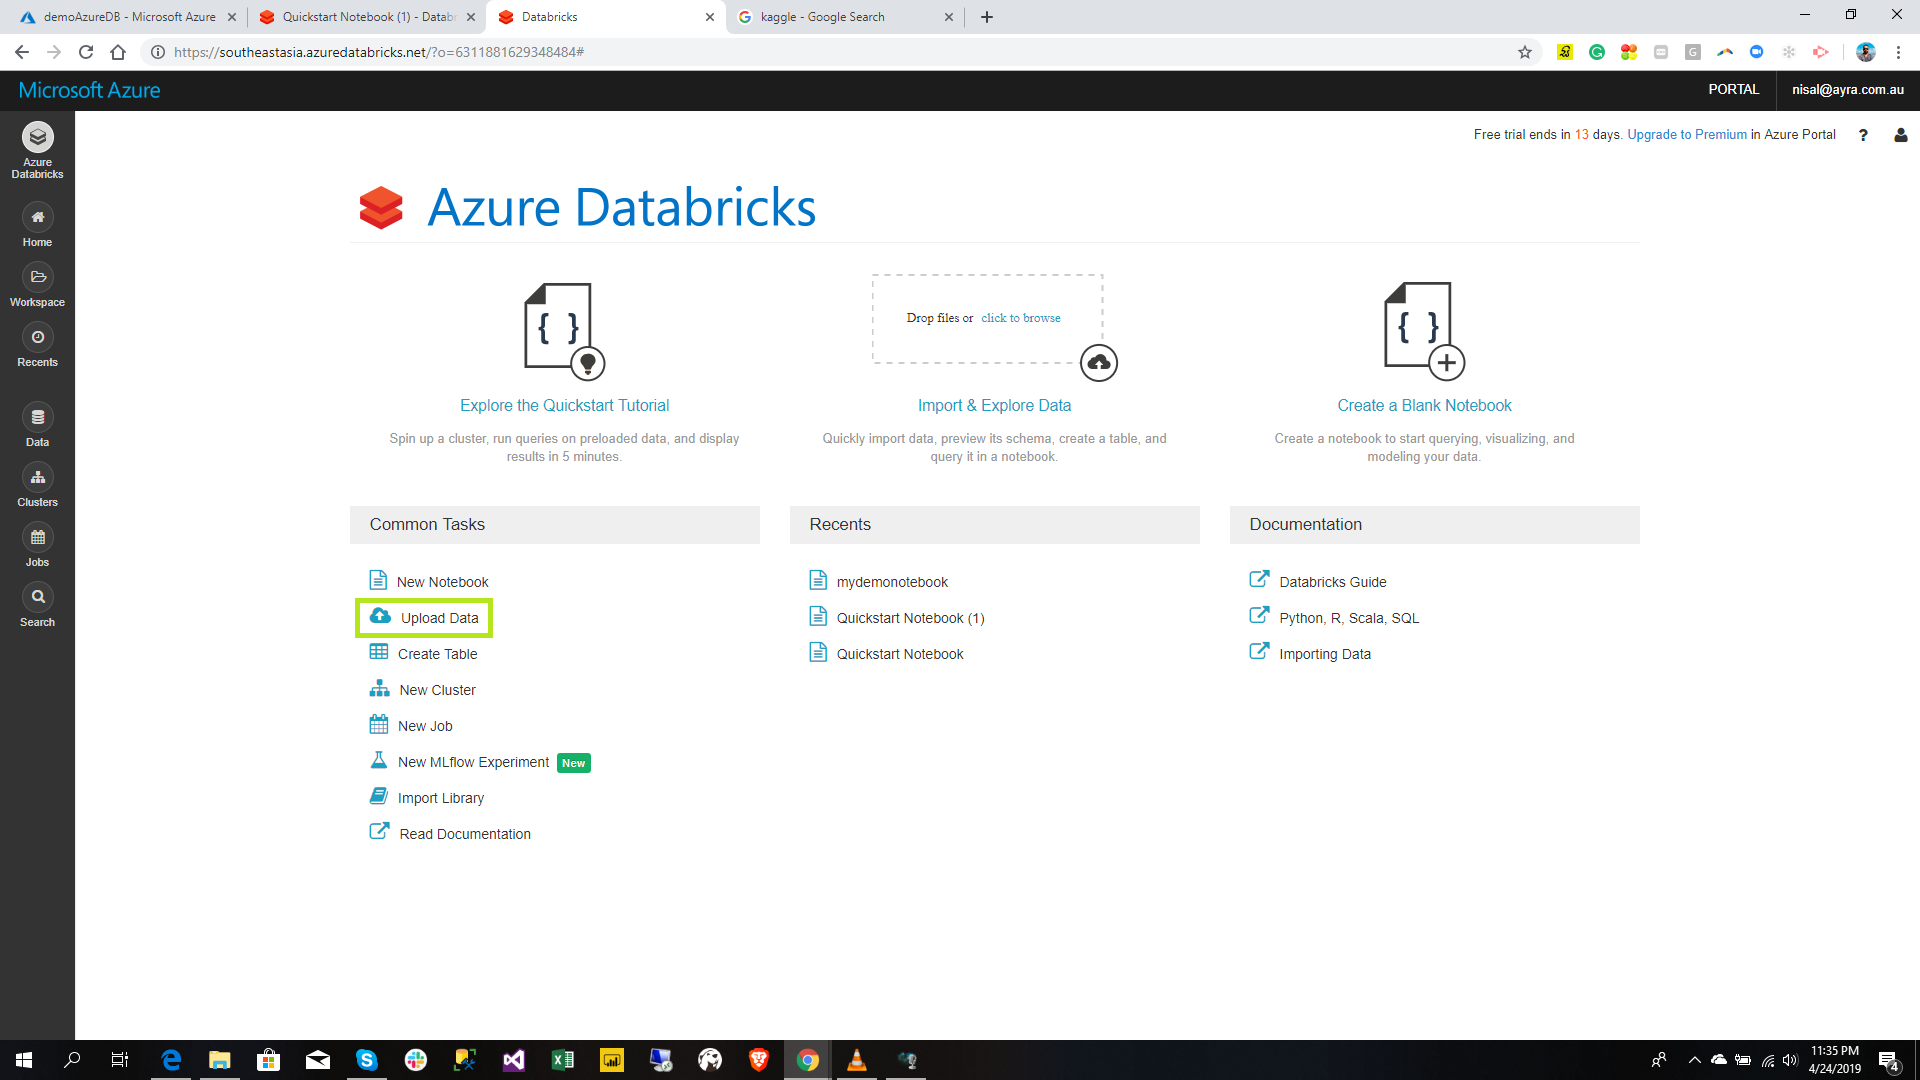
Upload Data
Click the Upload Data button in the home page in order to upload data into databricks. (remember this is not the only path you can upload data into databricks. Refer my previous article. Walkthrough on Azure Databricks)
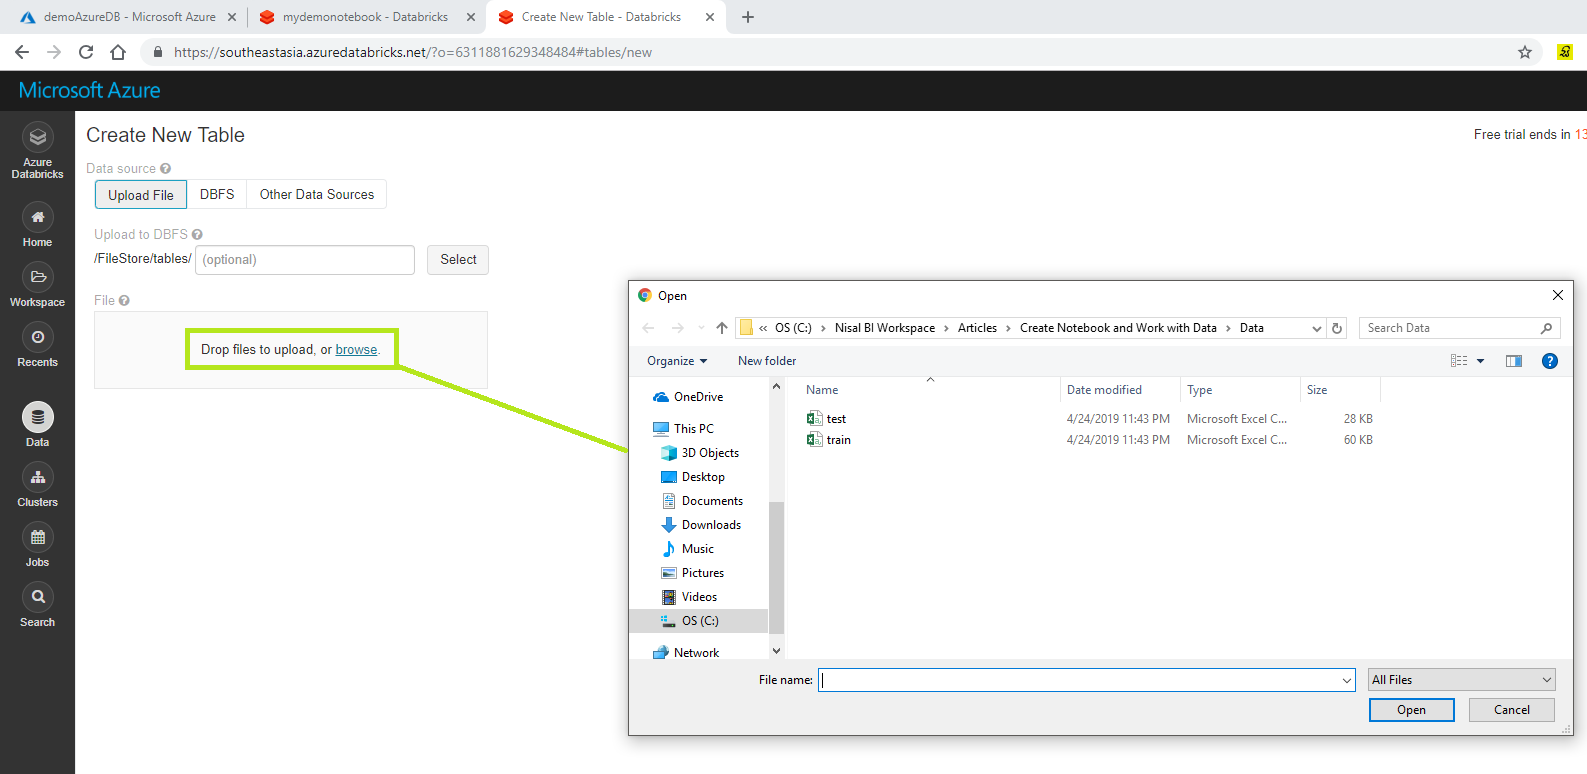
Click the browse and provide your local file location.
In order to verify click the DBFS tab and browse your data file you just uploaded.
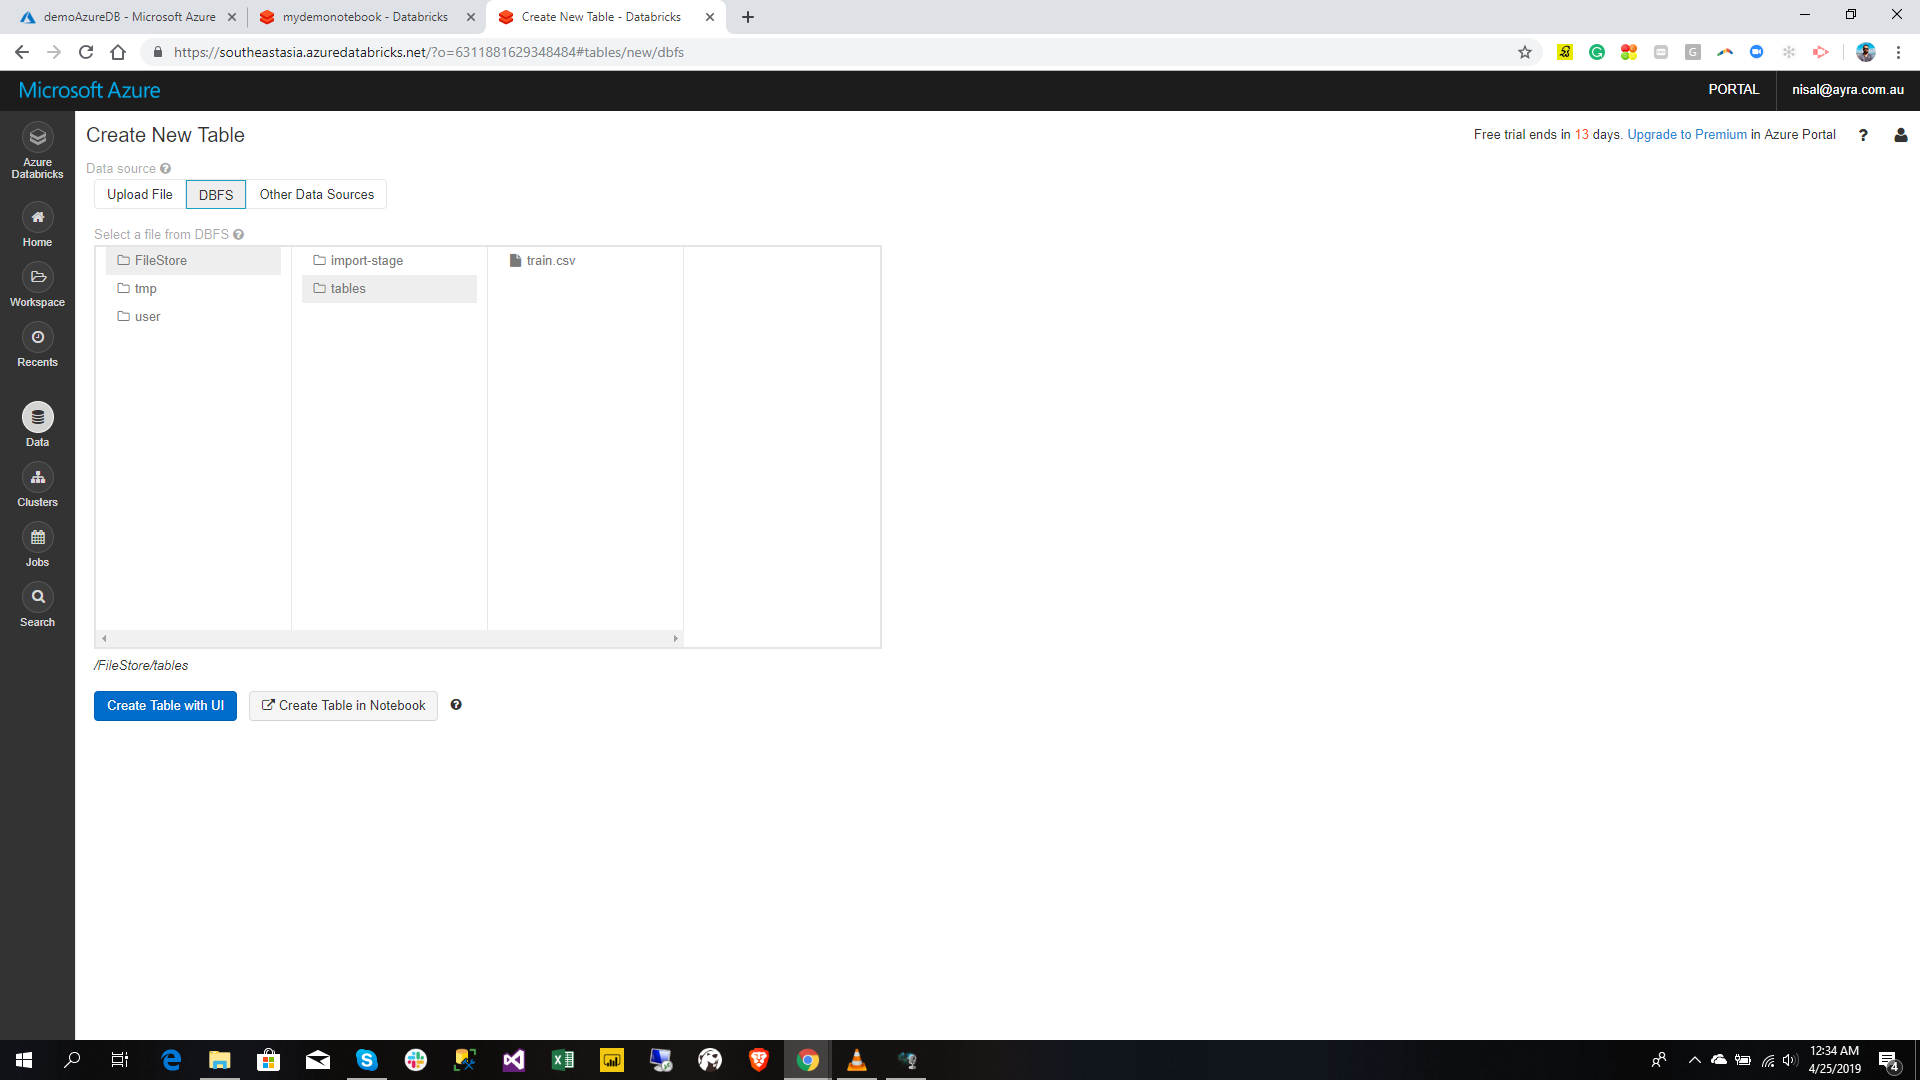 You have successfully uploaded the data. Create a Notebook
Click the New Notebook in the home page as in below.
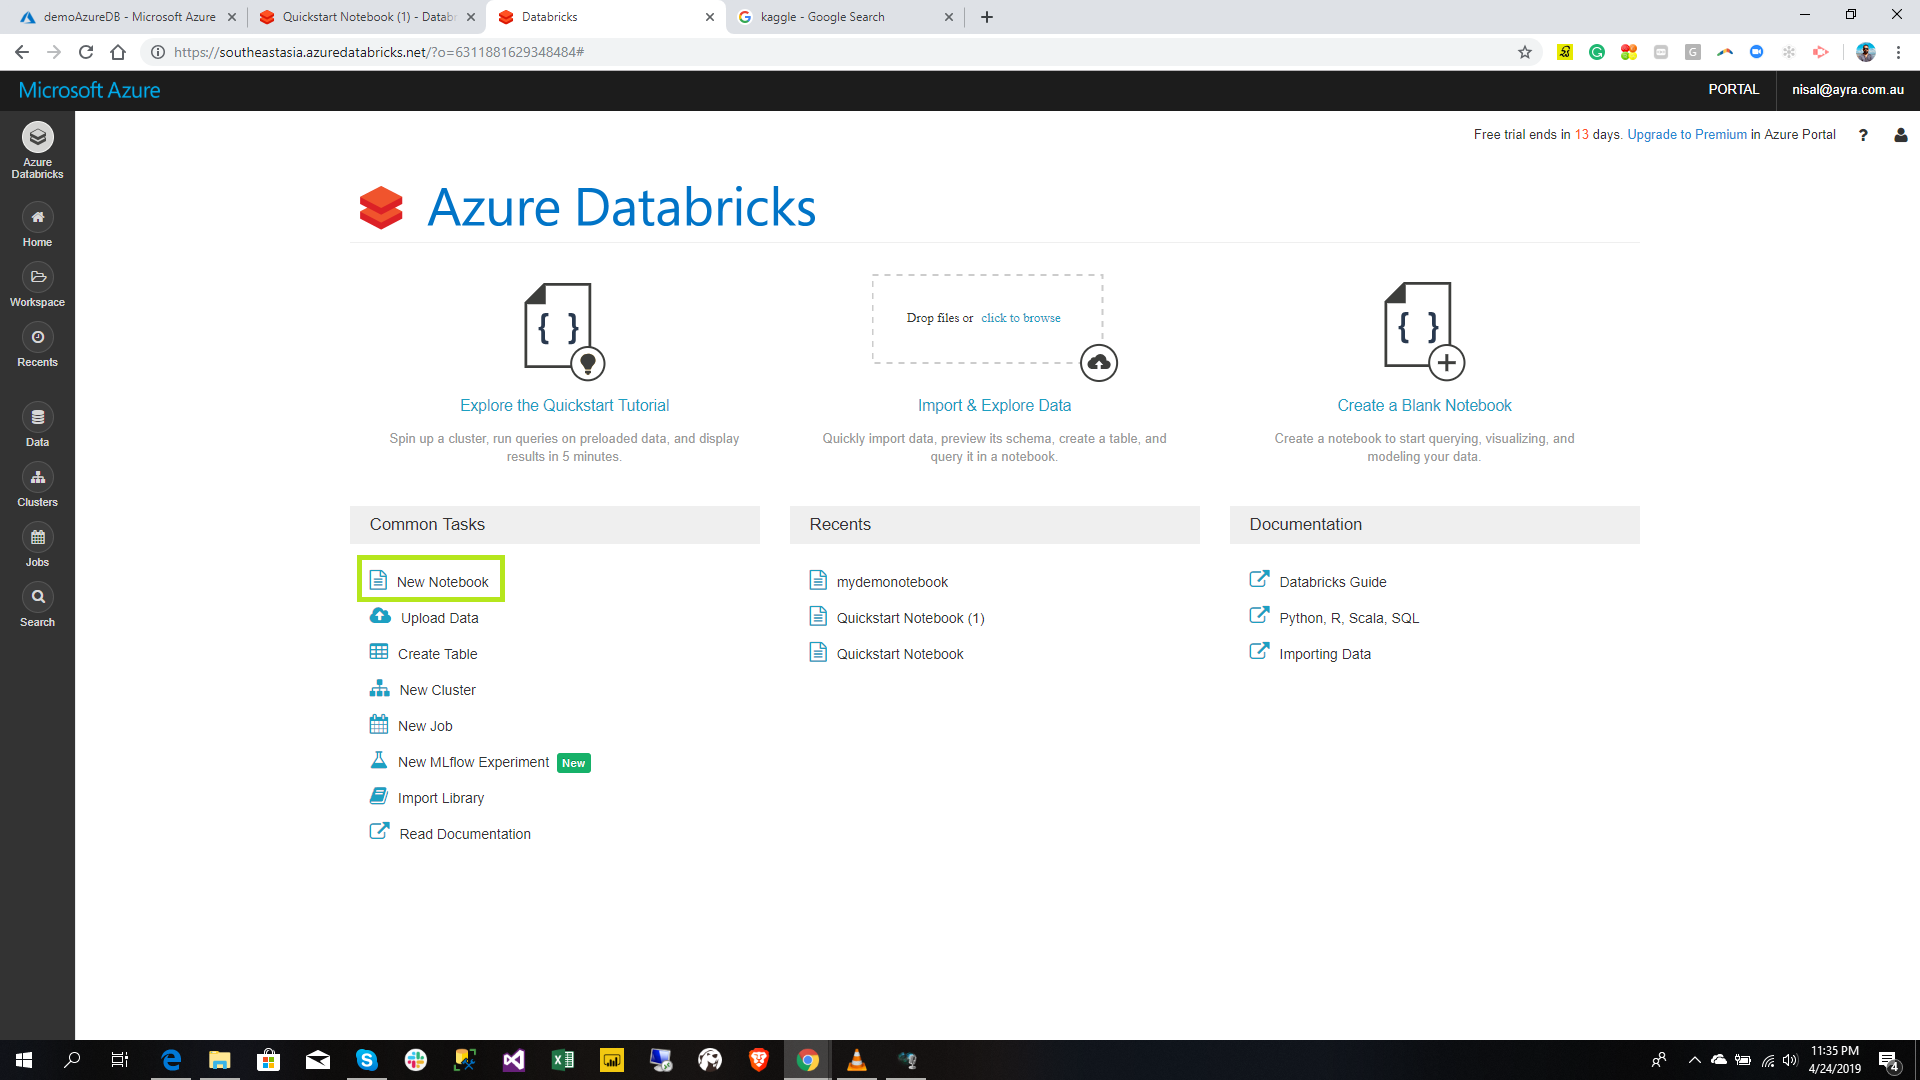
Then give the Notebook name as you preferred and select the language. In here I select SQL as my language which I need to create my notebook. Since I already created a cluster and also that is the only cluster which is already selected. 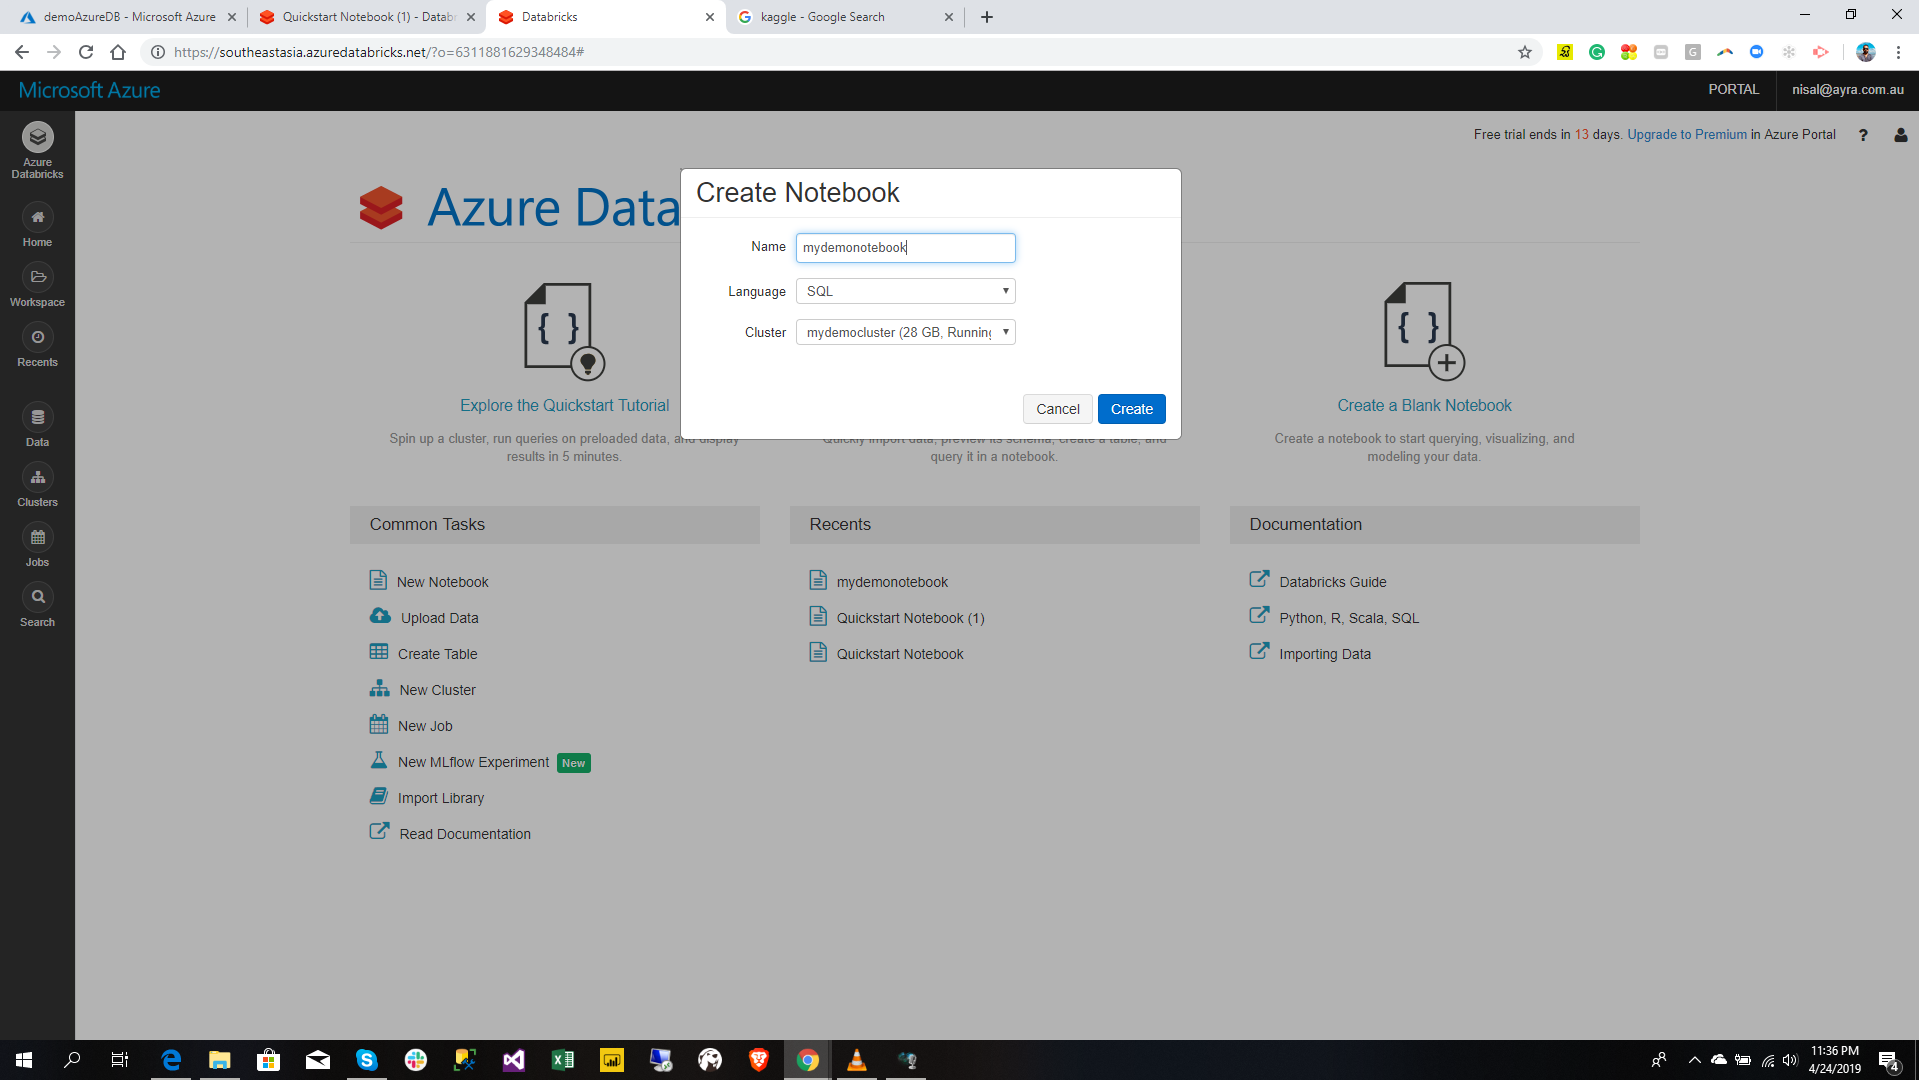
Click the Create button in order to create notebook.
Analyze Data
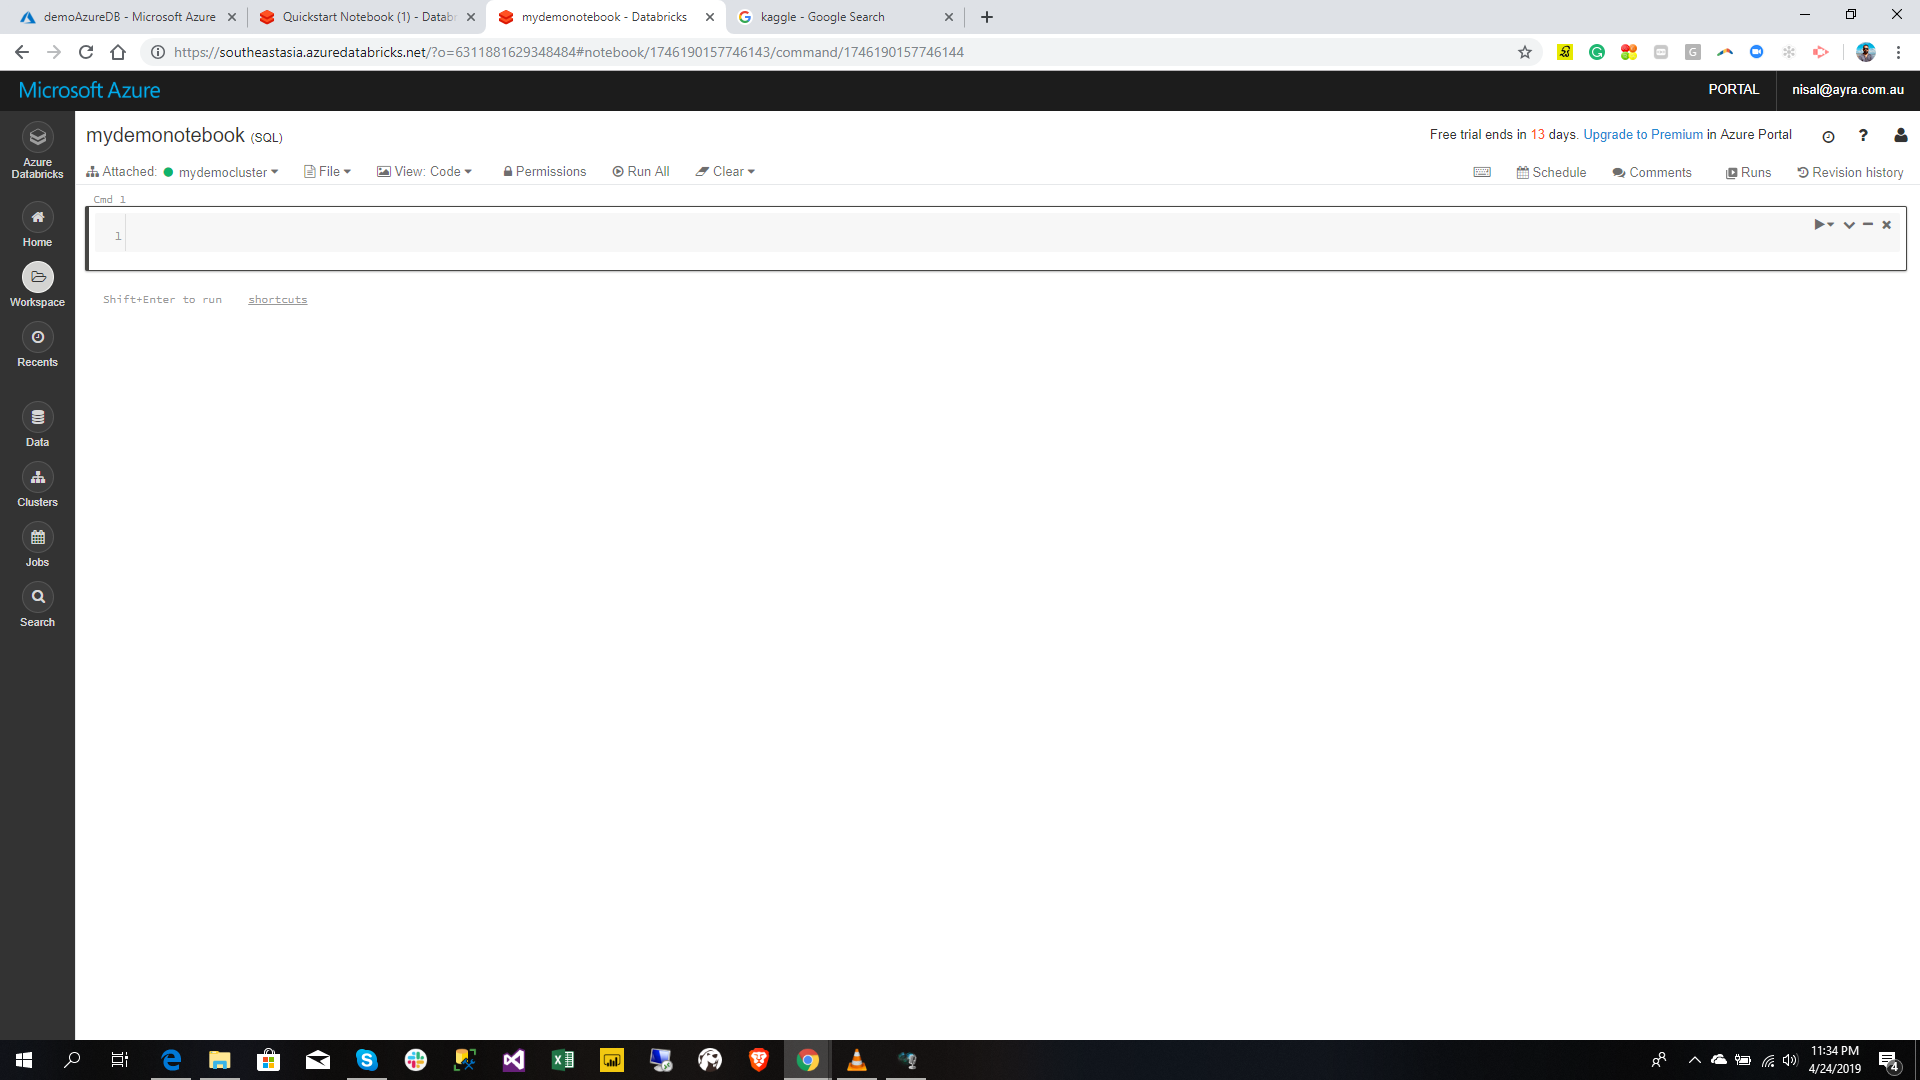
Once you created the notebook in the previous step, now it is time to analyze data.
1. Import CSV Data
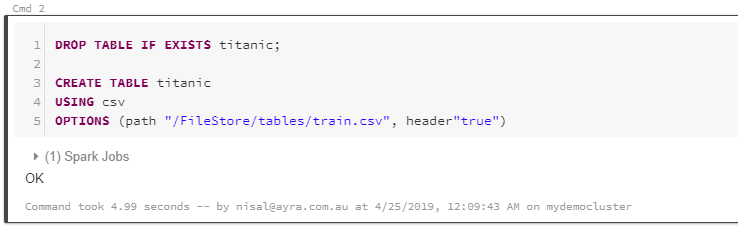
In this step you are going to import Titanic train csv data and create a table using it
1.DROP TABLE  IF EXISTS titanic;
2.
3.CREATE TABLE  titanic
4.USING csv
5.OPTIONS (path "/FileStore/tables/train.csv", header"true")
Once you run the code if will get the Spark Jobs status = OK as below
2. View Data
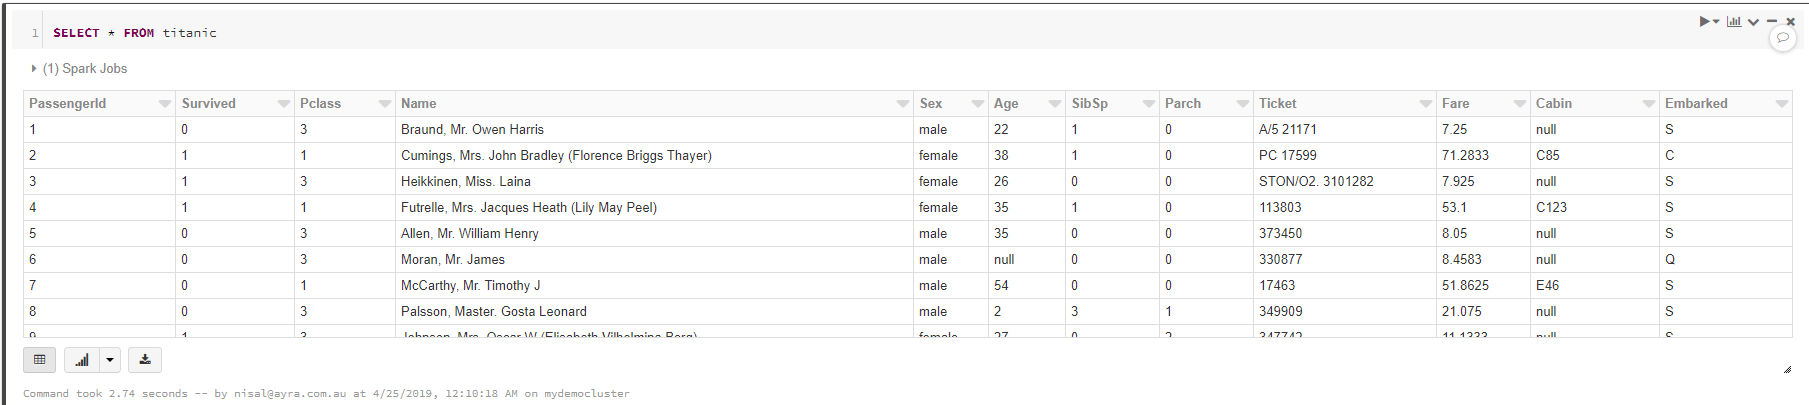
In this step you are going to view the data from the table you created in previous step.
SELECT * FROM titanic
3. Analyze Data, Survival Age Range Against Class
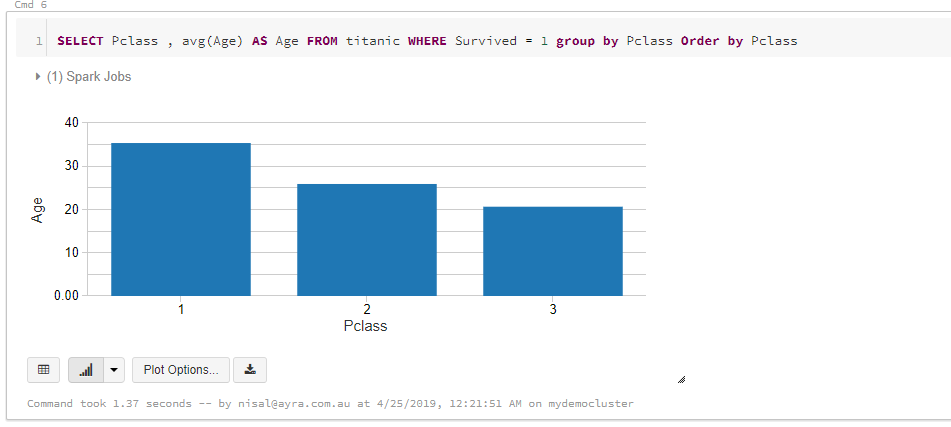
It is important to understand about the survivals, in order to predict what sort of people were likely to survive. In this step we query the average age against the Class. The reason behind this is to get some understanding whether they gave priority to specific age range and Class.
SELECT Pclass , avg(Age) AS  Age
FROM titanic
WHERE Survived = 1
GROUP BY Pclass
ORDER BY Pclass;
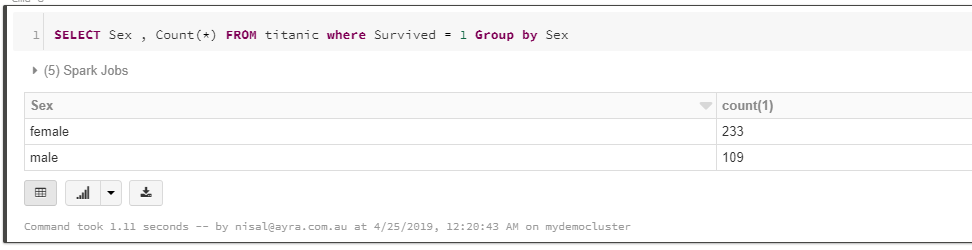
4. Analyze Data, Survival Count based on Sex
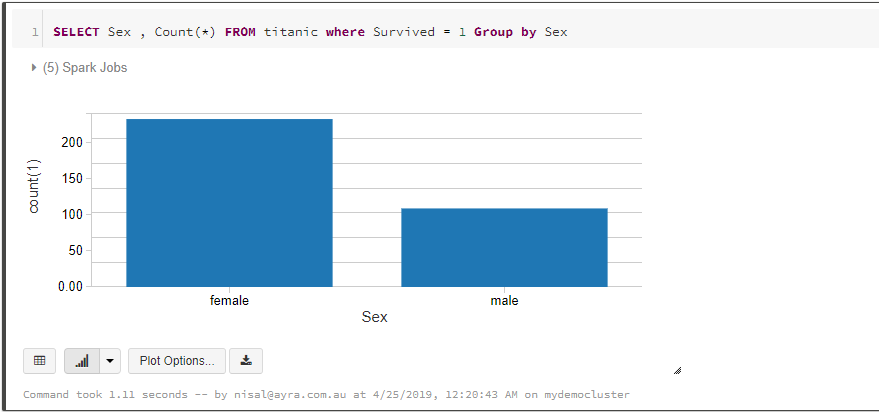
In order to predict what sort of people were likely to survive. In this step we query the survival count against the sex. Then we can get some understanding they have given the priority to gender or not for passengers
1.SELECT Sex , COUNT(*)
2.FROM titanic
3.WHERE Survived = 1
4.GROUP BY  Sex
You can change the chart type in the bottom dropdown. There are around 10+ visual types. You can change it at anytime into appropriate visual type
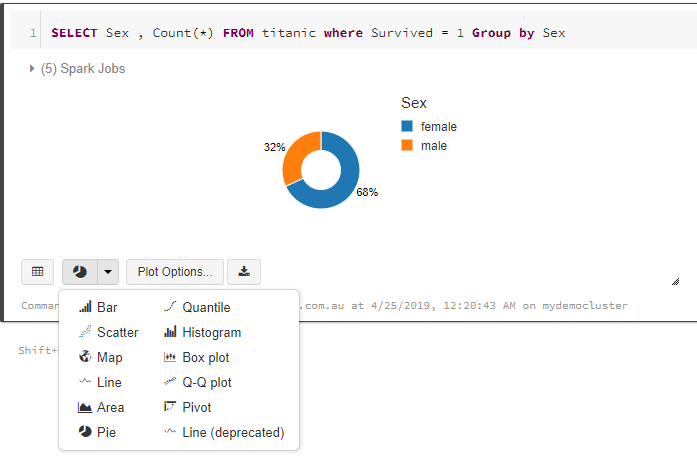
There is another button called plot options. If you are familiar with any charting visual tool like Excel, Power BI this will be familiar experience for you. 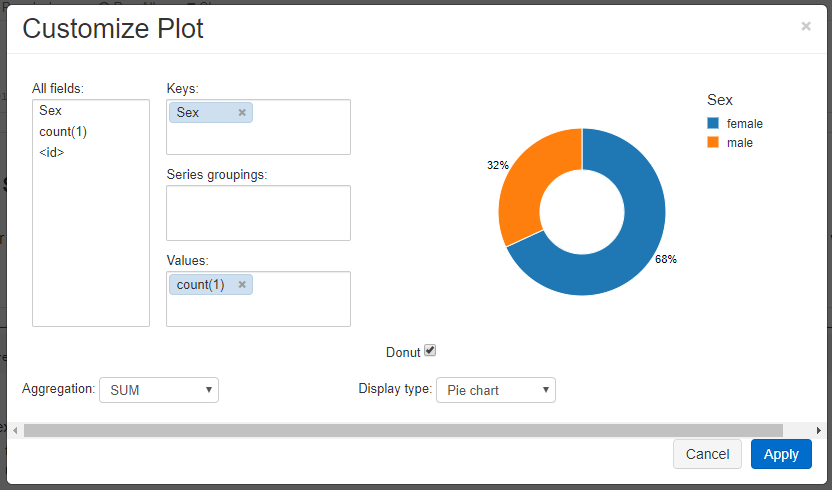
**You can turn the visual into Raw Table at any time by clicking Raw Table option.
 **
**
**
**
Summary
**
**
In this tutorial I’ve explained how to upload data into Azure Databricks. Then moved to create a Notebook and import the uploaded data and created a table. Later in this article I’ve done some queries to analyze the dataset. Hope this helped you to get started to work with Databricks.