ASP.NET Core Blazor: Draw Dynamic Bar Chart using Canvas Extensions
Introduction
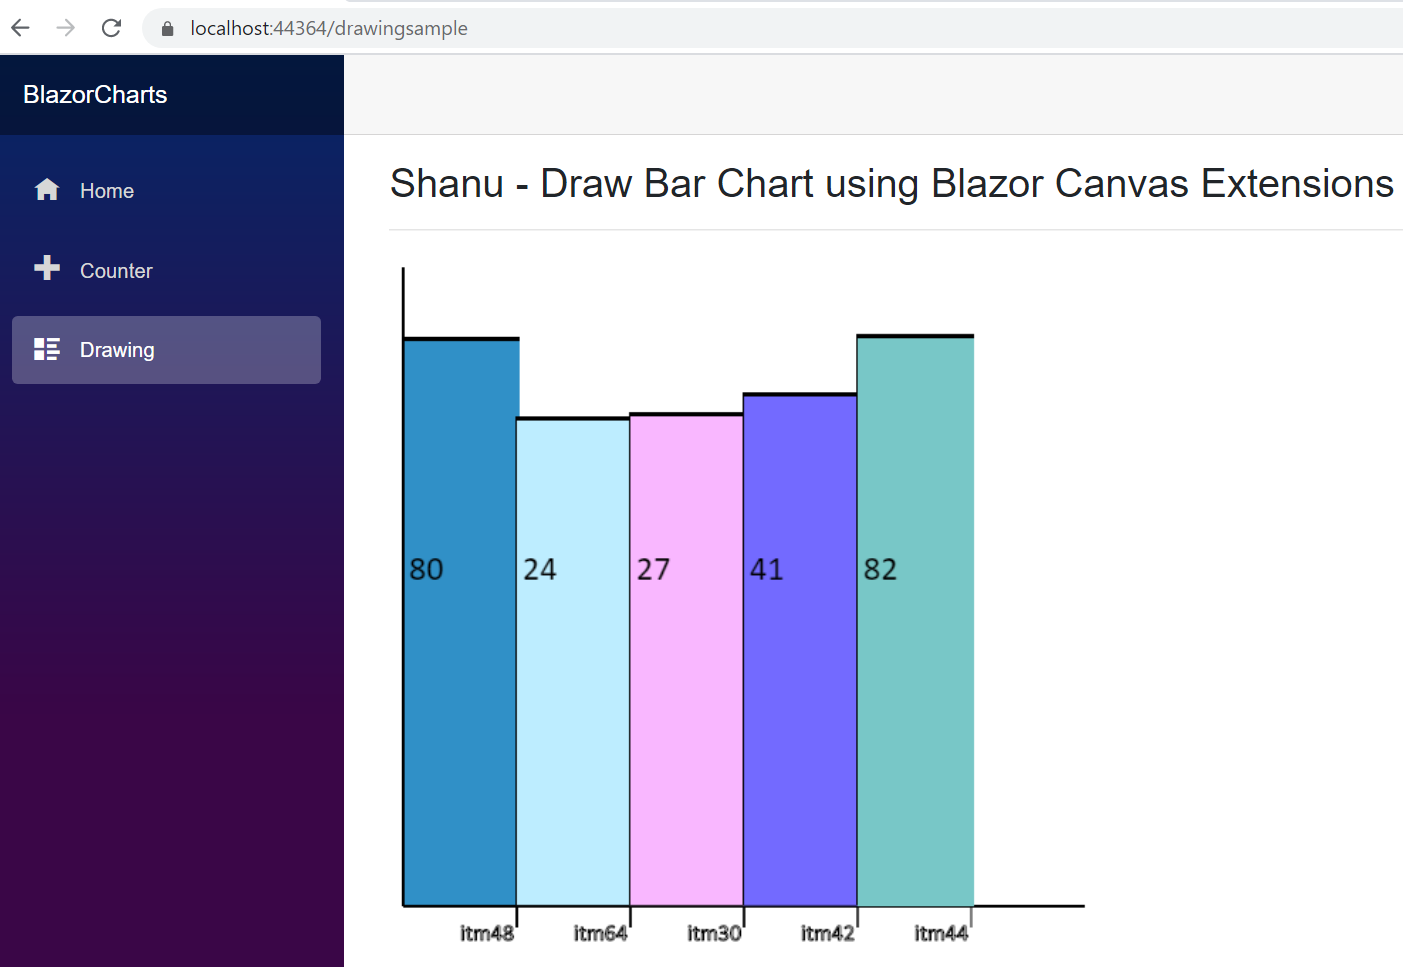
In this article we will see in detail on how to draw our own bar chart for ASP.NET Core Blazor Web Application using HTML5 Canvas Blazor Extensions.
Prerequisites
Create ASP.NET Core Blazor Server Application
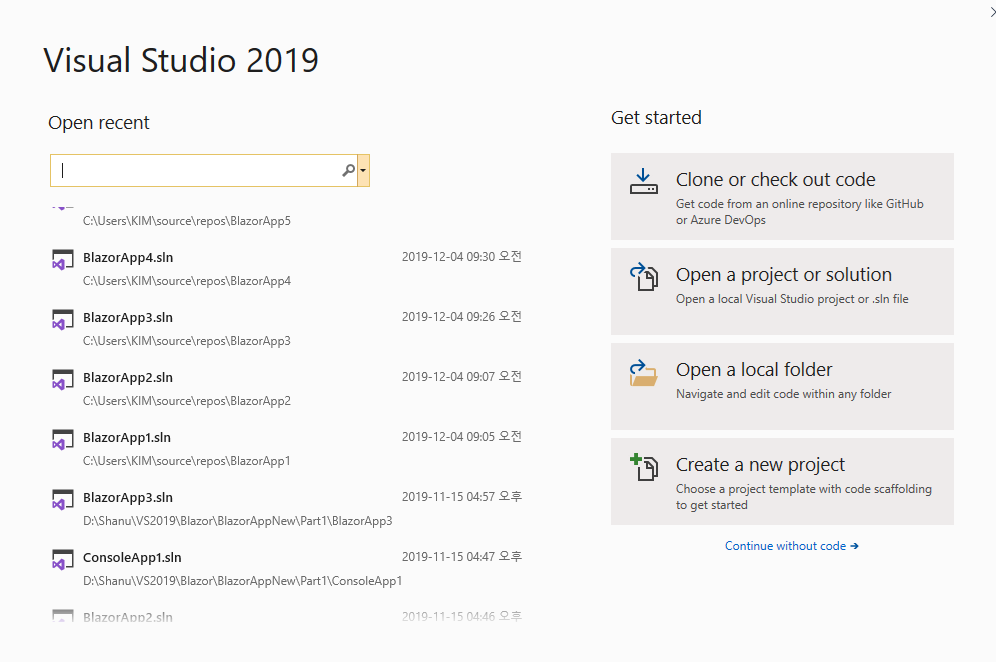
After installing all the prerequisites listed above, click Start >> Programs >> Visual Studio 2019 >> Visual Studio 2019 on your desktop. Click New >> Project.
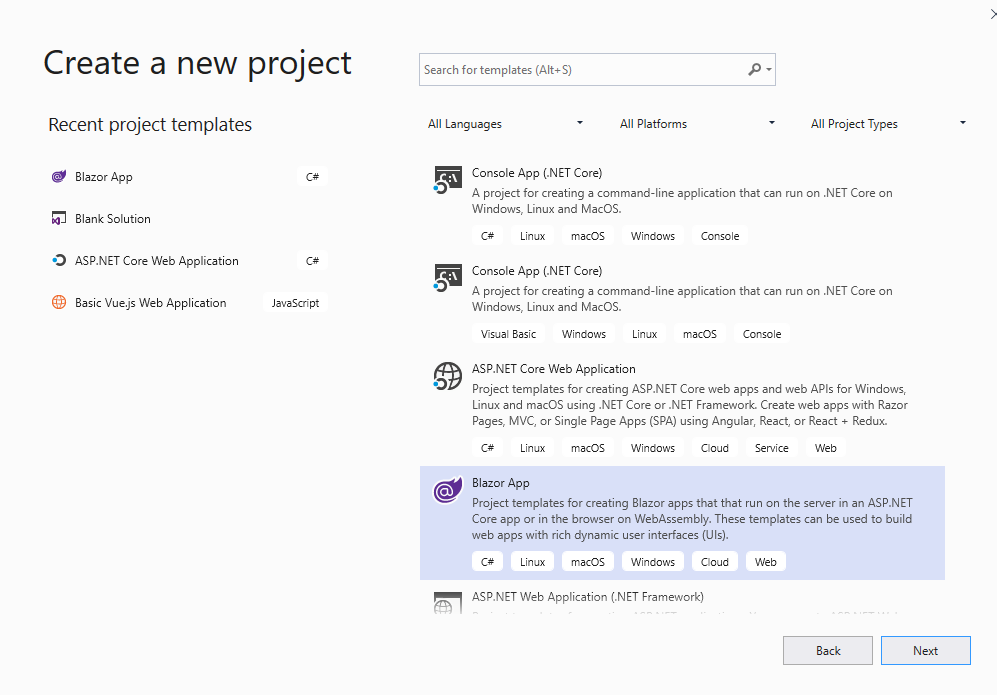
Select Blazor App and click Next button.
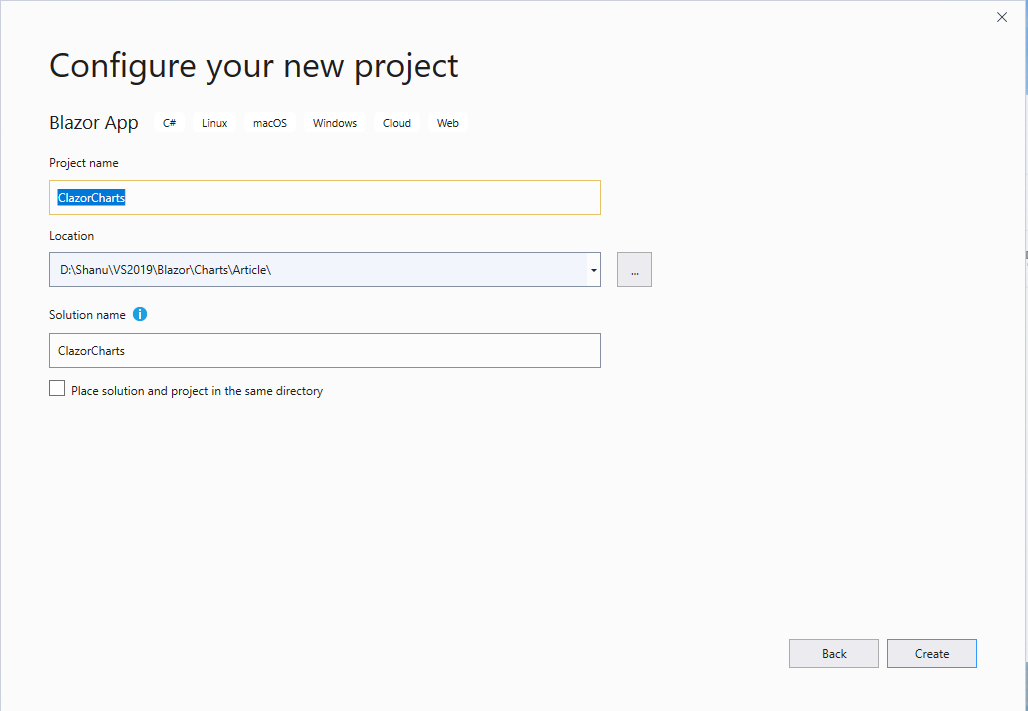
Select your project folder and Enter your Project name and then click Create button.
Select Blazor Server App

After creating ASP.NET Core Blazor Server Application, wait for a few seconds. You will see the below structure in solution explorer.

In the Data folder we can add all our Model, DBContext Class, Services and Controller, we will see that in this article.
In the Pages folder we can add all our component files.component file all should have the .razor extension with the file name.
In the Shared folder we can add all left menu form NavMenu.razor file and change the main content from the MainLayout.razor file.
In the _Imports.razor file we can see all set of imports has been added in order to use in all component pages.
In the App.razor file we will add our main component to be displayed by default when run in browser.Appsertings.json can be used to add the connection string.
Startup.cs file is important file where we add all our endpoints example like Controller end points, HTTP Client,add services and dbcontext to be used in startup Configuration method.
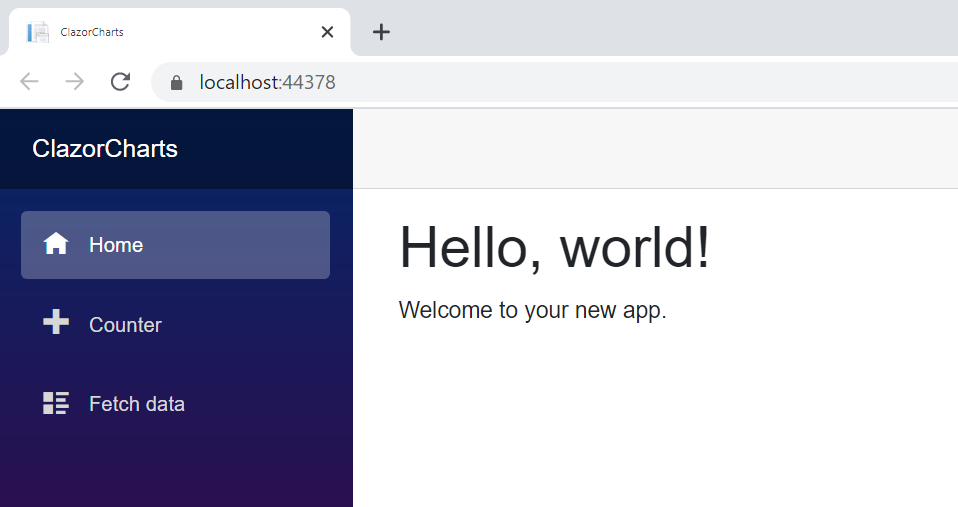
Run to test the application
When we run the application, we can see that the left side has navigation and the right side contains the data. We can see as the default sample pages and menus will be displayed in our Blazor web site. We can use the pages or remove it and start with our own page.
Step 2 Install the Packages
To use the Blazor Canvas Extension in our Blazor Application we need to install the below packages
Blazor.Extensions.Canvas
Right click the solution and click on the Manage Nuget package. Search for all the packages and install all the needed packages like below image.

After installing the package, we can confirm it from Dependencies Packages.

Note: Add the blazor.extensions.canvas.js File
Open the _Host.cshtml file and add the below code inside the head tag.
<script src="_content/Blazor.Extensions.Canvas/blazor.extensions.canvas.js"></script>

Step 3 Create Model Class
Next, we need to create the Model class for using in our application for binding the Item name And Item count in the Bar Chart.
Right Click the Data Folder and create new class file as “ItemMaster.cs”

In the class we add the property field name same as like below code.
public String ItemName { get; set; }
public int SaleCount {  get; set; }
Creating Service Class
Next we create the ItemMasterService class in order to bind the result in chart with sample Item details with the Item Name and Sale Count per each item. For this we right click on the Data folder and click on Add New Item to add our ItemMasterService class.

In this class we create a method to get the ItemMaster details with sample 5 records of Items with item Name and Sale count per each item as random values.
public  class ItemMasterService
  {
    public Task<ItemMaster[]> GetItemMasters()
    {
      var rng = new Random();
      int ivale = 0;
      return Task.FromResult(Enumerable.Range(1, 5).Select(index => new ItemMaster
      {
        ItemName = "itm" + rng.Next(1, 100),
        SaleCount = rng.Next(20, 100),
      }).ToArray());
    }
  }
Step 4: Add the Service to the Startup.cs
We need to add the services created by us to the Startup.cs ConfigureServices method.
services.AddSingleton<ItemMasterService>();
Step 5: Working with Client Project
First, we need to add the Razor Component page
Add Razor Component
To add the Razor Component page right click the Pages folder from the Client project. Click on Add >> New Item >> Select Razor Component >> Enter your component name,Here we have given the name as DrawingSample.razor
Note all the component file need to have the extentions as .razor.

In Razor Component Page we have 3 parts of code as first is the Import part where we import all the references and models for using in the component, HTML design and data bind part and finally we have the function part to call all the web API to bind in our HTML page and also to perform client-side business logic to be displayed in Component page.
Import part
First, we import all the needed support files and references in our Razor View page. Here we have first imported our Model class to be used in our view and also imported Blazor Canvas Extension for drawing our own chart control for Blazor applications.
@page "/drawingsample"
@using Blazor.Extensions.Canvas
@using  Blazor.Extensions;
@using Blazor.Extensions.Canvas.Canvas2D;
@using  ClazorCharts.Data
@inject ItemMasterService MasterService
HTML design and data Bind part
Next, we design our DrawingSample details page to display the Bar Chart with item name and Sales count per each item. Here we have added the Blazor Extension Canvaz HTML5 canvas in our Blazor HTML design part for drawing the bar chart.
<h3>Shanu - Draw Bar Chart using Blazor Canvas Extensions</h3>
<hr />
<BECanvas  Width="500"  Height="500" @ref="_canvasReference"></BECanvas>
Function Part
Function part to get the Service result and bind the result in array and to draw and plot the values for displaying the bar chart.
Here first we declare the ItemsArray to get bind the result of Item Mater in BarChart.
Next we create an string array as pirChartColor to draw each bar with different color from the array.
In OnInitializedAsync we get the ItemMasterService result and bind the result in the ItemsArrys.
In OnAfterRenderAsync Method we draw the Bar Chart using C# draw objects to the Canvas.
@code {
  private Canvas2DContext _context;
  protected BECanvasComponent _canvasReference;
  ItemMaster[] itemsArrys;
  private  static readonly  string[] pirChartColor = new[]
   {
   "#3090C7", "#BDEDFF", "#F9B7FF", "#736AFF", "#78C7C7", "#B048B5", "#4E387E","#7FFFD4", "#3EA99F", "#EBF4FA", "#F9B7FF", "#8BB381",
     //"#6CBB3C", "#F87217", "#EAC117", "#EDDA74", "#CD7F32", "#CCFB5D", "#FDD017", "#9DC209", "#E67451", "#728C00","#617C58", "#64E986"
    };

  protected override async Task OnInitializedAsync()
  {
    itemsArrys = await MasterService.GetItemMasters();
  }

  protected override async Task OnAfterRenderAsync(bool firstRender)
  {
    int lastend = 0;
    int  xSpace = 10;
    int XvalPosition = xSpace;
    int  maxDataVal = itemsArrys.Max(row => row.SaleCount);

    int  widthcalculation = (Convert.ToInt32(_canvasReference.Width) - 100) / itemsArrys.Length;

    int  chartHeight = Convert.ToInt32(_canvasReference.Height) - 40;

    this._context = await this._canvasReference.CreateCanvas2DAsync();
    int colorval = 0;

    // Draw the axises

    await this._context.BeginPathAsync();
    await this._context.MoveToAsync(xSpace, xSpace);

    // first Draw Y Axis

    await this._context.LineToAsync(xSpace, chartHeight);

    // Next draw the X-Axis
 }
  }
}
Navigation Menu
Now we need to add this newly added DrawingSample Razor page to our left Navigation. For adding this, open the Shared Folder and open the NavMenu.cshtml page and add the menu.
<li  class="nav-item px-3">
      <NavLink class="nav-link" href="DrawingSample">
        <span class="oi oi-list-rich" aria-hidden="true"></span> Bar Chart
      </NavLink>
    </li>
Build and Run the Application
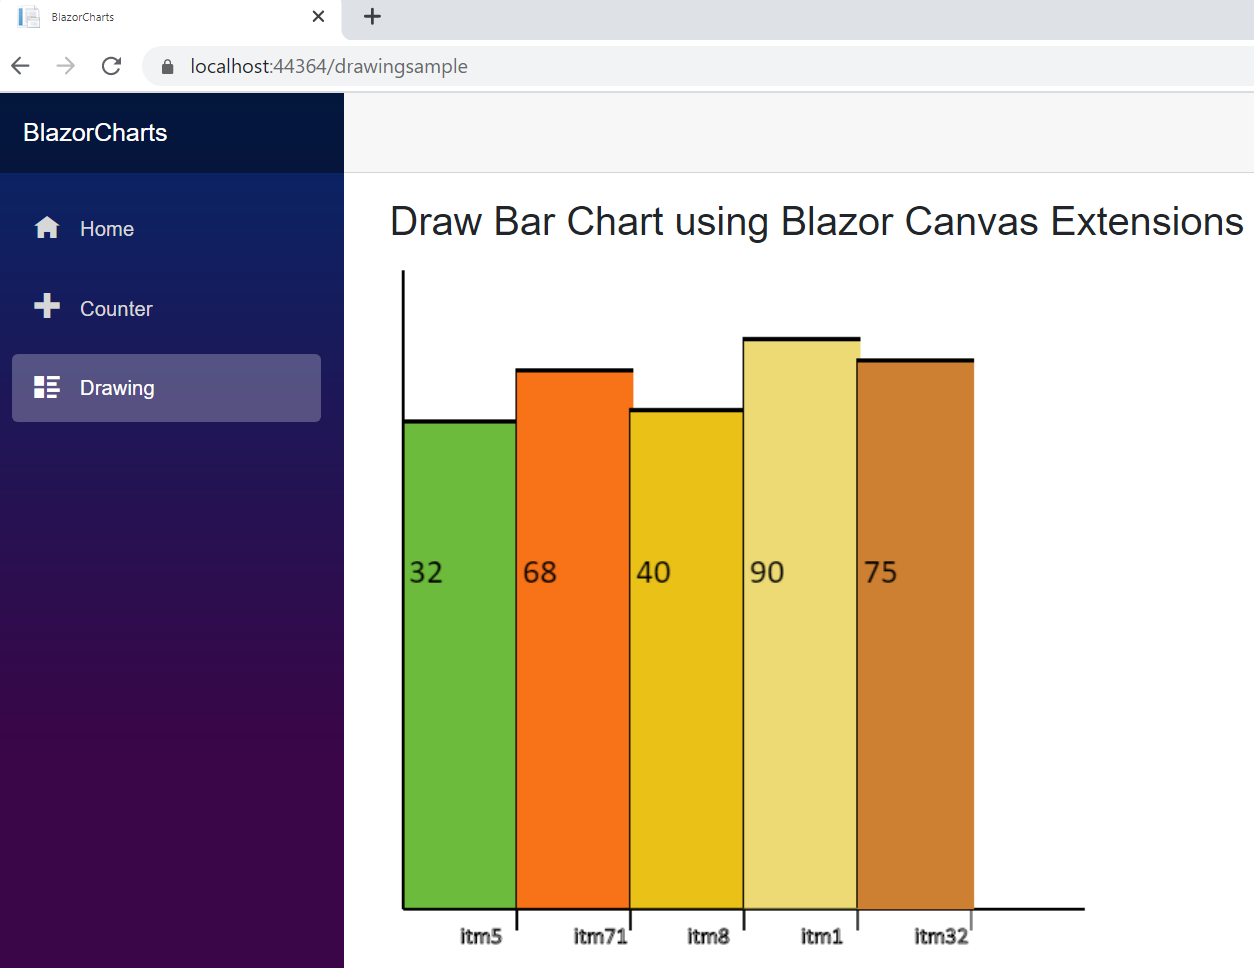
Conclusion
In this sample we have used the simple method to display the barchart with in 0 to 100 range values. In order to use for any scale, we can find the ratio of the each bar and draw the chart. Also we can extend this chart to draw the Legend and other details.AS this is our own Chart we can add any functions as per our need.
See Also
- All you need to know on Blazor app and create ASP.NET Core Blazor CRUD App using VS 2019, .NET Core 3 , Web API
- ASP.NET Core Blazor CRUD using Entity Framework and Web API
- ASP.NET Core Blazor Filtering and Sorting using Entity Framework and Web API
- ASP.NET Core Blazor Master Detail Grid with Filtering and Sorting using EF and Web API
- Visual Studio 2019 RC: Getting Started (Part 1)